Australian Student Accommodation Market Update 2015 - June 2015 - JLL
←
→
Page content transcription
If your browser does not render page correctly, please read the page content below

Australian Student Accommodation
Market Update 2015

June 2015
JLL’s second student accommodation market update provides
an overview of Purpose Built Student Accommodation (PBSA) in
Australia. Over the last 12 months there has been a significant
increase in awareness of this emerging asset class. Whilst the
appetite for institutional investment is growing, there are at present
few opportunities to enter the market. There have been limited
transactions as the main developers are focusing on developing and
then holding the finished assets.

This paper provides an overview of the Australian Higher Education
market, an update on student demographics, a summary of the
existing supply of accommodation, analysis of the development
pipeline and predictions for the forthcoming year. Key observations
include:

• Australia is the fifth most popular study destination for international
  students behind the USA, the UK, Germany and France.
• Recent surveys and rankings indicate Australia’s top universities are
  becoming more prominent on the global stage and Australia’s top
  cities rank highly as study destinations.
• Total student numbers in Australia have increased 4.4% in the last
  12 months and international student numbers in Higher Education
  are rising rapidly with growth of 8.9% in the last year.
• The top five nationalities of international students studying in
  Australia, are China (26.8%), India (10.2%), Republic of Korea
  (4.5%), Vietnam (4.9%) and Malaysia (4.2%).
• The five countries with the strongest growth in international student
  numbers in Australia in 2014 are India (28.1%), Nepal (19.7%),
  Pakistan (18.8%), Brazil (18.5%) and Thailand (15.2%).
• There are 58,109 beds of PBSA in the top six Australian
  metropolitan localities representing an increase in supply of 4,647
  beds (8.7%) in the last 12 months.
• Brisbane, Melbourne and Sydney have development pipelines of
  8,661, 6,856 and 4,954 beds respectively.
• The total number of beds under control of the top 10 providers has
  increased 11% from 33,518 in 2014 to 37,068 in 2015.
• Total beds in the development pipeline for the top 10 providers have
  increased 19% from 5,774 in 2014 to 6,853 in 2015.

Australian Higher Education
Australia is an attractive destination for upwardly mobile international                                The Times World University Rankings 2014 / 2015 has five Australian
students offering high quality English speaking universities, world-                                    universities in the top 100 with the University of Melbourne ranking the
class cities to live in, relatively safe community environments and                                     highest at 33rd. All but one of the five universities have increased in
improving affordability. It is currently ranked fifth in the world as the                               rankings in the last 12 months. The Australian National University has
most popular study destination behind the United States of America                                      moved up three places to 48th. The University of Sydney has seen
(USA), the United Kingdom (UK), Germany and France1.                                                    the greatest movement of 12 places to 60th. Monash University has
                                                                                                        moved up eight places to 91st. The University of Queensland was the
Australia features prominently in the QS World University Rankings
                                                                                                        only Australian University in the top 100 to drop in the rankings from
2014 / 2015 with five universities in the top 50 and eight universities
                                                                                                        63rd to 65th (Table 2).
in the top 100. As detailed in the table below, over the last 12 months,
the Australian National University has moved up two as Australia’s                                      The QS World Ranking for Best Student Cities 2015 has placed six
best performing University at 25th. The University of Melbourne                                         Australian cities in the top 50 overall. Melbourne is placed second
dropped two places to 33rd. The University of Sydney has moved                                          after Paris, London is ranked third, followed by Sydney in fourth.
up one place to 37th. The University of Queensland has remained at                                      Further down, Canberra is placed in 21st, Brisbane 23rd, Adelaide
43rd and the University of New South Wales has entered the top 50 at                                    29th and Perth is ranked 38th3.
48th2 (Table 1).

Table 1: The QS World University Rankings 2013/2014 and 2014/2015
                                                                                                                                                                         2013-2014     2014-2015
  115
  105                                                                                                                                                                                104
   95                                                                                                                                                                                       100
   85                                                                                                                                                         84         89
   75
                                                                                                                                     69          70
   65
   55                                                                                                        52        48
   45                                                        38                      43        43
   35                                                                    37
                                     31         33
   25         27        25
                                                                                       Movement in Ranking
          The Australian    The University of               University of           University of      University of New             Monash              The University of      The University of
        National University    Melbourne                      Sydney                Queensland           South Wales                University           Western Australia          Adelaide

                   2                   -2                         1                       0                       4                   -1                       -5                      4
Source: The QS World Rankings 2013 – 2014 and 2014 – 2015

Table 2: The Times World University Ranking 2013/2014 and 2014/2015
                                                                                                                                                                         2013-2014     2014-2015
  200
  180                                                                                                                                                                           168
  160                                                                                                                                                                                      157
  140
  120                                                                                                                                                   114
  100                                                                                                                       91                                     109
   80                                                               72                                                                83
   60                                                                          60               63        65
                                          48         45
   40
              34        33
   20
                                                                                       Movement in Ranking
           The University of           The Australian               University of               University of                Monash                   University of New       The University of
              Melbourne              National University              Sydney                    Queensland                  University                  South Wales           Western Australia

                   1                           3                       12                           -2                           8                            5                      11
Source: The Times World University Rankings 2013 – 2014 and The Times World University Rankings 2014 – 2015
1 Australian Government Department of Education International Student Data (April 2015) – “International Student Survey 2014 Overview report”.
2 QS World University rankings 2014/2015.
3 QS Best Student Cities 2015.

                                                                                                                                     Australian Student Accommodation Market Update 2015 | 3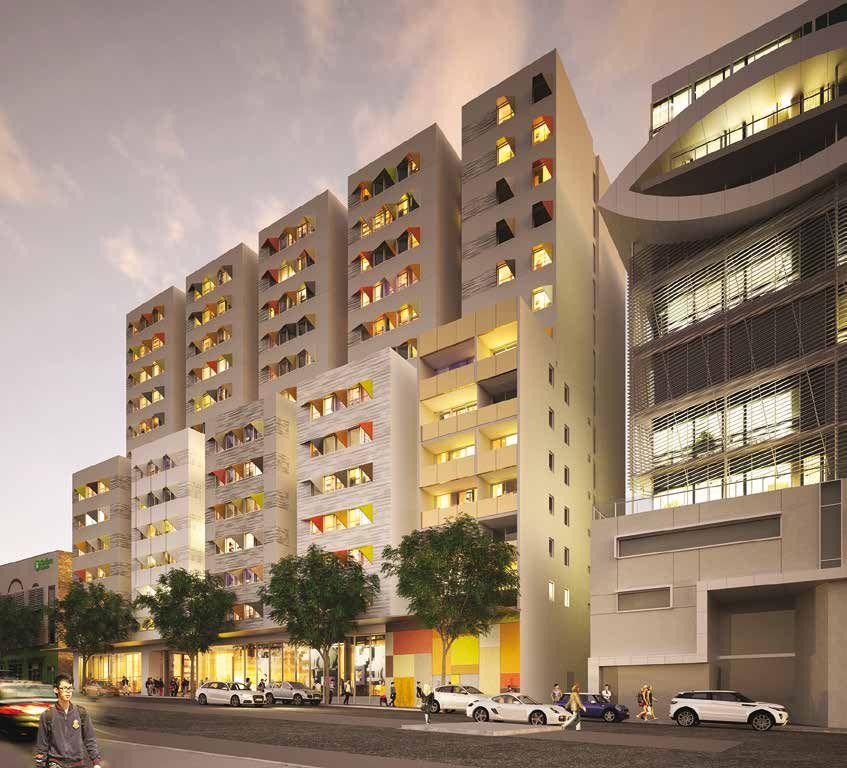
International students are generally very satisfied with their study                                  A key issue highlighted in the survey is the cost of living in Australia.
experience in Australia, but living costs and affordability are areas                                 Areas that experienced the lowest levels of satisfaction are
of concern. The Department of Education and Training has recently                                     accommodation costs, living costs, earning money and financial
published the International Student Survey 2014 following similar                                     support, with positive responses as low as 49%5. However, the
surveys in an internationally established format that have been carried                               Mercer’s 2014 Cost of Living Rankings has seen significant drops in
out in 2012 and 2010. The report found that Higher Education in                                       the relative affordability of the main Australian cities benchmarked
Australia is globally recognised and has strong levels of satisfaction                                against other major global cities in the last 12 months. The findings of
among students with the quality of education provided. Australia has                                  the research appear to be mainly driven by the recent depreciation of
a well-developed higher education sector that enables international                                   the Australian dollar.
students to learn and achieve at a high level.
                                                                                                      As summarised in the following table, Canberra fell the most with 26
Results of the 2014 survey showed an 87% overall satisfaction rating                                  places, followed by Adelaide falling 25 places, Brisbane 24 places,
from international students in all sectors of education provided in                                   Perth 19 places and Sydney and Melbourne by 17 places each6.
Australia. This rating assesses satisfaction levels based on expert                                   (Table 3).
lecturers, course content and libraries / laboratories at their disposal,
with all criteria recording ratings in the high 80% and low 90% range4.

Table 3: Mercer’s 2013 and 2014 Cost of Living Rankings for Major Australian Cities
                                                                                                                                             Ranking 2013         Ranking 2014
   60                                                                                                                                                               59
   50                                                                                                                   52                 53
   40
                                                                                        37                                                                   34
   30                                                    33
                          26                                                                                   28                    27
   20
                                                16                              18
   10
    1             9

                                                                            Movement in Ranking 2013 to 2014
                  Sydney                        Melbourne                          Perth                        Brisbane             Canberra                 Adelaide

                 -17                            -17                            -19                             -24                  -26                     -25
Source: Mercer’s 2014 Cost of Living City Rankings (July 2014).

4 & 5 Australian Government Department of Education and Training – International Student Survey 2014 Overview Report.
6 Mercer’s 2014 Cost of Living City Rankings (July 2014).

4 | JLL
Student Demographics
Total student numbers in Australia over the last 12 months have                                        Many of Australia’s main universities are located in major metropolitan
shown modest growth. Based on the latest Department of Education                                       areas in and around Central Business Districts (CBD’s). Three-
and Training data as of 2013 (most recent data available) there were                                   quarters (981,427) of students study in the three Eastern states (New
a total of 1,313,776 full and part-time, domestic and international                                    South Wales, Victoria or Queensland) with Australia’s three largest
students in Australia who were enrolled at a Higher Education Provider                                 cities (Sydney, Melbourne and Brisbane). The table below shows
(HEP). This number represents an increase of 4.4% from 2012 with                                       the breakdown of domestic and international students by State and
70% (924,845) studying full time, while 30% (388,931) were part time.                                  Territory (Table 5).
(Table 4).

Table 4: Summary of Total Student Enrolments in 2013

       Full-time                                Study Mode                                   Part-time                     Study Mode           Total Students
       Students                                                                              Students

                     652,089                       Domestic             333,028                                              Domestic           985,117

                     272,756                     International             55,903                                          International        328,659
       Total         924,845                                            388,931                                                              1,313,776
Source: Australian Government Department of Education and Training (uCube) which is based on the student and staff data collections (2013).

Table 5: Student Enrolments by State and Territory in 2013

       Domestic                                                                                                                                                            International

  319,000                                                                             New South Wales                                                                         87,034
  231,714                                                                                      Victoria                                                                     112,944
  180,524                                                                                  Queensland                                                                        50,211
  101,118                                                                              Western Australia                                                                      36,989
     67,178                                                                              South Australia                                                                      23,023
     22,036                                                                                  Tasmania                                                                          4,872
      9,704                                                                            Northern Territory                                                                      1,161
     28,003                                                                                      ACT                                                                             9,377
     25,840                                                                                 Multi-State                                                                          3,048
  985,117                                                                                       TOTAL                                                                       328,659
Source: Australian Government Department of Education and Training (uCube) which is based on the student and staff data collections (2013).

7 Australian Government Department of Education and Training (uCube) which is based on the student and staff data collections (2013).

                                                                                                                                    Australian Student Accommodation Market Update 2015 | 5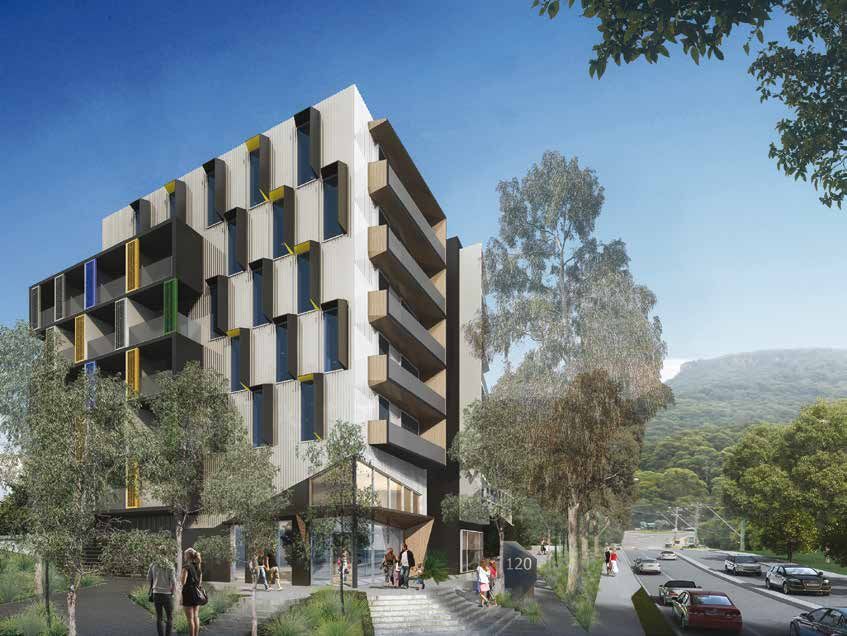
Australian Government Department of Education and Training data The following chart based on International Student Enrolments in
indicates that in 2014 there were a total of 453,532 international full Australia demonstrates growth over the last 20 years. 2014 saw a
and part time students studying on a student visa in Australia. This peak in international enrolments at 249,990 students and an increase
represents an increase of 10.4% over 2013 international student of 8.5% since 20138. The total number of enrolments is higher than
numbers (410,925). the international student visa data as a student attending two different
courses in the same period (for example ELICOS and Bachelor
As detailed in Table 6, 236,249 (52.1%) of the international students Degree in Higher Education) will have both enrolments counted
in Australia on a student visa are studying in Higher Education (Figure 1).
with growth of 8.9% from 2013 to 2014. It is also clear that there is
strong growth in other areas of the Australian international student
market, however for the purpose of this paper we focus on the Higher
Education students as this cohort generates greater demand for Figure 1: International Student Enrolments in Australian Higher
Education 1994 – 2014
PBSA.
300,000
250,000
200,000
150,000
100,000
50,000
1994
1995
1996
1997
1998
1999
2000
2001
2002
2003
2004
2005
2006
2007
2008
2009
2010
2012
2013
2014
2011
0
Source: Australian Government Department of Education and Training –
International student enrolments in Australia 1994-2014.
Table 6: International Students in Australia 2014
216,971
Total Number of Total Number of Total Growth 236,249
Students 2013 Students 2014 2013-2014 8.9%
410,925 453,532 10.4% 2014 Proportion
of Students
52.1%
98,264 93,795
109,305 112,516
11.2% 20.0% Higher
Education
2014 Proportion 2014 Proportion
27,857 of Students of Students
17,644 34,125
18,206 22.5% 24.1% 24.8%
3.2%
2014 Proportion
2014 Proportion of Students ELICOS
VET
of Students
7.5%
4.0%
Schools Non-award
* The total is less than the sum of its components as individual students can undertake study in more than one sector during the year.
Source: Australian Government Department of Education Research Snapshot (March 2015) – “International student numbers 2014”.
8 Australian Government Department of Education International Student Data (March 2015) – “International Student Enrolment Data 2015”.
6 | JLL
In 2014 Australia’s international students were from 191 different Despite providing over one quarter of international students in
countries. The largest source of international students studying in Australia, the growth in Chinese students was only 1.8% between
Australia are from the Asia Pacific region. The top five nationalities 2013 and 2014. This is substantially lower than many of the other top
of international students studying in Australia, are China (26.75%), 10 source countries. Based on the data in the following table, the five
India (10.23%), Vietnam (4.85%), Republic of Korea (4.45%) and countries with the strongest growth in international student numbers in
Malaysia (4.23%). The top ten countries together contributed 65.7% 2014 are India (28.09%), Nepal (19.73%), Pakistan (18.75%), Brazil
of total international student numbers. Nine of the top ten nationalities (18.49%) and Thailand (15.18%). Pakistan’s growth in the last year
recorded more than 13,000 students studying onshore in Australia9 resulted in the country entering the top 10 source countries, replacing
(Table 7). the USA (Table 8).
Table 7: Top 10 countries providing International Student Numbers in Australia in 2014 155,376
34.26%
121,318
Total Number of Total 26.75%
Students 2014 Percentage Other
Nationalities
453,532 100% China
46,380
10.23%
19,201 20,178 21,987
10,790 13,491 13,726 14,970 16,115
3.30% 3.55% 4.23% 4.45% 4.85%
2.38% 2.97% 3.03%
India
Malaysia Republic of Vietnam
Nepal Indonesia Brazil Thailand
Pakistan Korea
*International student numbers relate only to international students in Australia on a student visa and are derived from AEI enrolments data.
Source: Australian Government Department of Education Research Snapshot (March 2015) – “International student numbers 2014”.
Table 8: International Student Numbers in Australia Growth between 2013 and 2014 36,208
46,380
28.09%
Total Number of Total Number of Total Growth 11,268
Students 2013 Students 2014 2013-2014 12,634 9,086
10,790 13,491
10.37%
14,970 India
410,925 453,532 136,093
155,376
13,991
16,115 18.49% 18.75% 19.73%
20,078
14.17% 15.18%
21,987 Nepal
Brazil Pakistan
13,319
9.51%
119,237 18,855 Thailand
13,726 Other
20,156 121,318 19,201 Nationalities
20,178 3.06%
1.75% 1.84% Vietnam
0.11%
China Indonesia
Malaysia
Republic
of Korea
*International student numbers relate only to international students in Australia on a student visa and are derived from AEI enrolments data.
Source: Australian Government Department of Education Research Snapshot (March 2015) – “International student numbers 2014”.
9 Australian Government Department of Education Research Snapshot (November 2014) – “Export income to Australia from international education activity in 2013-14”.
Australian Student Accommodation Market Update 2015 | 7
International students studying and living in Australia contributed                                    International education exports (classified as “education-related travel
$15.7 billion to the Australian economy in the financial year to June                                  services” by the Australian Bureau of Statistics (ABS) were ranked
2014. As detailed in the chart below, this is the first increase since the                             third in terms of total Australian exports for 2013, behind iron ore and
2009 / 2010 financial year and an 8.2% increase from $14.6 billion                                     coal as detailed in Figure 3.
in the 2012 / 2013 financial year. In addition, sundry international
education activities contributed $581 million in 2013 / 201410 to give
total educational export income during this period of $16.3 billion.
(Figure 2).

Figure 2: Export Income from Australian Educational Services                                           Figure 3: Australia’s Top 10 Goods and Services Exports 2013
2008 - 2014

AUD ($billion)                                                                                         AUD $Billion
  17                                                                                                   80     Iron &
                                                                                                              concentrates
16.5                                                                                                   70

   16                                                                                                  60                  Coal

                                                                                                                                Education
15.5                                                                                                   50
                           2009-2010

                                                                                                                                  -related
                                                                                                                              travel services
                                                                                     2013-2014
                                         2010-2011

14.5                                                                                                   40
            2008-2009

                                                                                                                                                         Personal travel
                                                        2011-2012

                                                                                                                                           Natural      (excl education)
                                                                       2012-2013

                                                                                                                                            gas             services
   14                                                                                                  30                                                                         Aluminun ores
                                                                                                                                                                        Crude        and conc
                                                                                                                                                     Gold             petroleum   (incl alumina)
13.5                                                                                                   20
                                                                                                                                                                                              Beef
                                                                                                                                                                              Wheat           f.c.f.
Source: Australian Government Department of Education and Training                                     10
(November 2014) – Export income to Australia from international education
activity in 2013 - 2014
                                                                                                        0
                                                                                                       Notes: Goods trade are on a recorded trade basis, Services trade are on a
                                                                                                       balance of payments basis. Total is balance of payments basis.
                                                                                                       Source: http://dfat.gov.au/trade/resources/trade-at-a-glance/Pages/top-goods-
                                                                                                       services.aspx

10 Australian Government Department of Education Research Snapshot (November 2014) – “Export income to Australia from international education activity in 2013-14”.

8 | JLL
Existing Supply of Accommodation
JLL’s analysis of the existing supply of accommodation considers the
six main Higher Education cities across Australia (Sydney, Melbourne,
Brisbane, Adelaide, Canberra and Perth). In Sydney, Melbourne
and Brisbane the analysis focuses on the supply of accommodation
provided in the Greater Capital City Statistical Areas (as defined by the
ABS). In addition to these bedrooms, there is an existing and growing
supply of PBSA in other localities. JLL research indicates that in 2015
there are 58,109 beds of PBSA in the top six localities representing
an increase of 4,647 beds (8.7%) in the last 12 months. We consider
that this increase in supply is both through the development of new
accommodation and adjustments to our survey methodology (Table 9).

Table 9: 2015 Accommodation Supply in Major Australian Cities

             University Provision   Commercial Provision   Total Accommodation
                   (beds)                (beds)                    (beds)

 Sydney            7,296                  7,513                 14,809
 Melbourne         5,930                  10,058                15,988
 Brisbane          3,929                  5,525                  9,454           In Sydney the commercial provision has increased by circa 1,000
                                                                                 bedrooms. This includes the completion of Urbanest Central and
 Adelaide          2,313                  3,190                  5,503
                                                                                 UniLodge at Central Park developed by Frasers. Urbanest have also
 Perth             3,929                   839                   4,768           opened Melbourne Central in La Trobe Street in 2015.
 Canberra          3,207                  4,380                  7,587
                                                                                 University Colleges Australia (UCA) research indicates that, as
 Total          26,604                  31,505                 58,109            at November 2014, there was a total of 74,482 beds provided
                                                                                 in University Colleges, Halls of Residence and private sector
Source: JLL Student Accommodation Database 2015.                                 providers over 100 beds. This includes 60,291 (81%) of surveyed
                                                                                 accommodation in metropolitan areas and 14,191 (19%) in regional
                                                                                 areas. JLL’s analysis of the metropolitan accommodation on a state
                                                                                 by state basis and at national level is consistent with these survey
                                                                                 findings.

                                                                                 As detailed in the following charts, JLL’s analysis of the existing supply
                                                                                 of PBSA (provided by both the universities and commercial operators)
                                                                                 indicates that in all the major Australian metropolitan locations apart
                                                                                 from Canberra, there is currently less than one bedroom of purpose
                                                                                 built accommodation for every 10 students. Canberra has one bed per
                                                                                 five students. All of the major Australian cities have less provision than
                                                                                 more established markets such as London, where the ratio is less than
                                                                                 one bedroom per four students (27% of full-time students can access
                                                                                 PBSA).

                                                                                                       Australian Student Accommodation Market Update 2015 | 9
Where Students Live 2015
           Sydney
                                                        177,806                                                  7,513         7,296
                                                        Students                                                Students      Students

           Total - 192,615 students
                                                        92.3%                                                     3.9%          3.8%
           Melbourne                                    235,506                                                      10,058   5,930
                                                        Students                                                    Students Students

           Total - 251,494 students
                                                        93.6%                                                          4%        2.4%
           Brisbane                                     124,217                                                    5,525         3,929
                                                        Students                                                  Students      Students

           Total - 133,671 students
                                                        92.9%                                                       4.1%         2.9%
           Adelaide                                      58,348                                                 3,190            2,313
                                                        Students                                               Students         Students

           Total - 63,851 students
                                                         91.4%                                                   5.0%           3.6%
           Perth                                         93,586                                                      839     3,929
                                                        Students                                                   Students Students

           Total - 98,354 students
                                                        95.2%                                                       0.9%         4%
           Canberra                                      18,947                                     4,380                  3,207
                                                        Students                                   Students               Students

           Total - 26,534 students
                                                        71.4%                                      16.5%                  12.1%

           London                                       211,442                                 26,575                52,298
                                                        Students                                Students             Students

           Total - 290,315 students
                                                         72.8%                                   9.2%                18.0%
            Living with parents, renting or living
            elsewhere (including serviced apartments)   Commercial Provision (Primarily PBSA)         University Provision (Primarily on-campus)

Source: JLL Student Accommodation Database 2015.

10 | JLL
Pipeline
The following table indicates that even if all of the pipeline
accommodation is delivered in Sydney, Melbourne and Brisbane, the
total supply will be 10.26%, 9.08% and 13.55% of existing full-time
students respectively. Overall provision at these levels compares
favourably on an international basis to the more mature market of
London which currently has 27% PBSA provision. This analysis also
does not take into account that student numbers in Australia are
growing and are expected to continue to do so during delivery of the
pipeline accommodation (Table 10).
Table 10: Student Accommodation Pipeline Accommodation Analysis
SYDNEY
Approximate Number of Beds
in Development Pipeline 4,954
Total Full Time Student Numbers 192,615
Proportion of Total Students (Pipeline) 2.57%
Existing Supply of Beds 14,809
Proportion of Total Students (Existing and Pipeline) 10.26%
MELBOURNE
Approximate Number of Beds
in Development Pipeline
6,856
Total Full Time Student Numbers 251,494
JLL pipeline analysis focusses on Australia’s three largest cities
Proportion of Total Students (Pipeline) 2.73%
Sydney, Melbourne and Brisbane and within each of those localities
on site specific projects (i.e. excluding publically stated University Existing Supply of Beds 15,988
strategies for additional student accommodation). JLL research
indicates that Brisbane and Melbourne have the most significant Proportion of Total Students (Existing and Pipeline) 9.08%
amounts of pipeline development with 8,661 and 6,856 beds
respectively. Sydney has a pipeline of 4,954 beds. BRISBANE
Approximate Number of Beds
Pipeline proposals are at varying stages of development and have in Development Pipeline 8,661
the potential to be delivered over several years. Some are at an early
stage of feasibility with no development application having been Total Full Time Student Numbers 133,671
submitted, others have submitted a development application and
other schemes have development approvals granted. It is important Proportion of Total Students (Pipeline) 6.48%
therefore to consider a strong probability that a number of these
proposals may change significantly, or may not be delivered at all. Existing Supply of Beds 9,454
Proportion of Total Students (Existing and Pipeline) 13.55%
Total Number of Beds in Development Pipeline 20,471
Source: JLL Student Accommodation Database 2015.
Australian Student Accommodation Market Update 2015 | 11Supply Gap
The following table provides high level analysis of the potential
shortfall of the existing provision of PBSA for international students in
Sydney, Melbourne and Brisbane. This does not include an analysis
of the propensity of students to take up student accommodation,
therefore the table below shows the current gap between the supply
(including existing and pipeline) of beds and the total number of
full-time international students, rather than an indication of the current
total ‘undersupply’ of accommodation. This analysis does however
indicate that there is headroom in each of the major cities (Table 11).
Table 11: International Students - Headroom Supply Analysis
Sydney Melbourne Brisbane
Total Number of
International Students 49,124 92,167 33,424
(2014)
Existing Supply 14,809 15,988 9,454
Pipeline Supply 4,954 6,856 8,661 An additional analysis based on the UCA calculation of mobile Higher
Education Students which includes international, domestic – interstate
Existing Gap 34,315 76,179 23,970 and domestic intrastate students based on 2013 student numbers
indicates more headroom in each of the major cities (Table 12).
Potential Gap if all
Pipeline Delivered 29,361 69,323 15,309
Table 12: UCA Mobile Students - Headroom Supply Analysis
Source: Australian Government Department of Education and Training
(uCube), JLL Student Accommodation Database 2015.
Sydney Melbourne Brisbane
Total Number of
Mobile Students 95,618 96,174 60,032
(2013)
Existing Supply 14,809 15,988 9,454
Pipeline Supply 4,954 6,856 8,661
Existing Gap 80,809 80,186 50,578
Potential Gap if all
Pipeline Delivered 75,855 73,330 41,917
Source: UCA - National Census of University Student Accommodation
Providers 2014, JLL Student Accommodation Database 2015.
12 | JLLSydney Development Pipeline
Sydney City attracts the most interest from student
accommodation developers and investors drawn by an acute
shortage of high quality student accommodation and global
recognition as an attractive location to study and live. Overall
Sydney’s development pipeline has fallen from 5,241 in 2014
to 4,954 beds in 2015 mainly attributed to the completion of
Urbanest Central on Wattle Street and Frasers Kensington Street
(UniLodge @ Central). A large number of beds are scheduled for
completion in Semester Two 2015. The pipeline forecast beyond
2016 is significantly lower and reflects the feasibility of student
accommodation development against other competing asset
classes such as residential.
We note that the ‘Pre-Lodgement / Speculative’ dataset excludes Figure 4: Sydney Projected Development Pipeline
publically stated strategies for the delivery of new accommodation
Number of Beds
from universities. This excludes 4,500 new beds planned to be
2,500
delivered by the University of Sydney over the next five years,
2015
but includes 1,500 beds which are currently planned for or under
2,000
construction in College extensions, the redevelopment of the Queen
Mary Building and the new Business School (Table 13). 1,500 2017
There are a total of 4,954 beds in the Sydney pipeline. As detailed in 2019+
1,000
the following chart, these are forecast to be delivered over the next
five plus years. In the second Semester of 2015 several properties are
500
due for completion including Urbanest Darlington, Frasers ‘The Steps’ 2018
2016
and two projects from the University of Sydney, the Queen Mary
0
Building and the Business School accommodation (Figure 4).
Pre-Lodgement / DA Submitted DA Approved / Under
Speculative Construction
Table 13: Sydney Development Pipeline by Stage
Source: JLL Student Accommodation Database 2015.
Percentage of
Number of Beds Total Pipeline
Pre-Lodgement /
If all of the 4,954 beds above are completed, this represents 4.4% of
Speculative
1,190 24% additional current full-time student numbers who will be able to access
University or commercially provided PBSA, leaving 172,852 (88%) full
time students who will rent from the private residential sector or live at
DA Submitted 427 9% home.
DA Approved /
Under Construction
3,337 67%
Total 4,954 100%
Source: JLL Student Accommodation Database 2015.
Australian Student Accommodation Market Update 2015 | 13Melbourne Development Pipeline
Melbourne’s development pipeline has increased significantly
in the last 12 months primarily driven by universities developing
on-campus accommodation outside of the CBD. There is still
a significant shortage of high quality PBSA in proximity to the
University of Melbourne and RMIT. Feasibility of new student
accommodation development is challenging when directly
competing with alternative uses in the CBD such as residential.
A strong student accommodation pipeline is emerging from 2016
onwards with a number of new schemes proposed towards
the CBD which in some instances maybe competing with the
significant increase in residential apartments programmed for
delivery within the same timeframe.
We note that the above analysis excludes publically stated strategies Should all of the 6,856 beds above be completed, this represents
for the development of new accommodation by the universities. This 2.7% of additional current full-time student numbers who will be
includes a target of 2,000 beds that the University of Melbourne is able to access University or commercially provided PBSA, leaving
planning to deliver by 2020 (Table 14). 228,650 (90.9%) full time students who will rent private sector rental
accommodation or live at home.
There are a total of 6,856 in the Melbourne pipeline. As detailed in
the following chart over 2,000 are expected to be delivered in 2016.
This accommodation will all be provided by the universities with the Figure 5: Melbourne Projected Development Pipeline
University of Melbourne (in partnership with Campus Living Villages),
Number of Beds
Monash University and RMIT programmed to finish projects currently
2,500
under construction (Figure 5).
2019+
2016 2018
2,000
Table 14: Melbourne Development Pipeline by Stage 1,500
Percentage of
Number of Beds Total Pipeline 1,000
2017
Pre-Lodgement / 500
Speculative
3,681 54%
2015
0
DA Submitted 145 2% Pre-Lodgement / DA Submitted DA Approved / Under
Speculative Construction
Source: JLL Student Accommodation Database, 2015.
DA Approved /
Under Construction
3,030 44%
Total 6,856 100%
Source: JLL Student Accommodation Database 2015.
14 | JLLBrisbane Development Pipeline
Strong supply and demand, availability of land and support from
local government have all contributed to Brisbane’s surge in
student accommodation activity in the last 12 months. However,
75% of the current pipeline is speculative. Previously the City has
had a fragmented supply and limited high quality accommodation.
If completed, the new wave of development will establish the CBD
and South Bank as two student accommodation destinations and
ithis is expected to consolidate student focused amenities in these
areas.
Table 15: Brisbane Development Pipeline by Stage Figure 6: Brisbane Projected Development Pipeline
Percentage of Number of Beds
Number of Beds Total Pipeline 4,500
2019+
4,000
Pre-Lodgement /
Speculative
6,528 75% 3,500
3,000
2,500 2018
DA Submitted 1,349 16% 2,000
1,500 2016
2017
DA Approved /
1,000
Under Construction
784 9% 500
2015
0
Total 8,661 100% Pre-Lodgement / DA Submitted DA Approved / Under
Speculative Construction
Source: JLL Student Accommodation Database 2015.
Source: JLL Student Accommodation Database 2015.
Student accommodation development activity has risen significantly in
the last 12 months in part boosted by the City Council’s promotion of Should all of the 8,661 beds above be completed, this represents
Higher Education in Brisbane and a pro-active approach to planning 6.5% of additional current full-time student numbers who will be able
which has included a concession on infrastructure levies, but also the to access University or commercially provided PBSA, leaving 115,556
relative availability of development sites in and around the CBD and (86.4%) full time students who must rent from the private rental sector
land pricing compared to Sydney and Melbourne. The current pipeline or live at home.
includes a significant amount of projects still in the early stages of
feasibility (Table 15).
As detailed in the following chart, a limited amount of new
accommodation is programmed for completion in 2016 and 2017.
Supply of new accommodation may increase rapidly in 2018 and 2019
(Figure 6).
Australian Student Accommodation Market Update 2015 | 15The top 10 student accommodation providers
in Australia • The total number of beds either owned or managed by the top 10
The table below provides a summary of the number of beds providers in Australia have increased 9% in the last 12 months from
either owned or under management by each of the top 10 student 27,744 in 2014 to 30,215 in 2015.
accommodation providers in Australia, both on and off campus. We • Total pipeline beds have increased 19% from 5,774 in 2014 to 6,853
note the following: in 2015.
• There have been two new entrants in the top 10 this year. Living + • The total number of beds under control of the top 10 providers has
Learning Partners (L+LP) led by Balfour Beatty plc. who completed increased 11% from 33,518 in 2014 to 37,068 in 2015.
the University of Wollongong transaction and Scape Student Living,
an established UK student accommodation provider in a joint
venture with APG Asset Management who have acquired their first
site in Melbourne.
Table 16: The Top 10 Private Sector Student Accommodation Providers in Australia 2015
CLV 13 Villages/21 Sites 9,346 1,255 8,091 1,643 3 10,989
UniLodge 46 8,511 8,511 0 1270 2 9,781
Urbanest 7 3,438 3,438 3,438 1,909 4 5,347
Student
Housing 46 2,650 2,650 0 0 0 2,650
Australia
Living +
Learning 10 1,906 1,906 1,906 0 0 1,906
Partners
The Pad 105 1,800 1,800 0 84 1 1,884
YMCA 3 1,800 0 1,800 0 0 1,800
Frasers 2 271 271 271 770 1 1,041
Iglu 2 493 493 493 414 1 907
Scape 0 0 0 0 763 1 763
Total number of Total number of Total number of Total number Total number of Total number of Total number of
buildings either beds either owned operational beds of operational beds beds with buildings with operational beds
owned or under or under under wholly owned in Development Development and number of
management in management in management in Australia as at Approval or under Approval or under beds in the
Australia as at Australia as at Australia as at February 2015 construction in construction in Development
February 2015 February 2015 February 2015 Australia as at Australia as at Pipeline as at
February 2015 February 2015 February 2015
Total
242 30,215 20,324 15,999 6,853 13 37,068
Source: JLL Research 2015.
16 | JLLMarket Activity
The off-campus Australian student accommodation market is
transforming from a fragmented sector with high levels of strata
ownership to an institutional asset class. A number of global investors
have entered the market in the last five years and in 2015 there have
been three new large scale entrants. Many of the major developer /
operators in the market are now looking to grow portfolios. As such,
there have been limited transactions of existing off-campus assets in
the last twelve months.
On-campus, the largest transaction was the $250 million University of
Wollongong project which reached financial close in December 2014.
Comprising a 39-year licence of the University’s portfolio to Living +
Learning Partners (L+LP) led by Balfour Beatty plc. L + LP have taken
over the existing portfolio of 1,906 bedrooms and are planning to build
1,063 beds, taking the portfolio to circa 2,670 beds on completion11.
A key challenge facing student accommodation development across
many Australian metropolitan areas is the feasibility against other
land uses and planning regulations. Feasibility of new development
is a key barrier to entry. Key locational requirements for student
accommodation often align closely with residential development.
Therefore with the residential land and apartment markets
achieving high prices in Sydney, Melbourne and Brisbane, student
accommodation developers are having difficulty outbidding residential
developers.
Student accommodation is also often not clearly defined in planning
terms. This can cause uncertainty and risk for developers considering
student accommodation alongside other uses, making it less viable.
However, Brisbane City Council has been pro-active in its approach
to student accommodation with the introduction of a temporary three
year reduction in Council’s adopted infrastructure charges for student
accommodation developments within a 4 kilometre radius of the
Brisbane GPO. Alongside this, Queensland Urban Utilities (QUU)
has introduced a new infrastructure charge category for water and
sewerage connections for developments of student accommodation.
As a result, the combined Council and QUU infrastructure charges bill approval quicker and more straightforward. A code assessable
for a one bedroom unit has been cut from about $18,000 to $4,560 – a development application fits within the codes of the City Plan and
saving of $13,440 per unit. can be assessed quickly by Council without the need for public
notification12. An impact assessable development application is for
In addition to this, the planning system in Brisbane can be viewed to development that must be assessed against all identified codes and
be more attractive to potential developers in comparison to Sydney or the City Plan as a whole. This is to ensure that identified development
Melbourne as it operates a system of assessments for development impacts are addressed. These applications must be publicly notified to
applications which can make the process of gaining development take into account the community’s views.
11 http://www.illawarramercury.com.au/story/2714031/private-investors-to-fund-uow-student-housing/
12 http://eplan.brisbane.qld.gov.au/?doc=HostelCode
Australian Student Accommodation Market Update 2015 | 17As the sector matures in Australia we expect to see transaction Table 17: Yield Summary - UK
volumes increase, however this could be several years away. In the Forecast
Direct Let
UK there have been over £3.8 billion of transactions in 2015 including: Hardening
Current
• Pure Portfolio - 2,170 rooms across five prime central London sites. Forecast 6.75%+
Forecast Stable
Sold March 2015 for ₤530 million. Net Initial Yield circa 4.6%. Stable
Forecast Current Other
• Liberty Living Portfolio – 16,700 bedrooms across 40 properties. Forecast Current 5.75% Regional
Stable
Sold March 2015 for ₤1.1 billion. Stable 5.50%
Current
Current 5.00% Prime
• Nido Portfolio – 2,521 bedrooms across three central London sites. 4.75% Prime Regional
Varsity
Sold May 2015 for ₤600 million. Round Hill Capital purchased the Other Regional
entity including the three assets for circa £415 million in 2012. Prime London
London
JLL research predicts that UK transactions may exceed £5 billion in
2015. This will be substantially higher than the average sales volumes
25 Year FRI Lease
of between £1.7 – 2.7 billion over the last three years as demonstrated Forecast
Stable
in the following chart (Figure 7). Forecast
Stable Current
Forecast 5.25%
Stable Current
Figure 7: UK Student Accommodation Transaction Volumes 2011 - Forecast 5.00%
Stable Current
2015 Other
Forecast 4.75% Regional
Hardening Current
4.50% Prime
Billion (£) Current Regional
Prime
5.5 5.2 4.25% Varsity
5.0 Other Regional
London
Prime
4.5 London
4.0
3.5 Source: JLL Research 2015 - Note: Referenced against appropriate cash
flows and applies to single ‘best in class’ assets.
3.0 2.7
2.5
2
2.0 1.7 Table 18: Yield Summary - Australia
1.5
1
1.0 Direct Let
Prime
0.5 7.75% - 8.25%
0 Prime
2011 2012 2013 2014 2015 Other Major
Prime Prime 7.25% - 7.75% Metropolitan
Completed Projected 7.00% - 7.50% 7.00% - 7.50% Areas
Brisbane
Source: JLL Research 2015.
Sydney Melbourne
Strong recent transaction volumes have driven down yields for UK
student accommodation for single assets and at a premium for
portfolios. We provide below an indication of current and forecast net Secondary
initial yields for UK student accommodation assets on a Direct-Let 8.50% - 9.50%
basis and assuming a 25 year full repairing and insuring (FRI) lease Secondary Other Major
(equivalent of Australian triple net lease) (Table 17). 8.00% - 9.00% Metropolitan
Secondary Secondary Areas
Whilst there have been limited transactions in Australia, we provide 7.50% - 8.50% 7.50% - 8.50% Brisbane
below an indication of our opinion of the net initial yields which could
be achievable in prime and secondary locations within Sydney, Sydney Melbourne
Melbourne, Brisbane and Other Major Metropolitan Areas (Table 18).
Source: JLL Research 2015 - Note: Referenced against appropriate cash
flows and applies to single ‘best in class’ assets.
18 | JLLOutlook
Without change in macro drivers, in the short to medium term new Over the next 12 months student accommodation will continue to
student accommodation development will remain challenging in attract increased levels of interest. JLL anticipates:
major Australian metropolitan areas. However, given the structural
undersupply of good quality accommodation across many locations in • At least one more new significant developer / operator will enter the
Australia further development of new high quality accommodation is a sector in 2015.
necessity to support the aspirations of universities and stakeholders in • The volume of studios entering the Sydney market may impact on
promoting Australian Higher Education in the global market. rents and occupancy levels for this type of accommodation.
As the competition for international students intensifies, the cities that • The pipeline of new properties across major metropolitan areas will
Australia is competing with are increasing the supply and improving increase as the development market reacts to the existing shortfall
the quality of accommodation offered. A key challenge for the in provision and investment opportunities.
Australian market is the issue of affordability and the introduction of • Alternative use values will remain as a barrier to entry, with the
design trends such as smaller studios and twin rooms in looking to Sydney and Melbourne markets being the most difficult to access.
address this.
• A number of universities are looking at options to develop new
residences and may enter the market in 2015.
Noral Wild
National Director
Head of Social Infrastructure – Australia
noral.wild@ap.jll.com
+61 3 9672 6522
Australian Student Accommodation Market Update 2015 | 19JLL office
Adelaide Glen Waverley Parramatta
Level 22, Grenfell Centre Building 2 Level 8, 79 George Street
25 Grenfell Street 540 Springvale Road Parramatta NSW 2150
Adelaide SA 5000 Glen Waverley VIC 3150 tel +61 2 9806 2800
tel +61 8 8233 8888 tel +61 3 9565 6666
Perth
Brisbane Mascot Level 29, Central Park
Level 33, Central Plaza One Level 3, Sydney Airport Centre 152-158 St Georges Terrace
345 Queen Street 15 Bourke Road Perth WA 6000
Brisbane QLD 4000 Mascot, NSW, 2020 tel +61 8 9322 5111
tel +61 7 3231 1311 tel +61 2 9693 9800
Sydney
Canberra Melbourne Level 25, 420 George Street
Level 7, 121 Marcus Clarke Street Level 21, Bourke Place Sydney NSW 2000
Canberra, ACT, 2601 600 Bourke Street tel +61 2 9220 8500
tel +61 2 6274 9888 Melbourne VIC 3000
tel +61 3 9672 6666
Gold Coast
Level 5C North Sydney
64 Marine Parade Level 33, North Point
Southport QLD 4215 100 Miller Street
tel +61 7 5558 6400 North Sydney NSW 2060
tel +61 2 9936 5888
Follow us
www.jll.com.au
Jones Lang LaSalle
© 2015 Jones Lang LaSalle IP, Inc. All rights reserved. All information contained herein is from sources deemed reliable; however, no representation or warranty is made to the accuracy thereof.You can also read