The performance of Koi (Cyprinus carpio L.) in a circular current container tested against the Aeromonas hydrophila bacteria
←
→
Page content transcription
If your browser does not render page correctly, please read the page content below
Available online at www.worldscientificnews.com

WSN 159 (2021) 1-19 EISSN 2392-2192

 The performance of Koi (Cyprinus carpio L.) in
 a circular current container tested against
 the Aeromonas hydrophila bacteria

 Ibnu Bangkit Bioshina Suryadi1, Regan Hanifelian Yusa2,
 Grandiosa H. Roffi and Zahidah
 Fisheries Departement, Faculty of Fisheries and Marine Science, Universitas Padjadjaran,
 Bandung – Sumedang KM. 21, Jatinangor 45363, Indonesia
 1,2
 E-mail address: ibnu.bangkit@unpad.ac.id , hanifelianyregan@gmail.com

ABSTRACT
 This research aims to determine the best currents speed and utilization of venturi to increasing
survival, growth of Cyprinus carpio L. and reducing the infection rate of A. hydrophila bacteria.
fingerlings. This research used an experimental method completely randomized design (CRD) with four
treatments and four replications. The treatments used were the use of currents and venturi on the
maintenance media with currents velocities of 0 m/s (A), 0.06 m/s (B), 0.1 m/s (C), and 0.14 m/s (D).
Maintenance of the test fish for 40 days then followed by a challenge test for 14 days. Koi fish fingerlings
tested to use A. hydrophila with a density of 108 CF /ml. The parameters observed included white blood
cells, red blood cells, clinical symptoms, survival, daily growth rate, feed conversion ratio and water
quality. The results showed that the use of currents and venturi with a flow rate of 0.14 m/s was effective
in improving the performance of the koi fish's immune system and reducing the infection rate of A.
hydrophila bacteria. During the flow administration during the 40 days maintenance period, the white
blood cell count increased by 20.51% from a value of 9.19 × 10⁴ cells/mm3 to 11.56 × 10⁴ cells/mm3.
Red blood cells increased by 40.65% from 1.60 × 10⁶ cells/mm3 to 2.69 × 10⁶ cells/mm3. Currents
treatment with a speed of 0.14 m/s produced the highest survival rate after challenged with a value of
86.7%. Also this treatment was effective in preventing infection of A. hydrophila bacteria, it can be seen
from the macroscopic clinical symptoms that appear less than the treatment current. The best results of
daily growth rate and feed conversion ratio provided in currents treatment with a speed 0.1 m/s.

 ( Received 04 June 2021; Accepted 26 June 2021; Date of Publication 27 June 2021 )
World Scientific News 159 (2021) 1-19

Keywords: Aeromonas hydrophila, Koi Fish Fingerlings, System Immune, Round Container, Currents,
Ventury System, Cyprinus carpio

1. INTRODUCTION

 Koi fish (Cyprinus carpio L) is one of the ornamental fish that is in great demand by both
hobbyists and cultivators considering that koi fish have a beautiful body shape, fins and
attractive color combination patterns, and are also believed to bring good luck by koi hobbyists
in Indonesia. Based on data from the Director General of Aquaculture, Ministry of Marine
Affairs and Fisheries (KPP), one of the ornamental fish commodities that increased in
production in 2015-2018 was koi fish with a significant production amount of 8.9%.
 Fish disease is an important thing and is one of the serious obstacles in aquaculture
production. Losses caused by disease in fish farming include: decreased production, quality,
efficiency, and competitiveness. One of the disease attacks is caused by A. hydrophila bacteria
which can cause Motile Aeromonas Septicemia (MAS) disease in freshwater fish [1]. A.
hydrophila bacteria could greatly affected the freshwater fish farming and caused disease
outbreaks with high mortality rate (80 - 100%) [2].
 A. hydrophila infects fish begins with the attachment of bacteria through the body surface
or injured gills and then enters the blood vessels and other internal organs [3]. Efforts to prevent
and overcome the attack of A. hydrophila bacteria in freshwater fish farming activities are
usually carried out by cultivators by using antibiotics. However, the use of antibiotics to control
various bacterial infections is not effective enough, because the use of antibiotics on a large
scale is not only economical but also causes an increase in types of pathogenic bacteria that are
resistant to antibiotics and can pollute the environment [4].
 Alternative efforts are needed to prevent the attack of A. hydrophila bacteria in freshwater
fish farming activities. Prevention can be done by using currents in the rearing media, so that
the current in the rearing media is expected to increase fish resistance from disease and cause
pathogenic bacteria to not stick to fish so that it can reduce the level of pathogenic bacterial
infection in fish and maintain water quality.

2. MATERIALS AND METODS

 The research was conducted at the Aquaculture Laboratory Building 4th Faculty of
Fisheries and Marine Sciences, Universitas Padjadjaran. The equipment used consists of 16
gallons with diameter of 26 cm × 48 cm height × 19 L volume, 16 buckets, water pumps, PVC
pipes of ½ inch and ¾ inch sizes, tap sizes of ½ inch, DO meters, thermometers, pH meters,
ammonia test kits, digital scales, scoop net and fiber tubs.
 The material used consisted of 5-7 cm koi fish fingerlings from Ciparanje Fish Farm
Universitas Padjadjaran, commercial feed with a protein content of 31-33%, dacron and A.
hydrophila bacteria. The research method was conducted experimentally using the Completely
Randomized Design (CRD) method which consisted of four treatments with four replications
with different currents velocities on a round container with a venturi aeration system. The
following treatments were given:

 -2-

World Scientific News 159 (2021) 1-19

 1) Treatment A : without currents but with venturi (0 m/s)
 2) Treatment B : currents speed (0,06 m/s) with venturi
 3) Treatment C : currents speed (0,1 m/s) with venturi
 4) Treatment D : currents speed (0,14 m/s) with venturi

2. 1. Container Design

 Figure 1. Container Design

 -3-
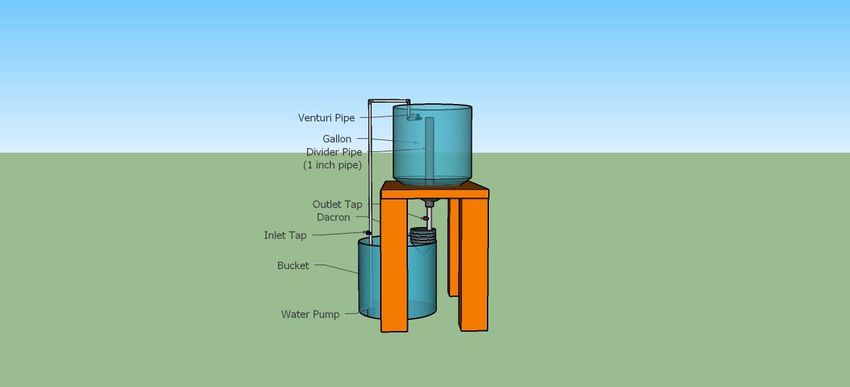
World Scientific News 159 (2021) 1-19

 In this research, the circular container used as the rearing medium was designed to
produce a constant flow and easier expulsion of feed residues and metabolic wastes through the
smaller diameter gallon tip. In the middle of the gallon there is a pipe that functions as a water
level regulator. The flow of water is generated through a pump placed in a bucket, then a pipe
is installed in the container to create a water inlet from the bucket to the gallon and at the end
of the inlet pipe a ventury is installed as an oxygen supply and flow generator. The design of
the maintenance container is shown in (Figure 1).
 The water in the rearing tank was given a speed according to the treatment using a venturi
aeration system. The water used is a recirculation system, where the water that comes out of
the rearing container will enter the bucket as a filtration container that has been given dacron
as a physical filter to filter feed residue and metabolic waste Then the dirt will settle while the
water in the bucket will be pumped up through the pipe and connected to the venturi aeration
system, it will produce a current with the venturi aeration system on the maintenance media.
Siphon and water measurements are carried out every ten days to maintain water quality.

2. 2. Main Research
 The maintenance of the test fish was carried out for 40 days then followed by a challenge
test for 14 days using gallons as a round container. Stocking density in each container
containing 15 koi fish fingerlings with 15 L water each round container. The amount of feed
given is adjusted to the feeding rate (FR) of 5% of fish biomass and adjusted to its growth once
every ten days.

2. 3. Observation Parameters
 a. Macroscopic Clinical Symptoms
 Observations of clinical symptoms were carried out for two weeks, starting one day (24
hours) after the challenge test with A. hydrophila bacteria. Clinical symptoms observed include
clinical sign and behavioral changes. The clinical sign observed included bleeding
(hemorrhagic) on the body surface, protruding eyes (exopthalmia), bulge belly (dropsy),
peeling scales and fin rot. Behavioral changes observed included response to feed, swimming
motion and shock.

 b. White Blood Cell (Leukocyte) Count
 The leukocyte count was observed before starting the main study and after the challenge
test with A. hydrophila bacteria. The formula for calculating white blood cells (SDP)

 ∑SDP (1 ml of blood) = Total Mean SDP × 3.200 (Multiplication Factor)

 c. Red Blood Cell (Erythrocyte) Count
 Observations of the number of erythrocytes were carried out before starting the main
study and after the challenge test with A. hydrophila bacteria. The formula for calculating red
blood cells (HR):

 ∑SDM (1 ml of blood) = Total Mean SDM × 50.000 (Multiplication Factor)

 -4-
World Scientific News 159 (2021) 1-19

 d. Survival Rate (SR)

 Survival is known by percentage of the final number of fish to the initial number at
stocking. The data needed is the number of fish at the beginning and at the end of the fish
rearing process. Calculations are done manually used formula:
Note:

 = × 100%

SR = Survival Rate (%)
Nt = Number of fish at the end of the research
No = Number of fish at the beginning of the research

 e. Daily Growth Rate (DGR)
 To measure the daily growth rate the following formula is used:

 ( − )
 = × 100%

Note:
DGT = Daily growth rate (%)
Wt = Average weight at the end of the research (g)
Wo = Average weight at the start of the research (g)
t = Duration of observation (Day)

 f. Feed Conversion Ratio (FCR)

 Feed conversion is calculated by the formula:

 = × 100%
 ( + ) −

Note:
FCR = Feed Conversion Ratio
Wo = Average weight at the start of the research (g)
Wt = Average weight at the end of the research (g)
D = Weight of dead fish during treatment (g)
F = Amount of feed given (g)

 g. Water Quality
 Observation of water quality in koi fish rearing media includes measurement of
temperature, pH, ammonia (NH3), and dissolved oxygen (DO). This measurement is carried out
every ten days during the maintenance period.

 -5-
World Scientific News 159 (2021) 1-19

2. 4. Data Analysis

 Data analysis used the F test at a 95% confidence interval to determine whether the
treatment significantly affected white blood cell counts, red blood cell counts, daily growth rate,
feed conversion ratio and survival were analyzed using ANOVA and followed by Duncan’s
Multiple Range Test. Dzata on clinical symptoms and water quality were analyzed
descriptively.

3. RESULT
3. 1. Growth
- Daily Growth Rate (DGR)
 Growth is a change in fish size, both weight and length in a certain period. One way to
determine the growth of fish is to calculate the daily growth rate of fish. The daily growth rate
is used to determine the percentage growth of fish weight per day during a certain maintenance
time. The average daily growth rate of koi fish can be seen in (Figure 2).

 1,20
 Average Daily Growth Rate (gr)

 1,00

 0,80

 0,60

 0,40

 0,20

 0,00
 A (Without B (0,06 m/s) C (0,1 m/s) D (0,14 m/s)
 Currents)
 Treatment

 Figure 2. Koi Fish Daily Growth Rate Chart

 Based on Figure 2, it can be seen that the daily growth rate of koi fish was highest in
treatment C with an average daily growth rate of 1.11%, followed by treatment B of 1.06%,
then treatment D of 1.0% and the rate of The lowest daily growth was in treatment A with a
value of 0.9%. Based on the results of the analysis of variance, the results were not significantly
different (P > 0.05) in the daily growth rate of koi fish. The daily growth rate is different in
each treatment, this is because the growth of koi fish is strongly influenced by heredity, health,

 -6-
World Scientific News 159 (2021) 1-19

feed, living space and age. Selection or selection of broodstock plays a major role in supporting
the success of koi fish maintenance
 However, it can be seen that the growth in the treatment that was given current on the
maintenance medium was higher than the treatment that was not given current (control). This
is because the provision of currents can help the growth rate of fish become faster and increase
fish appetite. [5], stated that the flow of water will provide a stimulus to the fish to keep moving.
Fish that are actively moving will experience faster muscle development than fish that are more
silent, so that the movement of active fish can spur the development of fish weight that is getting
faster. The maintenance of Majalaya carp using 0.1 m/s current and venturi produces the highest
daily growth rate and can increase the dissolved oxygen concentration in the rearing container
[6].
 In addition, the presence of a current that is too large also makes the fish continue to move
and causes the level of feed consumption that is not utilized effectively and optimally by the
fish, so that the feed given cannot be used by fish for growth but is used as energy to move.

- Feed Conversion Ratio (FCR)
 Based on the results of the 40-day study conducted, the average feed conversion value for
each treatment can be seen in (Figure 3).

 4
 Feed Conversion Ratio (FCR)

 3,5
 3
 2,5
 2
 1,5
 1
 0,5
 0
 A (Without B (0,06 m/s) C (0,1 m/s) D (0,14 m/s)
 Currents)
 Treatment

 Figure 3. Feed Conversion Ratio Chart

 Based on the results of the calculation of the FCR value on koi fish seeds, the highest
FCR value was found in treatment A (Control), which was 3.52 gr. While the lowest FCR value
in treatment C is 2.75 gr. FCR is the ratio between the amount of feed given to the amount of
weight produced. So that the best FCR value is found in treatment C, where by feeding as much
as 2.75 g can produce 1 g of fish weight. Feed Conversion Ratio (FCR) is a measure that states
the ratio of the amount of feed needed to produce 1 kg of fish weight. The smaller the feed

 -7-
World Scientific News 159 (2021) 1-19

conversion value, the better the efficiency of feed utilization. Conversely, if the feed conversion
is large, the efficiency level of feed utilization is not good [7].
 The results of the analysis of variance showed that the current applied to the maintenance
medium had no significant effect on the FCR value. Feed plays an important role in the
development of koi fish. Good feed has a complete nutritional composition and is good for the
absorption of proteins such as fats, carbohydrates, minerals and vitamins, hormones also delays
the catabolism of amino acids and stimulates growth in koi fish body proteins. [8].
 Factors that influence the amount of consumption in fish are feeding habits, physiological
status, fish weight, temperature, oxygen concentration, feed composition and level of
preference [6]. This study showed that there was a change in feeding habits that occurred in the
rearing medium that was fed with currents resulting in a lower FCR ratio in treatment C. Current
feeding on the rearing media could supply feed evenly so that the spread of feed was not
collected at one point so there was no competition between fish.

3. 2. Immune System
- White Blood Cells (Leukocytes)
 The results of observations on the number of leukocytes showed that there were various
values, it can be seen from (Figure 4) which shows that there are differences in the number of
white blood cells from each treatment. The average number of leukocytes observed by test fish
before current and venturi treatment was 9.19 × 10⁴ cells/mm3. After the current and venturi
treatment, the mean leukocytes increased in the range of 10.16–11.56 × 10⁴ cells/mm3. The
number of leukocytes during the research was still in normal conditions, this is in accordance
with the statement of [9] that the number of leukocytes in fish ranges from 20,000-150,000
cells/mm3 of blood. The results of the research [10] showed the average normal leukocyte value
of koi fish was 69.95 × 10⁴ cells/mm3.

 18,00

 16,00
 Total SDP ( x 104 ) sel/ mm3

 14,00

 12,00
 A (Without Currents)
 10,00
 B (0,06 m/s)
 8,00
 C (0,1 m/s)
 6,00
 D (0,14 m/s)
 4,00

 2,00

 0,00
 Without Currents UT-3 UT-7 UT-10 UT-14
 Currents
 Calculation Time

 Figure 4. White Blood Cells (Leukocytes)

 -8-
World Scientific News 159 (2021) 1-19

 Note :
Without Current : Before Current treatment UT-7 : 7th day after challenge
Current : After 40 days Flow treatment UT-10 : 10th day after challenge
UT-3 : 3rd day after challenge test UT-14 : 14th day after challenge

 Based on the analysis of variance after current treatment, it was shown that treatments C
and D were significantly different from treatment A, while treatment B was not significantly
different (Figure 7). Treatment D experienced the highest increase in leukocytes with an
increase of 20.51% from the value of 9.19 × 10⁴ cells/mm3 to 11.56 × 10⁴ cells/mm3, this was
because the koi fish seeds were more active in swimming continuously due to the influence of
current 0.14 m/s. However, treatment D was not significantly different from treatment [11] said
Atlantic salmon that actively swim showed higher survival and increased disease resistance.
 Based on the analysis of variance on the 3rd day after the challenge test (UT-3) showed
that treatments C and D were significantly different from treatments A and B, on day 7 (UT-7)
showed that treatment A was significantly different from treatments C and D ( Figure 4). This
indicates that there are other factors that can increase the number of leukocytes. The highest
change in the increase in leukocytes was found in treatment A (without current) which increased
by 42.63% with an average leukocyte count of 17.70 × 10⁴ cells/mm3, while the lowest increase
was in treatment D (0.14 m/s) of 24.74% with an average leukocyte count of 15.36 × 10⁴
cells/mm3. The highest value change was found in treatment A, indicating that the number of
leukocytes was not sufficient to fight bacterial attack, so it was necessary to produce a large
number of leukocytes as a body defense. According to [12] the average number of fish
leukocytes increases with the increase in pathogenic bacterial infection.
 The number of leukocytes on day 10 (UT-10) and day 14 (UT-14) decreased. Treatment
A showed the highest number of leukocytes compared to other treatments, it showed that the
koi fish seeds after the test of A. hydrophila bacteria still needed large amounts of leukocytes.
Treatments C and D showed lower leukocyte counts, this indicated that bacterial attack had
begun to decrease and the test fish had begun to be resistant to attack by A. hydrophila bacteria.
[13] stated that leukocytes are one of the components of blood cells that function as non-specific
defenses that will localize and eliminate pathogens.

- Red Blood Cells (Erythrocytes)
 Observation of the number of red blood cells (erythrocytes) of koi fish was carried out to
determine any changes in the number of koi fish erythrocytes after being given current and
venturi treatment on maintenance media and after infection with A. hydrophila. The results of
observations of changes in erythrocyte values can be seen in (Figure 5).
 Based on analysis of variance, it was shown that the number of erythrocytes after
administration of current and venturi during maintenance in treatments B, C and D was
significantly different from treatment A which did not use current (Figure 5). The highest
average number after current and venturi treatment was found in treatment D of 2.69 × 10 6
cells/mm3 and the lowest was in treatment A of 1.96 × 10⁶ cells/mm3. Treatment D experienced
the highest increase of 40.65% from 1.60 × 10⁶ cells/mm3 to 2.69 × 10⁶ cells/mm3, this could
be due to the effect of current administration on optimal maintenance media and the increase in
fish age growth. The number of erythrocytes in fish is influenced by nutritional conditions,
physical activity, and age.

 -9-
World Scientific News 159 (2021) 1-19

 3,00
 Total SDM ( x 106 ) sel/ mm3

 2,50

 2,00
 A (Without
 Currents)
 1,50 B (0,06 m/s)

 C (0,1 m/s)
 1,00
 D (0,14 m/s)
 0,50

 0,00
 Without Currents UT-3 UT-7 UT-10 UT-14
 Currents
 Calculation Time

 Figure 5. Red Blood Cell (Erythrocyte)

 Note :
Without Current : Before Current treatment UT-7 : 7th day after challenge
Current : After 40 days Flow treatment UT-10 : 10th day after challenge
UT-3 : 3rd day after challenge test UT-14 : 14th day after challenge

 After the challenge test the average erythrocyte in all treatments showed a decrease in the
number of erythrocytes, this could occur because bacterial attack resulted in rupture of fish
blood vessels, resulting in a decrease in total erythrocytes. Based on the results of the analysis
of variance after the challenge test on day 3 (UT-3) showed that treatments C and D were
significantly different from treatments A and B, on day 7 (UT-7) showed that treatment D was
significantly different from treatment A, B and C. The average number of erythrocytes after the
challenge test decreased on day 3 (UT-3) and day 7 (UT-7), this was due to the presence of A.
hydrophila bacteria. Treatment A (without current) had the highest percentage of decrease in
value of 71.12% with an average erythrocyte count of 1.14 × 10⁶ cells/mm3, while the lowest
percentage of decrease was indicated by treatment D (current 0.14 m/s). that is equal to 45.74%
with an average erythrocyte 1.85 × 10⁶ cells/mm3. Treatment D showed the lowest decreasing
value, it indicated that current administration could affect the fish's body resistance.
 The number of erythrocytes in all treatments showed that the 10th day (UT-10) and 14th
day (UT-14) had increased again. Treatments C and D showed the highest average value, this
shows that koi fish seeds already have a body resistance that is starting to recover and the body
begins to produce more erythrocytes to replace erythrocyte cells that have been lysed by the
enzyme hemolysin A. hydrophila. The results of this research indicate that the highest number

 -10-
World Scientific News 159 (2021) 1-19

of erythrocytes during the recovery period is treatment D, this indicates that the treatment with
a current velocity of 0.14 m/s is the optimal speed to increase the immune response of koi fish.

3. 3. Macroscopic Clinical Symptoms
 Observation of macroscopic clinical symptoms of koi fish seeds was observed after a
challenge test with A. hydrophila bacteria was carried out. Bacterial infection was carried out
using the immersion method with a density of 108 cfu/ml as much as 30 ml on the maintenance
medium.

- Clinical Symptoms

 Figure 6. Clinical Symptoms of Koi Fish Infected with A. hydrophila

 The results of the observation of clinical symptoms of fish for 24 hours after the challenge
test were inflammation characterized by bleeding (hemorrhagic) at the base of the tail (Figure
6b), protruding eyes (exopthalmia) (Figure 6c) and fin rot (Figure 6d). Fish infected with A.

 -11-
World Scientific News 159 (2021) 1-19

 hydrophila using the immersion method showed clinical symptoms in the form of hemorraghic
 and fin rot [14]. These symptoms began to be observed on the body surface at 15 hours after
 the challenge test. Treatments A and B showed clinical symptoms that first appeared and then
 followed by treatment C, while in treatment D clinical symptoms were not visible at 24 hours
 after the challenge test. The incubation period of MAS-associated infections varies between 2-
 4 days in natural infections and 8- 48 hours in experimental infection models [15]. The results
 of the observation of changes in clinical symptoms of fish after the challenge test appeared to
 be the same in all treatments as shown in (Table 1).

 Table 1. Clinical Symptoms of Koi Fish after A. hydrophila Bacterial Infection.

 Clinical Symptoms

 Days to-
Treatments Replications
 1 2 3 4 5 6 7 8 9 10 11 12 13 14

 1 af af acf acf acf cf cf f - - - - - -

 2 - af abef abdef abdef abdef abdef bdf bdf bdf bdf bd bd bd
 A
 3 - - acf acf cf cf cf cf cf cf - - - -

 4 abf abf abf abf abf bf bf b b b b b b b

 1 - - f f f f - - - - - - - -

 2 af af af af af f f f f - - - - -
 B
 3 ef ef bcde bcdef cdef cdef cdef def def def def def def def

 4 - f f cf cf cf cf cf cf cf - - - -

 1 a a af abf abf abf bf f - - - - - -

 2 - - - f f - - - - - - - -
 C
 3 - - f bf bf bf bf - - - - - - -

 4 - - f f f f - - - - - - - -

 1 - af af af af - - - - - - - - -

 2 - - f bf bf bf bf - - - - - - -
 D
 3 - - f f f - - - - - - - - -

 4 - - - f f - - - - - - - - -

 Note: (a) Bleeding (Hemorrhagic), (b) Protruding Eyes (Exopthalmia), (c) Bulge Belly
 (Dropsy), (d) Peeling Scales, (e) Fin Rot, (f) Decreased Swimming

 -12-
World Scientific News 159 (2021) 1-19

 Other clinical symptoms in the form of peeling scales (Figure 6e) and a bulge belly
 (dropsy) (Figure 6f) began to appear on the 3rd day. The abdomen is enlarged due to fluid
 accumulation, the gills of the fish look solid due to excessive mucus fluid, the genitals of the
 fish swell and sometimes there are ulcers, another part that indicates infection is the red mouth
 [16]. The results of observations of clinical symptoms that appear in the test fish can be seen in
 (Figure 6).
 Treatments A and B showed more severe clinical symptoms than treatments C and D.
 Treatment D (0.14 m/s) showed better body resistance than other treatments, it could be seen
 from the clinical symptoms that were not too severe with the fish recovery period fastest. The
 recovery can be seen from the bleeding that started to disappear on the body surface on day 5
 (Table 1). The difference in the level of infection in treatment A is thought to be due to the
 absence of current in the rearing media so that A. hydrophila bacteria can attach and infect fish
 easily [17]. That each individual has a different resistance, this is determined by age, gender,
 nutritional status, and stress.

 - Response to Shock
 The fish response test to shock was carried out by tapping the walls of the rearing
 container for each treatment. The results of post-challenge observations showed various
 responses to each treatment (Table 2).

 Table 2. Shock Response Test of Koi Fish Fingerlings

 Response to Shock

 Days to-
Treatments Replications
 1 2 3 4 5 6 7 8 9 10 11 12 13 14

 1 +++ ++ ++ + + + ++ ++ ++ ++ +++ +++ +++ +++

 2 ++ ++ + + + ++ ++ ++ ++ ++ +++ +++ +++ +++
 A
 3 +++ +++ ++ + ++ ++ +++ +++ +++ +++ +++ +++ +++ +++

 4 ++ ++ + + + + + ++ ++ ++ +++ +++ +++ +++

 1 +++ +++ ++ + ++ ++ +++ +++ +++ +++ +++ +++ +++ +++

 2 +++ +++ ++ ++ + + ++ ++ ++ ++ +++ +++ +++ +++
 B
 3 ++ ++ ++ + + + ++ +++ +++ +++ +++ +++ +++ +++

 4 +++ ++ ++ + + ++ +++ +++ +++ +++ +++ +++ +++ +++

 1 +++ +++ ++ + + +++ +++ +++ +++ +++ +++ +++ +++ +++

 C 2 +++ +++ +++ ++ ++ +++ +++ +++ +++ +++ +++ +++ +++ +++

 3 +++ +++ ++ ++ + + ++ +++ +++ +++ +++ +++ +++ +++

 -13-
World Scientific News 159 (2021) 1-19

 4 +++ +++ ++ + + ++ +++ +++ +++ +++ +++ +++ +++ +++

 1 +++ +++ ++ ++ + +++ +++ +++ +++ +++ +++ +++ +++ +++

 2 +++ +++ ++ ++ + + +++ +++ +++ +++ +++ +++ +++ +++
 D
 3 +++ +++ +++ +++ ++ ++ +++ +++ +++ +++ +++ +++ +++ +++

 4 +++ +++ +++ + ++ +++ +++ +++ +++ +++ +++ +++ +++ +++

 Note: (+) Low response, (++) Medium response, (+++) High response

 Based on (Table 2), treatments C and D gave the best response to shock, it can be seen
 on the 1st and 2nd day after the challenge test of A. hydrophila, the koi fish response was still
 normal and seemed to decrease on the 3rd day up to -6, but the decrease in response was not
 too significant compared to other treatments. Treatments A and B showed a decrease in
 response on the 1st day to the 7th day, this could be due to bacterial attacks that caused the fish
 to get sick and a decrease in behavior in the form of fish that looked stressed which was
 characterized by swimming with a tilted body position and swimming at the bottom.
 According to [18] Unhealthy or diseased fish exhibit slow movement, some fish swim
 near the surface or in the vicinity of aeration and swim in a tilted body position due to reduced
 body balance and fin damage due to attack by A. hydrophila.

 - Response to Feed
 The results of observations on the response of feed that had been infected with A.
 hydrophila bacteria showed that there was a decrease in feed response in each treatment (Table
 3). The decrease in the response to eating fish decreases, due to a disturbed body metabolic
 process. According to [18] fish infected with A. hydrophila experienced a decrease in feed
 response because bacteria had infected the digestive tract through the blood vessels.

 Table 3. Response to Feed

 Response to Feed

 Days to-
Treatments Replications
 1 2 3 4 5 6 7 8 9 10 11 12 13 14

 1 +++ ++ ++ + + + + ++ ++ ++ +++ +++ ++ ++

 2 ++ ++ + + + + + + + + ++ ++ +++ ++
 A
 3 +++ ++ ++ + + + + ++ ++ ++ ++ ++ ++ +++

 4 ++ + + + + + + + + + ++ ++ + +

 B 1 +++ +++ ++ ++ ++ + + ++ ++ ++ ++ ++ ++ +++

 -14-
World Scientific News 159 (2021) 1-19

 Response to Feed

 Days to-
Treatments Replications
 1 2 3 4 5 6 7 8 9 10 11 12 13 14

 2 ++ ++ ++ + + + + + + + ++ ++ ++ ++

 3 ++ ++ ++ + + + + + ++ ++ ++ ++ ++ +++

 4 +++ ++ ++ + ++ ++ ++ ++ ++ + + ++ ++ ++

 1 +++ ++ ++ + + + + ++ ++ ++ ++ ++ ++ ++

 2 +++ +++ ++ + + ++ ++ ++ ++ ++ ++ ++ +++ +++
 C
 3 +++ +++ +++ ++ + + + ++ ++ ++ ++ ++ ++ ++

 4 +++ ++ ++ + + ++ ++ ++ ++ ++ ++ +++ +++ +++

 1 +++ ++ ++ + + ++ ++ ++ ++ +++ +++ +++ +++ +++

 2 +++ +++ +++ ++ + + + ++ ++ ++ ++ ++ +++ +++
 D
 3 +++ +++ ++ ++ ++ ++ ++ ++ ++ ++ ++ +++ +++ +++

 4 +++ +++ +++ + + ++ ++ ++ ++ ++ +++ +++ +++ +++
 Note : (+) Low response to feed, (++) Medium response to feed, (+++) High response to feed

 Treatment D (0.14 m/s) showed the best feed response, this was indicated by a normal
 feed response to fish on the 1st and 2nd days and then decreased response on the 3rd to 7th day.
 In treatment C, the feed response was seen to decrease on the 2nd day to the 7th day. While in
 treatments A and B a decrease in feed response was seen on the first day until the 11th day,
 then in treatment A there was a decrease in response again on the 13th day until the last day of
 observation, it can be seen from the amount of leftover feed that was not eaten.

 3. 4. Survival Rate (SR)
 Observation of the survival of koi fish fry was carried out before and after infection with
 A. hydrophila bacteria during maintenance. The percentage of survival can be seen in (Figure
 7).
 Based on the results of the analysis of variance, it showed that the survival before the
 challenge test in each treatment was not significantly different. Treatment B showed the lowest
 survival among all other treatments. Treatment C showed the highest survival rate compared to
 other treatments with a survival rate of 98%. This shows that the provision of current to the
 maintenance medium can improve survival, because with the presence of currents and venturi
 in the recirculation system, it can maintain good water quality. The presence of water flow in
 the koi fish rearing media in the RAS system can affect the efficiency of the system in removing

 -15-
World Scientific News 159 (2021) 1-19

nutrients and maintaining water quality parameters [19]. Disease incidence can occur due to
high fish density during maintenance, handling, and poor water quality [20].
 Based on the analysis of survival variance after the challenge of A. hydrophila bacteria,
there were significant differences between treatments. Observations showed that treatments C
and D were significantly different from treatments A and B (Figure 7). Treatment D showed
the highest survival compared to other treatments, which means a current velocity of 0.14 m/s
can reduce the level of A. hydrophila infection and increase survival in koi fish seeds, this is
also indicated by fewer macroscopic clinical symptoms compared to treatment other [21-24].

 100%
 90%
 Percentage of Survival (%)

 80%
 70%
 60%
 50%
 Before the Challenge
 40%
 30% After the Challenge
 20%
 10%
 0%
 A (Without B (0,06 m/s) C (0,1 m/s) D (0,14 m/s)
 Currents)
 Treatment

 Figure 7. Survival Rate

3.5. Water Quality

 Water quality measurements include measurements of temperature, pH, ammonia, and
dissolved oxygen (DO) levels which were carried out during the maintenance period until the
challenge test. Water quality data during the maintenance period can be seen in (Table 4).

 Table 4. Value of Water Quality Range

 Water Quality Parameters
 Treatment
 Temperature (oC) pH DO (mg/l) Ammonia (mg/l)

 A 23,8-26,6 6,55-7,07 7,5-8,2 0,003-0,006
 B 24,2-27,1 6,68-7,07 8-8,2 0,003-0,006

 -16-
World Scientific News 159 (2021) 1-19

 Water Quality Parameters
 Treatment
 Temperature (oC) pH DO (mg/l) Ammonia (mg/l)

 C 23,6-26,9 6,7-7,08 8-8,4 0,003-0,006
 D 24-26,8 6,73-7,09 8-8,3 0,003-0,006
 Optimal (SNI 6,5-8,5
 18-30 (SNI) >4 (SNI)
World Scientific News 159 (2021) 1-19

[5] V. Castro et al., Aerobic training stimulates growth and promotes disease resistance in
 Atlantic salmon (Salmo salar). Comp. Biochem. Physiol. - A Mol. Integr. Physiol. vol.
 160, no. 2, pp. 278–290, 2011, doi: 10.1016/j.cbpa.2011.06.013
[6] Raden Ahmad Sholahudin Fauzi, Ayi Yustiati, Eddy Afrianto, Ibnu Bangkit, Growth
 and sustainability performance of common carp seed (Cyprinus carpio Linnaeus, 1758)
 in round water flowing container. World Scientific News 141 (2020) 132-144
[7] Ibnu Bangkit Bioshina Suryadi, M. Ihsan Fadylah, Iskandar, Ayi Yustiati, The
 Productivity of Using Current Generating Circular Tanks for Tilapia Fingerling
 (Oreochromis niloticus (Linnaeus, 1758)) Production. World News of Natural Sciences
 27 (2019) 85-95
[8] Handoyo, B. Alimuddin, and N. B. P. Utomo, Growth, Conversion and Retention of
 Feed, and Body Proximate of Eel Seed Given Recombinant Growth Hormone for
 Grouper Kertang through Immersion, Indones. J. Aquac. vol. 2, pp. 132–140, 2012
[9] R. Hartika, Mustahal, and and A. N. Son, Description of Tilapia (Oreochromis
 niloticus) blood with the addition of different doses of prebiotics in feed. J. Fish. Mar.
 Aff. vol. Vol 4. No., pp. 259–267, 2014
[10] U. Yanuhar, K. Susilowati, N. S. Junirahma, N. R. Caesar, and M. Musa, Blood cells as
 biomarkers of koi (Cyprinus carpio) infected by Myxobolus sp. with treatment of
 diflubenzuron in the water culture of quality, vol. 26, pp. 77–82, 2020
[11] V. Castro et al., Disease resistance is related to inherent swimming performance in
 Atlantic salmon. BMC Physiol. vol. 13, no. 1, 2013, doi: 10.1186/1472-6793-13-1
[12] A. A. Laith et al. Effect of Excoecaria agallocha on non-specific immune responses and
 disease resistance of Oreochromis niloticus against Streptococcus agalactiae. Res. Vet.
 Sci., vol. 112, no. April, pp. 192–200, 2017, doi: 10.1016/j.rvsc.2017.04.020
[13] R. Bhuvaneswari, N. Manickam, and P. Santhanam, Recovery of Cyprinus carpio
 (Ornamental Koi Carp) Experimentally Infected with Aeromonas hydrophila through
 Phytotherapy. J. Aquat. Res. Mar. Sci. vol. 1, no. 2, pp. 1–14, 2018
[14] M. U. Anyanwu, K. F. Chah, and S. Shoyinka, Evaluation of pathogenicity of motile
 Aeromonas species in African catfish. Int. J. Fish. Aquat. Stud. vol. 2(3), no. 3, pp. 93–
 98, 2015
[15] B. Yardimci and Y. Aydin, Pathological findings of experimental Aeromonas
 hydrophila infection in nile tilapia (Oreochromis niloticus). Ankara Univ. Vet. Fak.
 Derg. vol. 58, no. 1, pp. 47–54, 2011, doi: 10.1501/vetfak_0000002448
[16] A. El-Ashram, On Aeromonas hydrophila Infection Among Cultured Tilapias: a
 Biological, Histopathological and Management Study. Egypt. J. Aquat. Biol. Fish. vol.
 6(3), pp. 181–202, 2002, doi: https://doi.org/10.21608/ejabf.2002.1756
[17] A. Rey, N. Verjan, H. W. Ferguson, and C. Iregui, Pathogenesis of Aeromonas
 hydrophila Strain KJ99 Infection and Its Extracellular Product in Two Species of Fish.
 Vet. Rec., p. 164, pp.493–499, 2009
[18] U. Subhan, S. Mauladani, Rosidah, I. B. B. Suryadi, and I. Made Joni, Promising
 Application Of Fine Bubbles (Fbs) To Control Aeromonas hydrophila On Striped

 -18-
World Scientific News 159 (2021) 1-19

 Catfish Seed (Pangasianodon hypophthalmus). AIP Conf. Proc. vol. 2219, 2020, doi:
 10.1063/5.0003059
[19] K. K. T. Nuwansi et al. Effect of water flow rate on polyculture of koi carp (Cyprinus
 carpio var. koi) and goldfish (Carassius auratus) with water spinach (Ipomoea aquatica)
 in recirculating aquaponic system. Aquac. Int. vol. 24(1), pp. 385–393, 2016, doi:
 https://doi.org/10.1007/s10499-015-9932-5
[20] K. Thanikachalam, M. Kasi, and X. & Rathinam, Effect of garlic peel on growth,
 hematological parameters and disease resistance against Aeromonas hydrophila in
 African catfish Clarias gariepinus (Bloch) fingerlings. Asian Pac. J. Trop. Med. vol.
 3(8), pp. 614–618, 2010, doi: https://doi.org/10.1016/S1995-7645(10)60149-6
[21] Zulfahana Amatulloh, Yuniar Mulyani, Lantun Paradhita Dewanti, Kiki Haetami,
 Growth Characteristics and Tracing Antagonistic Properties of Bacillus flexus and
 Bacillus subtilis as Antibacterials to Overcome the Attack of Aeromonas hydrophila
 Bacteria on Fish. World Scientific News 158 (2021) 91-104
[22] Adrianti Nur Fitria Sofandi, Yuniar Mulyani, Emma Rochima, Rosidah, Growth
 characteristics and antagonistic potential of Bacillus cereus and Bacillus
 zhangzhouensis against pathogenic bacteria Aeromonas hydrophila in vitro. World
 Scientific News 158 (2021) 187-200
[23] Afifah Shabirah, Rosidah, Yuniar Mulyani, Walim Lili, Effect of Types Isolated Lactic
 Acid Bacteria on Hematocrit and Differential Leukocytes Fingerling Common Carp
 (Cyprinus carpio L.) Infected with Aeromonas hydrophila bacteria. World News of
 Natural Sciences 24 (2019) 22-35
[24] Auryn Ramadhany Geraldine, Rosidah, Heti Herawati, Ibnu Bangkit Bioshina, Isolation
 and Identification of Potential Pathogenic Bacteria in Living Carp (Cyprinus carpio
 Linnaeus, 1758) Sold in Supermarkets in Cimahi City, Java. World News of Natural
 Sciences 32 (2020) 21-
[25] BSN. SNI 7775-2013 Production of Koi Ornamental Fish (Cyprinus carpio). Natl.
 Stand. Agency, 2013.

 -19-
You can also read