Nitrate Leaching from Sand and Pumice Geomedia Amended with Pyrogenic Carbon Materials - MDPI
←
→
Page content transcription
If your browser does not render page correctly, please read the page content below
environments

Article
Nitrate Leaching from Sand and Pumice Geomedia
Amended with Pyrogenic Carbon Materials
Jihoon Kang 1, *    ID
                         , Marissa Davila 2 , Sergio Mireles 1 and Jungseok Ho 3
 1   School of Earth, Environmental and Marine Sciences, University of Texas Rio Grande Valley, Edinburg,
     TX 78539, USA; sergio.mireles01@utrgv.edu
 2   Harlingen Waterworks System, Harlingen, TX 78550, USA; mldavilaz13@gmail.com
 3   Civil Engineering, University of Texas Rio Grande Valley, Edinburg, TX 78539, USA; jungseok.ho@utrgv.edu
 *   Correspondence: jihoon.kang@utrgv.edu; Tel.: +1-956-665-3526

 Received: 1 September 2017; Accepted: 30 September 2017; Published: 3 October 2017

 Abstract: There is increasing interest in using pyrogenic carbon as an adsorbent for aqueous
 contaminants in stormwater. The objective of this study was to investigate pyrogenic carbon
 materials as an amendment to geomedia to reduce nitrate leaching. Batch adsorption and column
 experiments were conducted to evaluate the performance of a commercial activated carbon and two
 biochars incorporated (5% by weight) into sand and pumice columns. The batch adsorption with
 50 mg L−1 of nitrate solution showed that only activated carbon resulted in a substantial adsorption
 for nitrate up to 41%. Tested biochars were not effective in removing aqueous nitrate and even
 released nitrate (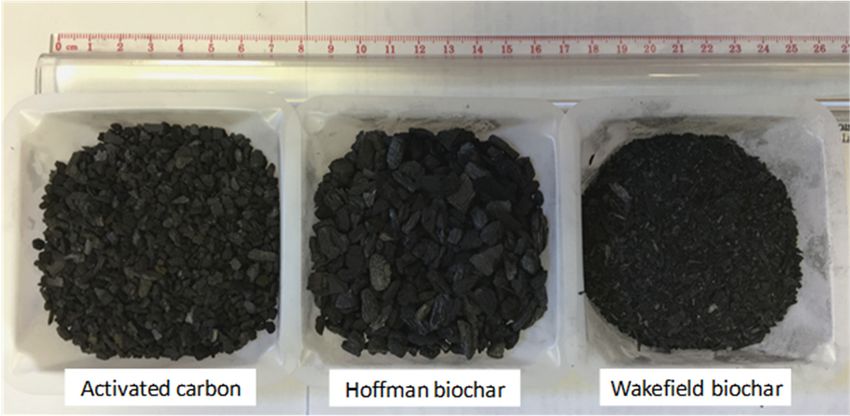
Environments 2017, 4, 70 2 of 7
Environments 2017, 4, 70 2 of 7
nutrients
(nutrient (nutrient
retention)retention) or even providing
or even providing nutrients tonutrients
plants withto plants with
increase in increase
microbialinactivity
microbial are activity
claimed
are claimed
to be to be the
the benefits benefits of commercially
of commercially available
available biochars soldbiochars
in USA.sold in USA.
There
Therehave
havebeen
beenincreasing
increasing adoptions
adoptionsof raingardens,
of raingardens, bioswales, and infiltration
bioswales, basinsbasins
and infiltration in urban in
landscapes, which which
urban landscapes, are designed to slow
are designed and and
to slow filterfilter
stormwater
stormwaterrunoff
runoffas as
a part
a partofoflow
low impact
impact
development
development(LID)(LID)practices
practices[11].
[11].For
Forexample,
example,the theLower
LowerRio RioGrande
GrandeValley
Valley(LRGV)
(LRGV)in inSouth
SouthTexas
Texas
has
has increasingly
increasingly adopted
adopted bioswale
bioswale systems
systemsandand more
more are are expected
expected to to be
be built
built in
in parking
parking lots
lots and
and
driveways
drivewaysas as aa green
green infrastructure
infrastructure projects
projects [12].
[12]. The
The objective
objectiveofof this
this study
study was
was to to investigate
investigate thethe
performance of pyrogenic carbon materials (AC and biochars) as an additive
performance of pyrogenic carbon materials (AC and biochars) as an additive to selected geomedia to selected geomedia
(sand
(sand and
and pumice)
pumice) forfor reducing
reducing nitrate
nitrate leaching.
leaching. Specific
Specific objectives
objectives were
were to
to (1)
(1) determine
determine nitrate
nitrate
adsorption
adsorption capacity
capacity ofof the
the carbon
carbon materials,
materials, and
and (2)
(2) evaluate
evaluate nitrate
nitrate retention
retention inin sand
sand andand pumice
pumice
columns
columns amended
amended with
with thethe carbon
carbon materials
materials (5%
(5% byby weight).
weight).
2. Materials
2. Materialsand
andMethods
Methods
2.1. Filter
2.1. FilterMedia
Mediaand
andPyrogenic
PyrogenicCarbon
Carbon Materials
Materials
Commerciallyavailable
Commercially availableplay
play sand
sand (Quikrete
(Quikrete International
InternationalInc.,
Inc., Atlanta,
Atlanta, GA,
GA, USA)
USA) and
and pumice
pumice
(Nature’sFootprint,
(Nature’s Footprint,Inc.,
Inc.,Bellingham,
Bellingham, WA,WA, USA)
USA) were
were used
used in this
in this studystudy as geomedia
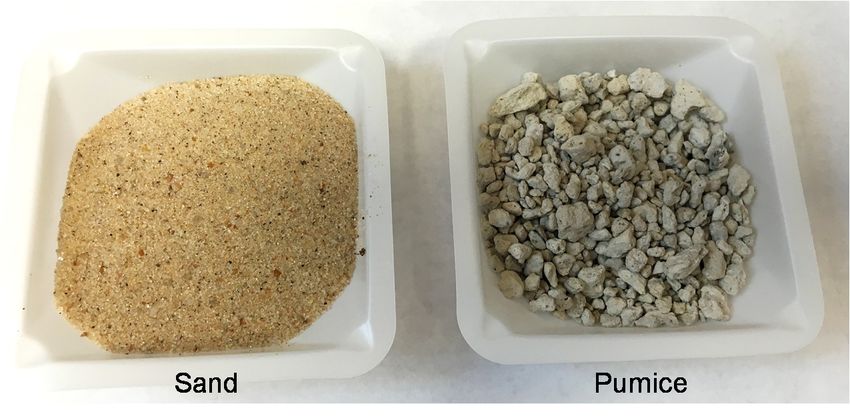
as geomedia (Figure
(Figure 1).
1). The
The play sand was determined to be fine sand having 97.5% sand, 1.8% silt, and
play sand was determined to be fine sand having 97.5% sand, 1.8% silt, and 0.7% clay according to 0.7% clay according
to the
the particle
particle sizesize analysis
analysis byby hydrometer
hydrometer method
method [13].The
[13]. Thepumice
pumicewas wasaafelsic
felsicvolcanic
volcanicrock
rock with
with
highly vesicular
highly vesicular rough
rough texture
texture andand itit isisoften
oftenfound
foundtotofloat
floaton
onthe
thebeaches
beachesofofthetheTexas coast
Texas coastdue to to
due its
low density (0.2 to 0.6 g cm −3 ) [14]. No textural analysis was performed with pumice as it contained
its low density (0.2 to 0.6 g cm ) [14]. No textural analysis was performed with pumice as it contained
−3
grain sizes
grain sizes coarser
coarser than
than 22 mm
mm in in diameter.
diameter. Both Both materials
materials were
were air-dried
air-dried before
before use.
use.
Figure
Figure1.1.Geomedia
Geomediatested
testedin
inthis
thisstudy.
study.
Three pyrogeniccarbon
Three pyrogenic carbonmaterials—a
materials—a commercial
commercial AC ACand and two biochar
two biochar products,
products, Hoffman Hoffman
biochar
biochar (HB) and Wakefield biochar (WB)—were used as amendments
(HB) and Wakefield biochar (WB)—were used as amendments to the sand or pumice geomedia to the sand or pumicein
geomedia in this study (Figure 2). The AC (CR610A, Carbon Resources LLC, Oceanside,
this study (Figure 2). The AC (CR610A, Carbon Resources LLC, Oceanside, CA, USA) was a granular CA, USA)
was a granular
product sold forproduct sold for water
water purification in purification
aquaculturein aquaculture
and and it was
it was produced fromproduced fromby
selected coal selected
a high
coal by a high temperature steam activation process according to the manufacturer.
temperature steam activation process according to the manufacturer. The HB (A.H. Hoffman The HB (A.H.
Inc.,
Hoffman Inc., Lancaster, NY, USA) was a pelletized charcoal product sold as a soil conditioner
Lancaster, NY, USA) was a pelletized charcoal product sold as a soil conditioner and it was claimed to and
itimprove
was claimed to improve
drainage drainage
and adsorb harmfuland adsorb harmful
impurities accordingimpurities according toThe
to the manufacturer. the WBmanufacturer.
(Wakefield
The WB (Wakefield Agricultural Carbon LLC, Columbia, MO, USA) was a USDA-certified soil
Agricultural Carbon LLC, Columbia, MO, USA) was a USDA-certified soil conditioner and it was
conditioner and it was mainly claimed to contribute to healthier soils and improve drought resistance
mainly claimed to contribute to healthier soils and improve drought resistance according to the
according to the manufacturer. The WB was not a pelletized product and it was much finer than other
manufacturer. The WB was not a pelletized product and it was much finer than other two carbon
two carbon products. All carbon materials were analyzed for pH (1:80 solid to solution ratio) using a
products. All carbon materials were analyzed for pH (1:80 solid to solution ratio) using a pH meter
pH meter (Extech Instruments, Waltham, MA, USA) and elemental composition via Energy-
(Extech Instruments, Waltham, MA, USA) and elemental composition via Energy-dispersive X-ray
dispersive X-ray spectroscopy equipped in ZEISS EVO LS10 Scanning Electron Microscope (Hitachi,
spectroscopy equipped in ZEISS EVO LS10 Scanning Electron Microscope (Hitachi, Japan). The results
Japan). The results for elemental composition were expressed in weight % (Table 1).
for elemental composition were expressed in weight % (Table 1).Environments 2017, 4, 70 3 of 7
Environments 2017, 4, 70 3 of 7
Figure 2. Pyrogenic carbon materials tested in this study.
Figure 2. Pyrogenic carbon materials tested in this study.
Table 1. pH and elemental composition (weight %) of pyrogenic carbon materials
Table 1. pH andCarbon Material
elemental pH C(weight
composition (%) O (%)
%) ofFepyrogenic
(%) Al (%)
carbon materials.
Activated carbon 8.03 73.1 11.6 13.7 1.6
Hoffman biochar 7.88 86.7 13.3 0 0
Carbon Material pH C (%) O (%) Fe (%) Al (%)
Wakefield biochar 10.23 89.8 10.2 0 0
Activated carbon 8.03 73.1 11.6 13.7 1.6
Hoffman
2.2. Batch biochar
Adsorption Experiment 7.88 86.7 13.3 0 0
Wakefield biochar 10.23 89.8 10.2 0 0
Batch sorption experiments were conducted in 50-mL centrifuge tubes at room temperature.
Nitrate solution was prepared in deionized (DI) water containing 50 mg L−1 as potassium nitrate
(KNO3). The
2.2. Batch Adsorption carbon materials (0.45 g) were weighted to the tubes and equilibrated with 36 mL of the
Experiment
nitrate solution. The concentration of nitrate at 50 mg NO3− L−1 were equivalent to 11.3 mg L−1 NO3-N
in elemental
Batch sorption basis. Samples were
experiments with sand or pumice only
conducted were included
in 50-mL as experimental
centrifuge tubes control.
at room Thetemperature.
tubes were shaken for 1 h on an end-to-end shaker at 90 oscillations min−1, and supernatants − 1 were
Nitrate solution was prepared in deionized (DI) water containing 50 mg L as potassium nitrate
filtered through 0.2-µm membrane filters. It is important to note that the 1 h reaction time in this
(KNO3 ). Thestudycarbon materials
may have (0.45
not reached g) were
a chemical weighted
equilibrium to the
of nitrate tubes onto
adsorption andtheequilibrated with 36 mL of
carbon materials.
Our previous
the nitrate solution. Thezinc (Zn) adsorption of
concentration experiment
nitrate with
at 50biochars
mg NO up to− 48-h
L −1equilibration
were showed that
equivalent to 11.3 mg L−1
3
54–98% of Zn adsorption occurred after 1 h relative to the amount of Zn adsorbed after 48 h [15]. The
NO3 -N in elemental basis. Samples with sand or pumice only were included as experimental control.
filtrates were analyzed colorimetrically using a HACH UV–vis spectrophotometer (DR3900,
The tubes were shaken
Loveland, CO, for
USA)1according
h on antoend-to-end
dimethylphenol shaker
methodat for90 oscillations
nitrate min−
(HACH method
1 , and supernatants
10206). The
were filteredamount
through of nitrate adsorbed
0.2-µm by the testedfilters.
membrane materialsIt(q)is
was calculated byto
important Equation (1): the 1 h reaction time
note that
in this study may have not reached a chemical q = (C0Vequilibrium
– CV)/M of nitrate adsorption onto (1) the carbon
materials. Our
where previous zinc (Zn)ofadsorption
C0 is the concentration nitrate in inputexperiment
solution (mg L−1with biochars
), V is the volume ofup to (L),
liquid 48-hC isequilibration
showed thatthe concentration
54–98% of Znofadsorption
nitrate in solution after 1-h equilibration,
occurred and M isto
after 1 h relative drythe
weight of carbon
amount ofmaterial
Zn adsorbed after
(kg). Nitrate adsorption (removal) capacity of the carbon materials was calculated in % relative to the
48 h [15]. The filtrates were analyzed colorimetrically
initial amount of aqueous nitrate added (1.8 mg NO3 ). − using a HACH UV–vis spectrophotometer
(DR3900, Loveland, CO, USA) according to dimethylphenol method for nitrate (HACH method 10206).
The amount 2.3. Column Experiment
of nitrate adsorbed by the tested materials (q) was calculated by Equation (1):
A total of 16 columns (metal cylinder in 7.62-cm diameter by 7.62-cm depth) were packed to a
depth of 4.56 cm with sand or pumice. Sixteen columns corresponded to our experimental treatments
q = (C0 V − CV)/M (1)
consisting of two geomedia and four different carbon amendments, including control in duplicates.
During our initial trials, maximum amounts of sand and pumice needed for packing the columns
where C0 is the
(i.e.,concentration
control columns) of nitrate
were in input
determined solution
to be 318 (mg
g and 165 L−1 ), V isThese
g, respectively. the given
volume were (L), C is the
of liquid
amounts
concentrationdetermined
of nitrateto inhave a bulk density
solution of 1.67
after 1-h g cm for sand
−3
equilibration, and columns
M is and
dry 0.86 g cm−3offor
weight pumicematerial (kg).
carbon
columns. Sand or pumice with and without carbon amendment (5% by weight) was dry-packed into
Nitrate adsorption (removal) capacity of the carbon materials was calculated in % relative to the initial
the columns (Table 2). The bottom of each column was covered with cheese cloth to prevent the
amount of aqueous
geomedianitrate
loss. added (1.8 mg NO3 − ).
2.3. Column Experiment
A total of 16 columns (metal cylinder in 7.62-cm diameter by 7.62-cm depth) were packed to a
depth of 4.56 cm with sand or pumice. Sixteen columns corresponded to our experimental treatments
consisting of two geomedia and four different carbon amendments, including control in duplicates.
During our initial trials, maximum amounts of sand and pumice needed for packing the columns
(i.e., control columns) were determined to be 318 g and 165 g, respectively. These given amounts
were determined to have a bulk density of 1.67 g cm−3 for sand columns and 0.86 g cm−3 for pumice
columns. Sand or pumice with and without carbon amendment (5% by weight) was dry-packed
into the columns (Table 2). The bottom of each column was covered with cheese cloth to prevent the
geomedia loss.Environments 2017, 4, 70 4 of 7
Table 2. The amount of geomedia used for column packing with and without carbon amendment
(5% by weight).
Environments 2017, 4, 70 4 of 7
Column Sand or Pumice (g) Amendment (g)
Table 2. The amount of geomedia used for column packing with and without carbon amendment (5%
by weight) Sand only 318 0
Sand + amendment 302 16
Pumice Column
only Sand or
165Pumice (g) Amendment 0 (g)
Sand only
Pumice + amendment 318
157 0 8
Sand + amendment 302 16
Pumice only 165 0
Each column received 500
Pumice mL of DI water for initial
+ amendment 157 flushing on the
8 first day (day 1). The water
was irrigated by 100 mL increments manually through a circular plastic pan that was placed on the
top of column. The plastic
Each column pan500
received hadmLmultiple small
of DI water forholes,
initial allowing
flushing on uniform
the first dripping
day (day 1).of The
the water
water and
was irrigated
minimizing by disturbance
surface 100 mL increments
on themanually
geomedia.through
On the a circular
secondplastic pan that
day (day was placed
2), columns on the
were leached
top of column. The plastic −
pan1 had multiple small holes, allowing uniform dripping
with nitrate solution (50 mg L ) five times by 100 mL increments, totaling 500 mL of aqueous nitrateof the water and
minimizing
throughput. Thesurface
amount disturbance
of nitrateonapplied
the geomedia.
was 25 Onmg theinsecond
total.day
On(day
the 2), columns
third were leached
day (day 3), columns
with nitrate solution (50 mg L−1) five times by 100 mL increments, totaling 500 mL of aqueous nitrate
were leached again with DI water only (100 mL increments, totaling 500 mL of DI water) to assess
throughput. The amount of nitrate applied was 25 mg in total. On the third day (day 3), columns
desorption of the nitrate. Collected column effluents were analyzed for nitrate in the aforementioned
were leached again with DI water only (100 mL increments, totaling 500 mL of DI water) to assess
method. The effluent
desorption samples
of the nitrate. werecolumn
Collected also determined
effluents were foranalyzed
turbidityforusing
nitrateNEP
in the260 turbidity probe
aforementioned
(McVan Instruments,
method. Melbourne,
The effluent samples Australia) in nephelometric
were also determined turbidity
for turbidity usingunits
NEP(NTU) and forprobe
260 turbidity pH using
a portable
(McVan pH meter (Extech
Instruments, Instruments,
Melbourne, Waltham,
Australia) MA, USA).
in nephelometric turbidity units (NTU) and for pH using
a portable pH meter (Extech Instruments, Waltham, MA, USA).
3. Results and Discussion
3. Results and Discussion
3.1. Batch Adsorption of Nitrate
3.1. Batch Adsorption of Nitrate
Only AC had ability to adsorb nitrate up to 41% (Figure 3) while biochars showed none
Only AC(negative
to even release had ability%)to adsorb nitrate
of nitrate up to from
(0.93% 41% (Figure
HB and3) while
0.13% biochars
from showed
WB). DInone to even
water extracts
release (negative %) of nitrate (0.93% from HB and 0.13% from WB). DI water extracts (1:80
(1:80 solid-to-solution ratio) with the carbon materials (i.e., DI water only with no aqueous nitrate) solid-to-
solution ratio) with the carbon materials (i.e., DI water only with no aqueous nitrate) confirmed that
confirmed that an appreciable concentration was found for HB (1.46 mg NO3 − L−1 ) and WB (1.55 mg
an appreciable concentration was found for HB (1.46 mg NO 3− L−1) and WB (1.55 mg NO3− L−1).
NO3 − L−1 ). Commercial pumice for gardening use is often claimed to hold nutrients but it was not
Commercial pumice for gardening use is often claimed to hold nutrients but it was not the case in the
the case in adsorption
batch the batch adsorption with 1time,
with 1 h reaction h reaction time,for
accounting accounting
only 1.3% for only 1.3%
of nitrate of nitrate
adsorption. Sandadsorption.
also
Sandshowed
also showed
limitedlimited adsorption
adsorption ability
ability (1.2%), (1.2%), indicating
indicating a lacksurfaces
a lack of reactive of reactive surfaces for nitrate.
for nitrate.
50
40
Nitrate adsorption (%)
30
20
10
0
-10
Sand Pumice AC HB WB
Figure
Figure 3. Adsorption
3. Adsorption from
from aqueousnitrate
aqueous nitrate affected
affected by
by geomedia
geomediaand
andcarbon materials.
carbon ErrorError
materials. bars bars
represent standard error of the mean.
represent standard error of the mean.
It is often claimed that biochar can be used as a soil amendment to retain nutrients in soils [16,17].
It is often the
However, claimed that
biochar biochartested
materials can be usedstudy
in this as a showed
soil amendment to retain
no adsorption (evennutrients
release) ofinnitrate
soils in
[16,17].
However, the biochar
a batch-scale materialsOur
experiment. tested in this
result is instudy showed
agreement noYao
with adsorption (evenwho
et al. (2012) release)
foundoflimited
nitrate in a
adsorption
batch-scale of nitrateOur
experiment. (Environments 2017, 4, 70 5 of 7
removing cationic species from solution as most biochars were found to have a net negative surface
charge [15]. While both AC and biochars have carbonaceous materials as feedstock materials and
convert them to stable carbon through pyrolysis, AC typically receives an additional activation process
where it undergoes oxidation to increase adsorptive capacities [19].
It is important to note that feedstock materials for the biochars were plant-based while
Environments 2017, 4, 70 5 of 7
the AC
was produced from selected coal according to manufacturer. Detailed information on the feedstock
types andnegative surface chargeprocesses
manufacturing [15]. While of
both AC and
these biochars have
commercial carbonaceous
products materials as feedstock
are proprietary and unknown.
materials and convert them to stable carbon through pyrolysis, AC typically receives
However, it was notable that the AC contained substantial amount of Fe (13.7%) and Al (1.6%) in its an additional
activation process where it undergoes oxidation to increase adsorptive capacities [19].
elemental composition (Table 1), indicating mineral inclusion of Fe and Al and possibly leading to
It is important to note that feedstock materials for the biochars were plant-based while the AC
better adsorption
was produced offrom
nitrate. Thecoal
selected Feaccording
mineralstosuch as hematite,
manufacturer. goethite,
Detailed and on
information iron-oxide have been
the feedstock
found to increase
types oxyanion adsorption
and manufacturing processes ofsuch
theseascommercial
arsenite and arsenate
products in the Fe-impregnated
are proprietary and unknown. carbon
materials thoughit surface
However, was notablecomplexation betweensubstantial
that the AC contained the Fe-O surface
amount ofand oxyanion
Fe (13.7%) and[20,21].
Al (1.6%) in its
elemental composition (Table 1), indicating mineral inclusion of Fe and Al and possibly leading to
3.2. Nitrate
betterLeaching in Column
adsorption of nitrate.Experiment
The Fe minerals such as hematite, goethite, and iron-oxide have been
found to increase oxyanion adsorption such as arsenite and arsenate in the Fe-impregnated carbon
Overall turbidity
materials though in effluent
surface samples between
complexation were 3- the
to 4-times greater
Fe-O surface and in pumice
oxyanion columns (17 to 27 NTU)
[20,21].
compared to sand columns (5 to 7 NTU) (Table 3). Coarse grains in pumice were likely to contribute to
3.2. Nitrate
the higher turbidityLeaching in Column
by eluting fineExperiment
suspended solids from pumice and the carbon materials. The pH
values in column
Overall effluents
turbidity inranged
effluentfrom 7.6 were
samples to 8.73- and the columns
to 4-times greater inamended with WB
pumice columns showed
(17 to 27 the
highestNTU)
pH (7.9compared
to 8.7),toindicating
sand columns the (5 to 7 NTU)
presence (Table 3).ash
of mineral Coarse grains
in the WBin[22].pumice were likely to
contribute
Under to theinput
the pulse higherof turbidity by eluting
nitrate solution (50fine
mgsuspended
NO3 − L−solids from in
1 ), nitrate pumice
columnandeffluents
the carbon
increased
materials. The pH values in column effluents ranged from 7.6 to 8.7 and the columns amended − 1 with
with nitrate solution throughput (leaching event 1–5 in Figure 4) up to 11 mg L in both sand and
WB showed the highest pH (7.9 to 8.7), indicating the presence of mineral ash in the WB [22].
pumice columnsUnder the(Figure
pulse 4). The
input lowestsolution
of nitrate concentration
(50 mg NOwas found with sand column amended with
3− L−1), nitrate in column effluents increased
AC (7 mg − 1 L−to1 ), suggesting
withLnitrate
) and pumice
solution column(leaching
throughput amended eventwith AC
1–5 in (8 mg
Figure 4) up 11 mg L−1 in bothACsand
outperformed
and
biochars in thecolumns
pumice flow-through
(Figure 4). experiment as well. Under
The lowest concentration wasthe desorption
found with sand stage
column(leaching
amended event
with 6–10),
AC (7
the nitrate mg L−1) and pumice
concentrations columndecreased
gradually amended withwithAC AC (8 amendment
mg L−1), suggestingin bothAC geomedia
outperformed being the
biochars in the − flow-through experiment as well. Under the desorption stage (leaching event 6–10),
1
lowest (1 to 3 mg L ) suggesting that AC amendment was more effective than biochar amendment in
the nitrate concentrations gradually decreased with AC amendment in both geomedia being the
retaining nitrate during desorption stage.
lowest (1 to 3 mg L−1) suggesting that AC amendment was more effective than biochar amendment
in retaining nitrate during desorption stage.
Table 3. Average pH and turbidity (mean ± standard error) in column effluents over the entire
leachingTable
events.
3. Average pH and turbidity (mean ± standard error) in column effluents over the entire
leaching events
Column a pH Turbidity (NTU)
Column a pH Turbidity (NTU)
7.84 ± 0.18
Sand only
Sand only 7.84 ± 0.18 7.29 ± 0.85 7.29 ± 0.85
Sand + AC 7.92 ± 0.06 5.38 ± 0.59
Sand + HB Sand + AC 7.92 ± 0.06
7.93 ± 0.08 5.38 ± 0.59 7.43 ± 0.56
Sand + WB Sand + HB 7.93 ± 0.08
8.73 ± 0.16 7.43 ± 0.56 7.35 ± 1.72
Pumice onlySand + WB 7.60
8.73 ± 0.08
± 0.16 7.35 ± 1.72 23.86 ± 5.57
Pumice + ACPumice only 7.60 7.50 ± 0.06
± 0.08 23.86 ± 5.57 24.61 ± 4.22
Pumice + HB 7.58 ± 0.05 26.80 ± 3.80
Pumice + AC 7.50
Pumice + WB
± 0.06
7.91 ± 0.17
24.61 ± 4.22 17.41 ± 2.46
Pumice + HB 7.58 ± 0.05 26.80 ± 3.80
a AC = activated carbon; HB = Hoffman biochar; WB = Wakefield biochar.
Pumice + WB 7.91 ± 0.17 17.41 ± 2.46
a AC = activated carbon; HB = Hoffman biochar; WB = Wakefield biochar.
12 12
Sand only Pumice only
10
(a) Sand + AC 10
(b) Pumice + AC
DI Sand + HB Pumice + HB
NO3- (mg L-1)
water Sand + WB Pumice + WB
NO3- (mg L-1)
8 8
DI water
6 6
50 mg L-1
4 4
2 50 mg L-1 2
0 0
0 2 4 6 8 10 12 0 2 4 6 8 10 12
Leaching event Leaching event
Figure Figure 4. Concentrations of nitrate (NO3−))in
incolumn effluents: (a) sand and (b) pumice.
−
4. Concentrations of nitrate (NO 3 column effluents: (a) sand and (b) pumice.Environments 2017, 4, 70 6 of 7
Environments 2017, 4, 70 6 of 7
Cumulative amount of nitrate leached (Figure 5) showed a clear separation of AC-amended sand
Cumulative amount of nitrate leached (Figure 5) showed a clear separation of AC-amended sand
or pumice geomedia being the lowest (3.6 to 4 mg as NO3− − ) after the entire leaching event. In both
or pumice geomedia being the lowest (3.6 to 4 mg as NO3 ) after the entire leaching event. In both
sand and pumice columns, HB resulted in higher nitrate leaching (6.3 mg) than control columns
sand and pumice columns, HB resulted in higher nitrate leaching (6.3 mg) than control columns (5.2–
(5.2–5.3 mg)while
5.3 mg) while WB-amended
WB-amended columns
columns showedshowed similarofamount
similar amount of nitrate
nitrate leached withleached with control
control columns.
columns.
The higher amount of nitrate leached from the columns amended with HB was in agreementagreement
The higher amount of nitrate leached from the columns amended with HB was in with
with the
thegreater
greaterrelease
release ofof nitrate
nitrate from
from batch
batch adsorption
adsorption (Figure
(Figure 3). There
3). There was nowas no substantial
substantial difference
difference in
in thethe
amount
amountof ofnitrate
nitrate leached betweensand-only
leached between sand-only
(5.3(5.3
mg)mg)
andand pumice-only
pumice-only columns
columns (5.2 mg).
(5.2 mg).
7 7
Sand only
6 Sand + AC
(a) 6
Pumice only (b)
Pumice + AC
NO3- leached (mg)
NO3- leached (mg)
Sand + HB Pumice + HB
5 Sand + WB 5
Pumice + WB
4 4
3 3
2 2
DI water DI water
1 1
50 mg L-1 50 mg L-1
0 0
0 2 4 6 8 10 12 0 2 4 6 8 10 12
Leaching event Leaching event
Figure
Figure 5. Cumulative
5. Cumulative amount
amount ofof
nitrate (NO33−))leached
nitrate(NO leachedinin
column effluents:
column
− (a) sand
effluents: and (b)
(a) sand andpumice.
(b) pumice.
4. Conclusions
4. Conclusions
Results in this study suggested that sand and pumice geomedia amended with biochars (5% by
Resultswere
weight) in this
notstudy suggested
as effective thatamended
as those sand and pumice
with AC. Thegeomedia
presenceamended
of Fe and Al with biochars
in the AC was (5% by
weight) were
likely not as effective
to promote as those possibly
nitrate adsorption amended with AC.
through Thecomplexation
surface presence of to Fesome
and Al in the
extent. AC was
There
likelywas
to promote nitrate
no substantial adsorption
difference possibly
between sandthrough
and pumicesurface complexation
columns to some
in all carbon extent.types.
amendment There was
Our studydifference
no substantial indicated that net negatively
between sand andcharged
pumice surfaces
columnsofintheall biochars may be attributed
carbon amendment types.toOur
thestudy
poor adsorption of nitrate anion due to electrostatic repulsion. To improve its efficacy
indicated that net negatively charged surfaces of the biochars may be attributed to the poor adsorption for aqueous
nitrateanion
of nitrate removal,
dueantoadditional process
electrostatic during biochar
repulsion. production
To improve is desirable
its efficacy fortoaqueous
create acid functional
nitrate removal,
groups (which have a positive charge) that can protonate surface –OH group in biochars [23,24]. It is
an additional process during biochar production is desirable to create acid functional groups (which
important to note that while biochar may not be effective in reducing nitrate leaching, it can provide
have a positive charge) that can protonate surface –OH group in biochars [23,24]. It is important to
other benefits such as increasing the N use efficiency by plants and decrease nitrous oxide (N2O)
note emission
that while biochar may not be effective in reducing nitrate leaching, it can provide other benefits
from N-rich soils. Our study included nitrate only under controlled leaching conditions and
suchfuture
as increasing the N
study should use efficiency
consider evaluatingbymultiple
plants anions
and decrease nitrous
and/or cations foroxide (N2applications
the field O) emission of from
N-richgeomedia amended with pyrogenic carbon materials. In addition, future study investigating thestudy
soils. Our study included nitrate only under controlled leaching conditions and future
should consider
synergistic evaluating
effect multiple
of the carbon anionsinand/or
amendment geomedia cations for with
combined the field
redoxapplications of geomedia
condition is needed to
advance
amended ourpyrogenic
with understanding of biotic
carbon and abiotic
materials. processes of
In addition, nitrate
future retention
study in stormwater
investigating thecontrol
synergistic
effectmeasures.
of the carbon amendment in geomedia combined with redox condition is needed to advance our
understanding of biotic and abiotic processes of nitrate retention in stormwater control measures.
Acknowledgments: We gratefully acknowledge UTRGV graduate assistantship from the School of Earth,
Environmental and Marine Sciences, UTRGV work study program, and US EPA Border 2020 Program for the
Acknowledgments: We gratefully acknowledge UTRGV graduate assistantship from the School of Earth,
partial funding
Environmental andofMarine
this project.
Sciences, UTRGV work study program, and US EPA Border 2020 Program for
the partial
Author funding of this project.
Contributions: Kang supervised the overall project and wrote the manuscript. Davila and Mireles
collected
Author column andKang
Contributions: batch supervised
adsorption data,
the respectively.
overall projectHo contributed
and wrotetothe manuscript preparation
manuscript. Davilaand data
and Mireles
analyses.
collected column and batch adsorption data, respectively. Ho contributed to manuscript preparation and
data analyses.
Conflicts of Interest: The authors declare no conflict of interest. The use of trade names in this publication does
not imply
Conflicts endorsement
of Interest: of the products
The authors declarenamed or criticism
no conflict of similar
of interest. Theones
usenot
of mentioned by these
trade names organizations.
in this publication does
not imply endorsement of the products named or criticism of similar ones not mentioned by these organizations.
References
References
1. US Environmental Protection Agency. National Water Quality Inventory: Report to Congress: 2004 Reporting
Cycle; USEPA, Office of Water: Washington, DC, 2009.
1. US Environmental Protection Agency. National Water Quality Inventory: Report to Congress: 2004 Reporting
Cycle; USEPA, Office of Water: Washington, DC, USA, 2009.
2. Li, L.; Davis, A.P. Urban stormwater runoff nitrogen composition and fate in bioretention systems. Environ.
Sci. Technol. 2004, 48, 3403–3410. [CrossRef] [PubMed]Environments 2017, 4, 70 7 of 7
3. Camargo, J.A.; Alonso, Á. Ecological and toxicological effects of inorganic nitrogen pollution in aquatic
ecosystems: A global assessment. Environ. Int. 2006, 32, 831–849. [CrossRef] [PubMed]
4. Chang, N.B.; Hossain, F.; Wanielista, M. Filter media for nutrient removal in natural systems and built
environments: I—Previous trends and perspectives. Environ. Eng. Sci. 2010, 27, 689–706. [CrossRef]
5. Demiral, H.; Gündüzoğlu, G. Removal of nitrate from aqueous solutions by activated carbon prepared from
sugar beet bagasse. Bioresour. Technol. 2010, 101, 1675–1680. [CrossRef] [PubMed]
6. Ahmedna, M.; Marshall, W.E.; Husseiny, A.A.; Rao, R.M.; Goktepe, I. The use of nutshell carbons in drinking
water filters for removal of trace metals. Water Res. 2004, 38, 1062–1068. [CrossRef] [PubMed]
7. Kazemipour, M.; Ansari, M.; Tajrobehkar, S.; Majdzadeh, M.; Kermani, H.R. Removal of lead, cadmium, zinc,
and copper from industrial wastewater by carbon developed from walnut, hazelnut, almond, pistachio shell,
and apricot stone. J. Hazard. Mater. 2008, 150, 322–327. [CrossRef] [PubMed]
8. Ippolito, J.A.; Laird, D.A.; Busscher, W.J. Environmental benefits of biochar. J. Environ. Qual. 2012, 41,
967–972. [CrossRef] [PubMed]
9. Ahmad, M.; Rajapaksha, A.U.; Lim, J.E.; Zhang, M.; Bolan, N.; Mohan, D.; Ok, Y.S. Biochar as a sorbent for
contaminant management in soil and water: A review. Chemosphere 2013, 99, 19–33. [CrossRef] [PubMed]
10. Liang, B.; Lehmann, J.; Solomon, D.; Sohi, S.; Thies, J.E.; Skjemstad, J.O.; Wirick, S. Stability of
biomass-derived black carbon in soils. Geochim. Cosmochim. Acta 2008, 72, 6069–6078. [CrossRef]
11. Ahiablame, L.M.; Engel, B.A.; Chaubey, I. Effectiveness of low impact development practices: Literature
review and suggestions for future research. Water Air Soil Pollut. 2012, 223, 4253–4273. [CrossRef]
12. Ho, J.; Kang, J. Hydrologic impacts of bioswale porous media on parking lot drainage. Int. J. Civ. Struct.
Eng. Res. 2017, 5, 23–30.
13. Gee, G.W.; Bauder, J.W. Particle-size analysis. In Methods of Soil Analysis, 2nd ed.; Klute, A., Ed.; Agronomy
Monograph No. 9; ASA and SSSA: Madison, WI, USA, 1986; Part 1, pp. 404–408.
14. Venezia, A.M.; Floriano, M.A.; Deganello, G.; Rossi, A. The structure of pumice: An XPS and 27Al MAS
NMR study. Surf. Interface Anal. 1992, 18, 532–538. [CrossRef]
15. Mireles, S.; Ok, Y.; Cheng, C.; Kang, J. Adsorptive and kinetic characterization of aqueous zinc removal by
biochars. SDRP J. Earth Sci. Environ. Stud. 2016, 1, 1–7.
16. Beesley, L.; Moreno-Jiménez, E.; Gomez-Eyles, J.L.; Harris, E.; Robinson, B.; Sizmur, T. A review of biochars’
potential role in the remediation, revegetation and restoration of contaminated soils. Environ. Pollut. 2011,
159, 3269–3282. [CrossRef] [PubMed]
17. Lehmann, J.; Rillig, M.C.; Thies, J.; Masiello, C.A.; Hockaday, W.C.; Crowley, D. Biochar effects on soil
biota—A review. Soil Biol. Biochem. 2011, 43, 1812–1836. [CrossRef]
18. Yao, Y.; Gao, B.; Zhang, M.; Inyang, M.; Zimmerman, A.R. Effect of biochar amendment on sorption and
leaching of nitrate, ammonium, and phosphate in a sandy soil. Chemosphere 2012, 89, 1467–1471. [CrossRef]
[PubMed]
19. Azargohar, R.; Dalai, A.K. Biochar as a precursor of activated carbon. In Twenty-Seventh Symposium on
Biotechnology for Fuels and Chemicals; Humana Press: New York, NY, USA, 2006; pp. 762–773.
20. Hu, X.; Ding, Z.; Zimmerman, A.R.; Wang, S.; Gao, B. Batch and column sorption of arsenic onto
iron-impregnated biochar synthesized through hydrolysis. Water Res. 2015, 68, 206–216. [CrossRef] [PubMed]
21. Cantu, J.; Gonzalez, L.E.; Goodship, J.; Contreras, M.; Joseph, M.; Garza, C.; Eubanks, T.M.; Parsons, J.G.
Removal of arsenic from water using synthetic Fe7 S8 nanoparticles. Chem. Eng. J. 2016, 290, 428–437.
[CrossRef] [PubMed]
22. Mukome, F.N.; Parikh, S.J. Chemical, Physical, and Surface characterization of Biochar. In Biochar: Production,
Characterization, and Applications; Ok, Y.S., Ed.; CRC Press: Boca Raton, FL, USA, 2015; pp. 68–96.
23. Gai, X.; Wang, H.; Liu, J.; Zhai, L.; Liu, S.; Ren, T.; Liu, H. Effects of feedstock and pyrolysis temperature on
biochar adsorption of ammonium and nitrate. PLoS ONE 2014, 9, e113888. [CrossRef] [PubMed]
24. Yang, J.; Li, H.; Zhang, D.; Wu, M.; Pan, B. Limited role of biochars in nitrogen fixation through nitrate
adsorption. Sci. Total Environ. 2017, 592, 758–765. [CrossRef] [PubMed]
© 2017 by the authors. Licensee MDPI, Basel, Switzerland. This article is an open access
article distributed under the terms and conditions of the Creative Commons Attribution
(CC BY) license (http://creativecommons.org/licenses/by/4.0/).You can also read