Alterations of the tumor microenvironment in glioblastoma following radiation and temozolomide with or without bevacizumab - Annals of ...
←
→
Page content transcription
If your browser does not render page correctly, please read the page content below
Original Article
                                                                                                                                   Page 1 of 11

Alterations of the tumor microenvironment in glioblastoma
following radiation and temozolomide with or without
bevacizumab
Ryota Tamura1, Toshihide Tanaka2, Yukina Morimoto1, Yuki Kuranari1, Yohei Yamamoto2, Jun Takei2,
Yuichi Murayama3, Kazunari Yoshida1, Hikaru Sasaki1
1
    Department of Neurosurgery, Keio University School of Medicine, Shinjuku-ku, Tokyo, Japan; 2Department of Neurosurgery, Jikei University
Kashiwa Hospital, Kashiwa-shi, Chiba, Japan; 3Department of Neurosurgery, Jikei University Hospital, Minato-ku, Tokyo, Japan
Contributions: (I) Conception and design: R Tamura, H Sasaki, T Tanaka; (II) Administrative support: T Tanaka, H Sasaki; (III) Provision of study
materials or patients: T Tanaka, H Sasaki, Y Murayama, K Yoshida; (IV) Collection and assembly of data: R Tamura, T Tanaka, Y Morimoto, Y
Kuranari, H Sasaki; (V) Data analysis and interpretation: R Tamura, Y Morimoto, Y Kuranari, H Sasaki, T Tanaka; (VI) Manuscript writing: All
authors; (VII) Final approval of manuscript: All authors.
Correspondence to: Toshihide Tanaka, MD, PhD. Department of Neurosurgery, Jikei University Kashiwa Hospital, 163-1 Kashiwashita, Kashiwa-shi,
Chiba, 277-8567, Japan. Email: ttanaka@jikei.ac.jp.

                  Background: The immunosuppressive tumor microenvironment (TME) contributes to the tumor
                  progression and treatment failure. Our previous study demonstrated alterations in the TME during
                  bevacizumab (Bev) therapy in human glioblastoma (GB) specimens obtained from patients who underwent
                  surgical resection. Continuous Bev administration downregulates the expression of programmed cell
                  death-1 (PD-1)/programmed cell death ligand-1 (PD-L1), suppresses the infiltration of tumor associated
                  macrophages (TAMs) and regulatory T cells (Tregs), and increases cytotoxic T lymphocytes (CTLs)
                  infiltration. However, one may argue that these immunosupportive effects might also be induced by radiation
                  therapy (RT) or temozolomide (TMZ), and they cannot necessarily be attributed to Bev alone.
                  Methods: In the present study, changes in the molecules relevant to the TME were analyzed by
                  immunohistochemistry using paired pre- and post-treatment samples of malignant glioma specimens from
                  15 patients who received RT and TMZ therapy without Bev.
                  Results: The expression levels of CD34, vascular endothelial growth factor (VEGF)-A, VEGF receptor
                  2 (VEGFR2), HIF-1α, CA9, nestin, CD4, CD8, CD163, PD-1, and PD-L1 were not significantly changed
                  after the treatment with RT and TMZ. However, VEGFR1 expression and the number of Foxp3-positive
                  cells tended to be upregulated and increased after the treatment (P=0.058, P=0.082, respectively).
                  Conclusions: This was the first study to show the alterations of TME following RT and TMZ therapy
                  using paired pre- and post-treatment malignant glioma samples. Long-term treatment of RT and TMZ
                  might worsen immunosuppressive TME in malignant gliomas.

                  Keywords: Temozolomide; radiation; glioblastoma (GB); regulatory T cell; tumor-associated macrophage

                  Submitted Dec 17, 2019. Accepted for publication Feb 19, 2020.
                  doi: 10.21037/atm.2020.03.11
                  View this article at: http://dx.doi.org/10.21037/atm.2020.03.11

Introduction                                                                 tumor immune response caused by an immunosuppressive

The tumor microenvironment (TME) exerts an                                   TME is associated with the refractoriness of treatment for
immunosuppressive effect and plays critical roles in tumor                   glioblastomas (GBs) (2). The vascular endothelial growth
growth, angiogenesis, and metastasis (1). The lack of anti-                  factor (VEGF) is induced by hypoxia through a hypoxia-

© Annals of Translational Medicine. All rights reserved.                 Ann Transl Med 2020;8(6):297 | http://dx.doi.org/10.21037/atm.2020.03.11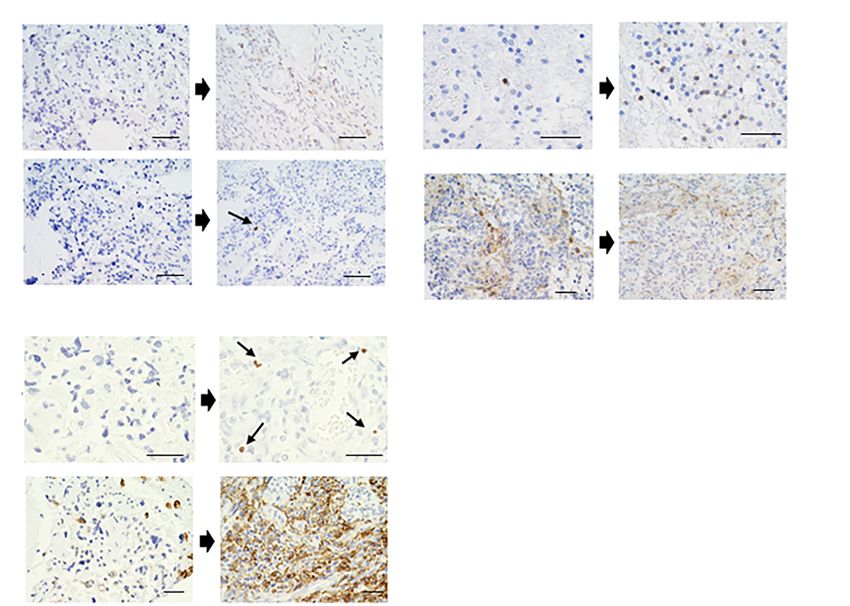
Page 2 of 11                                                                                                                                   Tamura et al. TME following radiation and temozolomide

                       A                                                 Post-operation            B                                                        Post-operation

                                                                     Gd+              FLAIR                                                           Gd+               FLAIR

                           Specimens obtained from same patients

                                                                                                       Specimens obtained from same patients
                                                                   Recurrence after TMZ + RT                                                           Recurrence after Bev

                                                                     Gd+              FLAIR                                                           Gd+               FLAIR

Figure 1 Design of the present study. In the present study, alterations in molecules that are relevant to the TME are analyzed using
paired pre- and post-RT and TMZ specimens from 15 patients with malignant glioma (A). These results are compared with previously
reported results using paired pre-and post-Bev therapy (B). T1-weighted images with contrast enhancement and FLAIR images acquired
after operation and at the recurrent stage after the Stupp regimen (RT and TMZ) or Bev therapy are shown. Bev, bevacizumab; Gd+, T1-
weighted images with contrast enhancement; FLAIR, FLuid-Attenuated Inversion Recovery; RT, radiotherapy; TMZ, temozolomide.

inducible factor 1 alpha (HIF-1α)-depending pathway,                                               therapy, to confirm the differential actions between Bev and
which contributes to immune suppression in the TME (3).                                            Stupp protocol.
Therefore, agents that target VEGF [bevacizumab (Bev)] or
the VEGF receptor (VEGFR; sunitinib and sorafenib) are
                                                                                                   Methods
expected to induce not only anti-angiogenic effects, but also
immunosupportive effects (4).                                                                      This study was approved by the Institutional Review Board
   We have previously analyzed the alterations of the TME                                          of our institutes (Reference number: 20050002 and 26-334).
following Bev therapy using actual human GB specimens.                                             Written consent was obtained from all patients.
Bev downregulated the expression of programmed cell
death-1 (PD-1)/programmed cell death ligand-1 (PD-
                                                                                                   Tissue specimens
L1), suppressed the infiltration of regulatory T cells
(Tregs) and tumor-associated macrophages (TAMs), and                                               In the present study, we analyzed paired pre- and post-RT
increased cytotoxic T lymphocytes (CTLs) infiltration (5).                                         and TMZ specimens from 15 patients with malignant glioma
Importantly, this immunosupportive condition was sustained                                         (30 tumor tissues) (Figure 1A). All tissue specimens were
during continuous Bev usage. However, one may argue                                                obtained by surgical operation at Keio University School
that these immunosupportive effects may also be induced                                            of Medicine and Jikei University Kashiwa Hospital, Japan
by the standard treatment protocol using Stupp regimen                                             between January 2009 and December 2018. The analyses
[radiation therapy (RT) concomitant with temozolomide                                              were performed at Keio University School of Medicine. The
(TMZ) and adjuvant TMZ] (6), and they cannot necessarily                                           present results were compared with those of our previous
be attributed to Bev.                                                                              studies regarding Bev administration (5,7,8) (Figure 1B).
   Therefore, in the present study, alterations in the
molecules that are relevant to the TME were analyzed
                                                                                                   Immunohistochemical analyses
using paired pre- and post-RT and TMZ specimens from
15 patients with malignant glioma who did not receive Bev                                          Immunohistochemical analyses were performed, as

© Annals of Translational Medicine. All rights reserved.                                       Ann Transl Med 2020;8(6):297 | http://dx.doi.org/10.21037/atm.2020.03.11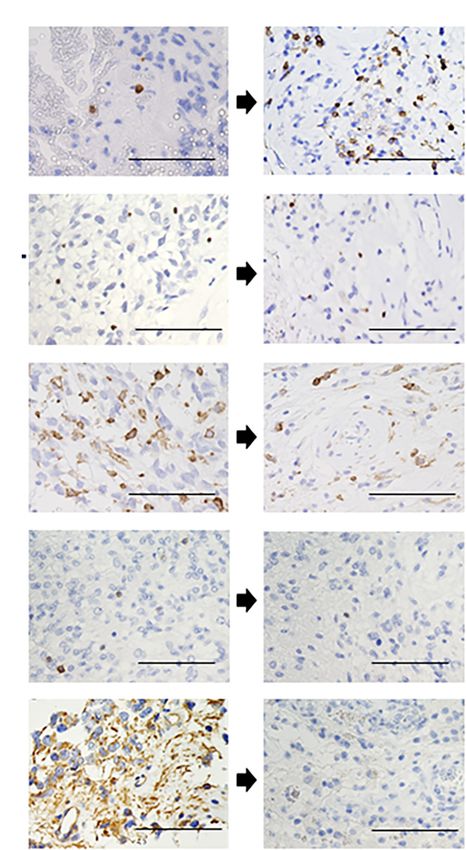
Annals of Translational Medicine, Vol 8, No 6 March 2020                                                                   Page 3 of 11

previously described (5,7,8). The following antibody were            form of tumor cells was essentially similar to that of the
used: anti-VEGF-A (1:200, JH121, Merck Millipore),                   previous surgery (data not shown). Palisading necrosis and
anti-VEGF receptor (VEGFR)1 (1:200, AF321, R&D                       microvascular proliferation were also observed. Microvessel
SYSTEMS), anti-VEGFR2 (1:600, 55B11, Cell Signaling                  density (MVD) was not decreased in the tumors after
Technology), anti-CD34 (1:100, F1604, Nichirei                       RT and TMZ compared with that before the treatment
Biosciences Inc.), anti-HIF-1α (1:100, H-206, Santa                  (pre, 32.9±12.76/5HPF; post, 33.9±11.29/5HPF, P=0.41)
Cruz Biotechnology), anti-carbonic anhydrase 9 (CA9)                 (Figure 2A,B) (Table 1).
(1:50, H-120, Santa Cruz Biotechnology), anti-nestin
(1:100, 10C2, Chemicon), anti-PD-1 (1:50, NAT105,
                                                                     VEGF-A/VEGFRs expressions
Abcam), anti-PD-L1 (1:500, 28-8, Abcam) , anti-CD4
(1:200, 1F6, Nichirei Bioscience Inc.), anti-CD8 (1:100,             VEGF-A staining was diffuse intense staining (++) in
144B, Abcam), anti-Foxp3 (1:100, ab54501, Abcam), and                8/15 and 10/15 tumors before and after RT and TMZ,
anti-CD163 (1:100, ab87099, Abcam). The status of the                respectively (P=0.46) (Figure 2A,B). VEGFR1 staining was
TME after Bev administration in our previous studies (5)             observed in endothelial cells and tumor cells in 3/15 and 8/15
was also highlighted using the original figures (Figure 1B).         tumors before and after RT and TMZ, respectively (P=0.058)
The results of the immunohistochemical analysis were                 (Figure 2A,B). VEGFR2 staining was detected in endothelial
evaluated, as previously described (5,7,8) (noted in Table 1).       cells and tumor cells in 2/15 and 1/15 tumors before and
                                                                     after RT and TMZ, respectively (P=0.54) (Figure 2A,B).

Statistical analyses
                                                                     Expression of hypoxic marker
Paired t-test was used for the paired comparison of the
markers described above (CD34, nestin, CD4, CD8,                     Fourteen tumors before the RT and TMZ exhibited
Foxp3, CD163, and PD-1). Chi-squared test was applied                positive (+ and ++) staining for HIF-1α, while all tumors
to compare the scores of VEGF-A, VEGFR1/R2, HIF-1α,                  after the treatment showed positive (+ and ++) staining for
CA9 and PD-L1 expressions. Student’s t-test was used for             the marker (P=0.46) (Figure 2A,B). The CA9 staining was
the comparison of percent change in markers from baseline            universal or occasional in 9/15 and 10/15 tumors before and
in the patients who received ≥10 courses of TMZ vs. those            after RT and TMZ, respectively (P=0.54) (Figure 2A,B).
who did not. All statistical analyses were performed using
IBM SPSS statistics. P value less than 0.05 was considered           Nestin expression
to be statistically significant.
                                                                     Although numerous nestin-positive tumor cells were observed
                                                                     in all pre-and post- tumors treated with RT and TMZ, there
Results                                                              was no difference of nestin-positive cell ratio of tumors
Patients characteristics                                             before vs. after the RT and TMZ (pre, 40.8%±22.31%; post,
                                                                     37.73%±24.73%, P=0.36) (Figure 2A,B).
The general information of the patients, as well as their
location and histology results, are summarized in Table 2.
                                                                     PD-1/PD-L1 expressions
Fourteen cases were wild type for isocitrate dehydrogenase
(IDH)1-R132H, whereas O6-methylguanine DNA                           There was no difference in the number of PD-1 (+)
methyltransferase (MGMT) promoter methylation was                    cells between tumors before vs. after the RT+TMZ
observed in 8 cases. The median number of courses of                 (pre, 3.47±2.89/5HPF; post, 3.73±2.34/5HPF, P=0.39)
TMZ was five (mean, 6.6 courses). The median overall                 (Figure 3A,B). Positive (+++) staining for PD-L1 was
survival was 603 days (72–1,142 days) (Table 2).                     observed in four out of 15 tumors before and in three out of
                                                                     15 tumors after the RT and TMZ (P=0.66) (Figure 3A,B).

Histological and vascular changes
                                                                     CD4 and CD8 expressions
The recurrent tumors following RT and TMZ showed
proliferation of astrocytes with nuclear anaplasia, and the          There was no differences in the number of CD4 (+) and

© Annals of Translational Medicine. All rights reserved.         Ann Transl Med 2020;8(6):297 | http://dx.doi.org/10.21037/atm.2020.03.11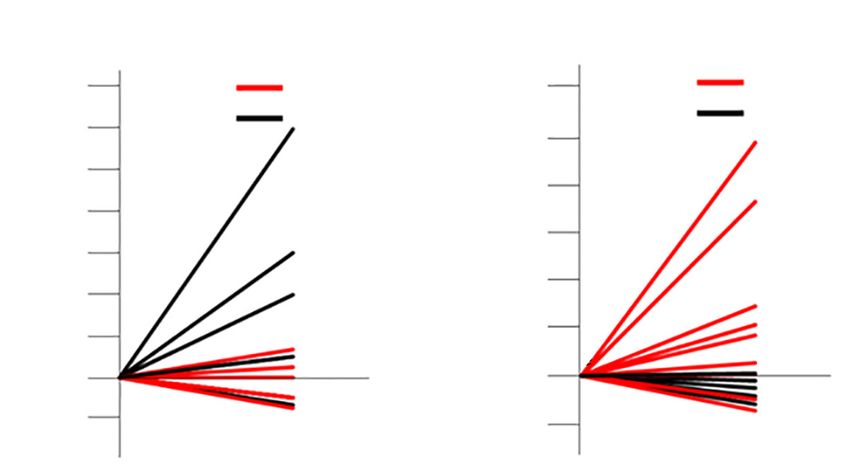
Page 4 of 11                                                                        Tamura et al. TME following radiation and temozolomide

 Table 1 Results of immunohistochemical analyses
                                                                                   PD-L1        PD-1       CD4       CD8       Foxp3     CD163
 Case          VEGF-A VEGFR1 VEGFR2            CD34 Nestin % HIF-1α         CA9
                                                                                   (score)    (/5HPF)    (/5HPF)   (/5HPF)    (/5HPF)    (/5HPF)
 1 pre          ++         ++          +        64         80       +        −        2         12         24         14          4        33
 1 post         ++         ++          +        32         70       +        −        3          3         13          5          1        62
 2 pre           +          +          +        34         60       ++       +        3          5         12         10          1        42
 2 post          +         ++          +        48         15       +        −        2          8          8          5          3        38
 3 pre           +          +          +        38         3        ±        −        3          6          4          8          2        24
 3 post         ++         ++          +        36         5        ±        −        1          1          2          3          2        12
 4 pre          ++         ++          +        26         25       ±        +        3          1          2          2          1        22
 4 post         ++         ++          +        52         30       +        +        3          2         12          2          1        46
 5 pre          ++         ++          +        21         35       +        +        3          0          2          3          1        16
 5 post          +          +          +        37         55       ++       ++       3          6         24         15          7        12
 6 pre          ++          +          +        24         52       +        −        1          4          3          6          2        42
 6 post         ++         ++          +        46         74       +        +        2          6         10         10          6        44
 7 pre          ++          +          +        32         43       ++       +        1          2          2         12          1        64
 7 post         ++         ++          +        30         31       +        +        1          7          3          2          4        26
 8 pre          ++          +          +        19         41       +        +        1          3          4          3          4        11
 8 post         ++          +          +        24         31       +        ++       1          1          3          2          8        52
 9 pre           +          +         ++        26         21       ++       −        1          3          7          6          2         8
 9 post          +          +         ++        18         28       ++       −        1          6         10         18          1        48
 10 pre         ++          +          +        42         31       ++       ++       1          3         15         14          4        36
 10 post        ++         ++          +        51         69       ++       +        1          3          4         12          6        38
 11 pre          +          +         ++        40         74       +        −        1          5         16         12          6        21
 11 post        ++          +          +        24         11       +        −        1          4          2         10          2        12
 12 pre          +          +          +        21         9        +        −        1          1          2          8          1         8
 12 post         +          +          +        22         11       +        +        1          1          3          6          1        20
 13 pre          +          +          +        48         32       ++       +        2          3          5          8          3        42
 13 post        ++          +          +        30         14       ++       +        1          2         10          6          5        44
 14 pre          +          +          +        40         42       ++       +        1          1          3         30          2        46
 14 post        ++         ++          +        38         64       ++       +        2          4          1         11          2        12
 15 pre         ++          +          +        18         64       ++       +        2          3          3          4          4        50
 15 post         +          +          +        21         58       +        +        2          2          7         14          5        64
 For the assessment of microvessel density (MVD), the tissue sections were screened in low-power fields (x4), and the three most vascularized
 regions (hot spots) were selected for each region. The counting of microvessels was performed on these regions at high-power fields (×20,
 0.95 mm2). VEGF-A expression in the tumor cytoplasm or stroma was assessed as follows: ++, diffuse intense staining; +, diffuse faint
 staining; −, negative staining. The expressions of VEGFR1 and VEGFR2 on endothelial or tumor cell membrane/cytoplasm were assessed:
 ++, staining in both vascular endothelial cells and tumor cells; +, staining only in vascular endothelial cells; −, negative staining. Expression
 of HIF-1α was assessed as: ++, expression in >10% of tumor cells; +, expression in ≤10% of tumor cells; −, negative staining. Expression of
 CA9 was assessed as: ++, universal strong expression around necrotic regions; +, occasional expression (typically around necrotic regions);
 −, negative staining. Expression of nestin was assessed as a positive cell ratio analyzed in more than 1,000 tumor cells from more than
 three areas, showing the representative appearance of each tumor. For the assessment of PD-1, CD3, CD4, CD8, Foxp3, and CD163, the
 stained sections were screened at low-power fields (×4), and 5 hot spots were selected. Then, the number of positive cells in these areas
 was counted in high-power fields (×40, 0.47 mm2). The expression of PD-L1 was scored as a percentage of tumor cells expressing PD-L1, as
 described previously. PD-1, programmed cell death-1; PD-L1, programmed cell death ligand-1; post, post-Stupp regimen tumors; pre, pre-
 Stupp regimen initial tumors; VEGF, vascular endothelial growth factor; VEGFR, vascular endothelial growth factor receptor.

© Annals of Translational Medicine. All rights reserved.                 Ann Transl Med 2020;8(6):297 | http://dx.doi.org/10.21037/atm.2020.03.11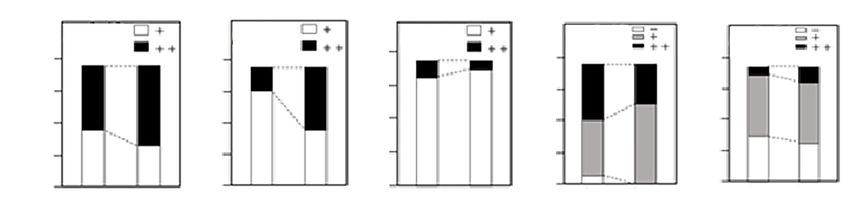
Annals of Translational Medicine, Vol 8, No 6 March 2020                                                                        Page 5 of 11

 Table 2 Patients’ characteristics
 Pt        Age /sex          Location         Histology    IDH mutation   MGMT methylation       TMZ (course)       RT (Gy)     OS (days)

 1           64/M           Rt. parietal          GB           WT                  +                   5              60           311

 2           66/M          Rt. temporal           GB           WT                  −                   14             60           760

 3           66/F           Lt. frontal           AO           Mut                 −                   3              60           755

 4           67/F           Rt. parietal          GB           WT                  −                   1              60           457

 5           80/M           Lt. parietal          GB           WT                  −                   13             56           546

 6           63/M           Lt. frontal           GB           WT                  +                   1              60            72

 7           74/M           Rt. frontal           GB           WT                  −                   11             56           508

 8           67/M           Rt. parietal          GB           WT                  +                   2              60          1,013

 9           61/M           Lt. frontal           GB           WT                  +                   5              60           443

 10          61/M          Lt. temporal           GB           WT                  −                   11             60           943

 11          36/F           Rt. frontal           GB           WT                  +                   17             60          1,142

 12          53/M          Rt. temporal           GB           WT                  −                   1              58          1,136

 13          60/M           Rt. parietal          GB           WT                  +                   6              60           541

 14          67/F          Rt. temporal           GB           WT                  +                   1              60           824

 15          48/F          Lt. temporal           GB           WT                  +                   8              60           603

 Med           64                –                 –            –                  −                   5              60           603

 Mean         62.2               –                 –            –                  −                  6.6            59.3         670.3
 AO, anaplastic oligodendroglioma; F, female; GB, glioblastoma; IDH, isocitrate dehydrogenase; Lt, left; M, male; Med, median; MGMT, O6-
 methylguanine DNA methyltransferase; Mut, mutant; N/A, not available; OS, overall survival; post, post-Stupp regimen tumors; pre, pre-
 Stupp regimen initial tumors; Pt, patient; Rt, right; RT, radiotherapy; TMZ, temozolomide; WT, wild type.

CD8 (+) cells in tumors before vs. after the RT and TMZ                   therapy) between the patients who received ≥10 courses
(CD4: pre, 6.93±6.70/5HPF; post, 7.47±6.08/5HPF,                          (n=5) or ≤9 courses (n=10) of TMZ was evaluated. The
P=0.41; CD8: pre, 9.33±6.95/5HPF; post, 8.07±5.19/5HPF,                   patients who received ≥10 courses of TMZ showed an
P=0.29) (Figure 3A,B).                                                    increase in the number of Foxp3+ cells and a decrease in
                                                                          the number of CD163+ cells in tumors after treatment
                                                                          compared with the patients who received ≤9 courses of
Foxp3 and CD163 expressions
                                                                          TMZ (Foxp3, P=0.071; CD163, P=0.017) (Figure 4). Tumor
The number of Foxp3 (+) cells tended to be increased in                   oxygenation, stemness, expressions of immune checkpoint
tumors after RT and TMZ compared with that observed                       molecules, and CTL infiltration did not vary significantly
before the treatment (pre, 2.53±1.55/5HPF; post,                          according to the number of TMZ courses.
3.6±2.41/5HPF, P=0.082) (Figure 3A,B). There was no                          Case 3 had a diagnosis of the initial and recurrent tumors
difference in the number of CD163 (+) cells in tumors                     of anaplastic oligodendroglioma and GB, respectively;
before vs. after the RT and TMZ (pre, 31.0±16.86/5HPF;                    however, its exclusion from the statistical analyses did not
post, 35.33±18.42/5HPF, P=0.25) (Figure 3A,B).                            alter the results.

Association between the number of TMZ courses and                         Highlights of the changes in TME after Bev administration
the TME
                                                                          Our previous study reported the overall status of the TME,
The percent change from the baseline (pre-RT and TMZ                      including tumor oxygenation and stemness, in surgical

© Annals of Translational Medicine. All rights reserved.              Ann Transl Med 2020;8(6):297 | http://dx.doi.org/10.21037/atm.2020.03.11
Page 6 of 11 Tamura et al. TME following radiation and temozolomide
A Pre-TMZ & RT Post-TMZ & RT Pre-TMZ & RT Post-TMZ & RT
CD34
HE
VEGF-A
HIF-1α
VEGFR1
CA9
VEGFR2
Nestin
B VEGF-A VEGFR1 VEGFR2 HIF-1α CA9
p=0.46 p=0.058 p=0.54 p=0.46 p=0.54
14
14 16 16 16
Number
Number
Number
Number
Number
12 12 12 12 12
8 8 8 8 8
4 4 4 4 4
0 4 0 0 0
Pre Post Pre Post Pre Post Pre Post Pre Post
CD34 Nestin
50 100
40 80
30 60
/5HPF
%
20 40
10 20
p=0.41 p=0.36
0 0
Pre Post Pre Post
Figure 2 Results of immunohistochemical analyses of angiogenesis, hypoxia, and stemness. Photomicrographs (A) and the results of
statistical analyses (B) are shown. Immunohistochemical analyses demonstrate that the expression levels of VEGF-A/VEGFR2, CD34, HIF-
1α, CA9 and nestin are not significantly changed after RT and TMZ therapy. The VEGFR1 expression tends to be upregulated after the
treatment. Original magnification, ×40; scale bar, 100 μm. RT, radiotherapy; TMZ, temozolomide.
© Annals of Translational Medicine. All rights reserved. Ann Transl Med 2020;8(6):297 | http://dx.doi.org/10.21037/atm.2020.03.11Annals of Translational Medicine, Vol 8, No 6 March 2020 Page 7 of 11
A Pre-TMZ & RT Post-TMZ & RT Pre-TMZ & RT Post-TMZ & RT
PD-1
CD4
PD-L1
CD8
Pre-TMZ & RT Post-TMZ & RT
Foxp3
CD163
B CD4 CD8 Foxp3 CD163
20 20 10
p=0.41 p=0.29 p=0.082 60 p=0.25
8
15 15
/5HPF
/5HPF
/5HPF
/5HPF
6 40
10 10
4
20
5 5 2
0 0 0 0
Pre Post Pre Post Pre Post Pre Post
PD-L1
PD-1
10 p=0.66
p=0.39 16
Number
12
/5HPF
5
8
4
0 0
Pre Post
Pre Post
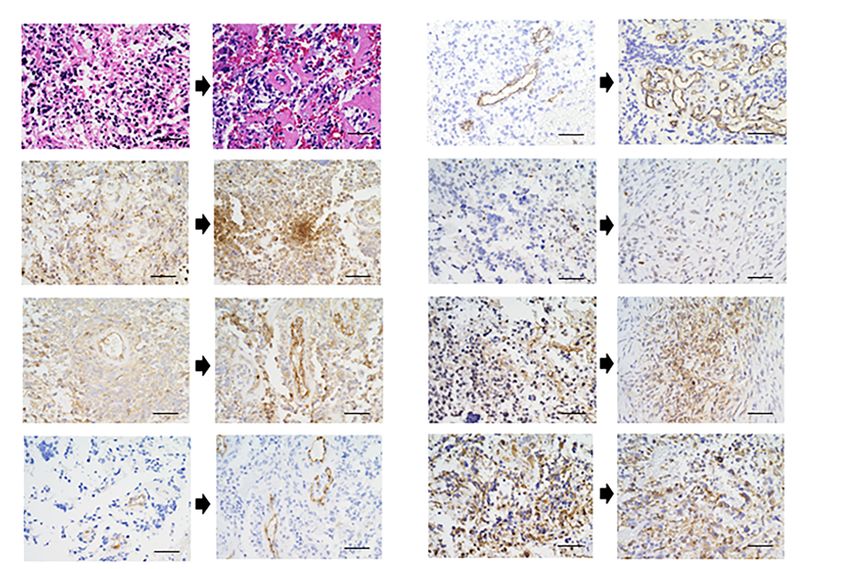
Figure 3 Immunohistochemical analyses of the tumor immune microenvironment. Photomicrographs (A) and the results of statistical analyses
(B) are shown. Immunohistochemical analyses demonstrate that the expression levels of CD4, CD8, CD163, PD-1, and PD-L1 are not
significantly changed after the treatment with RT and TMZ. The number of Foxp3 (+) cells tended to be increased after the treatment. Black
arrow, CD8 (+) lymphocyte, and Foxp3 (+) cells. Original magnification, ×40; scale bar, 100 μm. RT, radiotherapy; TMZ, temozolomide.
© Annals of Translational Medicine. All rights reserved. Ann Transl Med 2020;8(6):297 | http://dx.doi.org/10.21037/atm.2020.03.11Page 8 of 11 Tamura et al. TME following radiation and temozolomide
Foxp3 CD163 Pre-Bev Post- Bev
Percent change from baseline (%)
Percent change from baseline (%)
800 9 courses ≥ 700 9 courses ≥
700 10 courses ≤ 10 courses ≤
600
CD8
600
500
500
400
400
300
300
200 200
Pre Post
100 100
Pre Post
0 0
Foxp3
Figure 4 Percent change in the number of Foxp3 (+) cells and
CD163 (+) cells. The percent change in the number of Foxp3 (+)
cells and CD163 (+) cells from baseline (pre-RT and TMZ) is
shown. The patients who received ≥10 courses of TMZ exhibit
a higher percent change in Foxp3 (+) cells and a lower percent
CD163
change in CD163 (+) cells in post-treatment tumors compared
with that observed in patients who received ≤9 courses of TMZ
(Foxp3, P=0.058; CD163, P=0.021).
specimens obtained from patients with GB who underwent
surgical resection in three different settings: GBs collected
PD-1
before any treatment (naïve GBs); GBs that were resected
following Bev therapy (under the control of Bev); and
recurrent GBs that were resected after long-term Bev
therapy (Bev failure). In that study, Bev downregulated
the expression of the PD-1/ PD-L1 immune checkpoint
PD-L1
molecules, suppressed the infiltration of Tregs and TAMs,
and increased CTL infiltration (5). The highlights of the
changes in TME after the Bev administration (Bev failure)
are shown using the original images in Figure 5.
Figure 5 Highlights of the changes in the tumor-immune
microenvironment after the administration of bevacizumab. Our
Discussion previous study (9) reported the overall status of the TME after
In the present study, the expression levels of CD34, bevacizumab administration. Highlights of the changes in tumor-
VEGF-A, VEGFR2, HIF-1α, CA9, nestin, CD4, CD8, immune microenvironment are shown. Original magnification,
CD163, PD-1, and PD-L1 did not change significantly ×40; scale bar, 100 μm.
after RT and TMZ therapy (Table 1). The expression level
of VEGFR1 and the number of Foxp3 (+) cells tended to be
upregulated and increased after the treatment, respectively. the RT and TMZ on tumor vascularity was supposed to be
Therefore, these results strongly support the hypothesis limited in animal models compared with that of Bev (10),
that Bev induces an immunosupportive microenvironment, whereas the continuous administration of low-dose TMZ
as described previously (5). (metronomic chemotherapy) reduced the MVD of recurrent
Although alterations in the TME during chemotherapies, GBs (11). In the present study, although MVD was not
such as those that use carboplatin, cisplatin, and significantly increased after RT and TMZ, the expression
cyclophosphamide, have been previously reported, very few of VEGFR1 tended to be upregulated, which might be
studies examined the changes in tumor angiogenesis and associated with the abnormal vascular structure. A gradual
TME after treatment with RT and TMZ (2). The effect of deficit of pericyte is associated with blood-brain barrier
© Annals of Translational Medicine. All rights reserved. Ann Transl Med 2020;8(6):297 | http://dx.doi.org/10.21037/atm.2020.03.11Annals of Translational Medicine, Vol 8, No 6 March 2020 Page 9 of 11
(BBB) leakage, leading to severe vasogenic brain edema (12). yielded synergistic effects on the CT26 mouse model of
The changes in vascular structure observed after RT and colorectal cancer (9). In particular, the status of Tregs
TMZ therapy must be evaluated using the present paired exhibited dynamic changes after the treatment with
pre- and post-treatment samples. VEGF/VEGFR-targeted agents. VEGF/VEGFR-targeted
Regarding immunomodulatory effects, RT and TMZ therapies, such as Bev, sorafenib, and sunitinib, reduce the
therapy might even worsen the immunosuppressive TME population of Tregs in the peripheral blood and tumor
in GBs. A previous study demonstrated that the number tissues in GBs, metastatic colorectal cancer, hepatocellular
of Tregs increased rapidly during long-term TMZ therapy carcinoma, and renal cell carcinoma (19,20). However, the
in GBs, which is known as the rebound phenomenon (13). status of the TME is highly controversial in the recurrent
The present study also demonstrated that the patients stage, after anti-angiogenic therapy. Tregs are increased in
who received ≥10 courses of TMZ showed a higher the peripheral blood of patients with recurrent GBs after
percent change in Foxp3 (+) cells in post-treatment tumors resistance to VEGFR inhibitors (21). The upregulation of
compared with that observed in patients who received ≤9 PD-1 on CD4 (+) and CD8 (+) T cells was also reported
courses of TMZ. In contrast, our previous study revealed in patients with GBs or metastatic renal cell carcinoma
that the number of Foxp3 (+) cells was decreased when Bev refractory to VEGFR-targeted therapy (21). The reason
was co-administered with RT and TMZ, despite the long- why the status of TME in the recurrent stage after anti-
term administration of adjuvant TMZ (5). Furthermore, angiogenic therapy is controversial, which may be caused
other studies showed that the number of Tregs was not by the difference of analyzed samples between systemic
increased when TMZ was co-administered with immune- circulation (peripheral blood) and local lesion (tumor
modulatory agents, such as vaccination and interleukin-2 specimens), in addition to the difference in the target of
(14,15). It may be difficult to understand the alteration of inhibitors. Tada et al. suggested that analyses of lymphocytes
TME after the numerous combinational treatments. The and other immune cells using tumor specimens are more
expression of PD-1 was increased in recurrent GBs after important than analyses of peripheral blood for the
RT and TMZ, which was associated with a shorter survival investigation of cancer immunology (22). Although most
after recurrence (16). In the present study, the expressions previous studies used peripheral blood mononuclear cells,
of PD-1/PD-L1 were not upregulated in tumors after RT studies using tumor specimens obtained surgically before
and TMZ compared with that observed in pre-treatment and after treatment are considered to be a powerful tool
tumors. Further analysis is needed to confirm the changes to investigate the biological effects of targeted therapies.
in immune checkpoint molecules after the treatment. Comparative analyses of tumor samples and peripheral
Immunosuppressive TAMs in the peripheral blood were blood may be required for monitoring immunosuppressive
reported to be upregulated in the recurrent GBs after RT and cells and molecules. Furthermore, the response rate of
TMZ (17). Interestingly, in the present study, the TAM status targeted therapies also contributes to changes of the TME.
differed from the TMZ courses. Long-term administration For example, Tregs, PD-L1 and TAMs are upregulated in
of TMZ might sustain the status of TAMs, without patients with metastatic renal cell carcinoma who exhibit a
their dramatic decrease, which was observed after Bev partial response (23). Further investigations are required to
administration. Furthermore, macrophages express different determine the differences in therapeutic actions based on
functional programs in response to microenvironmental the response, dosage and duration of TMZ therapy.
signals, which was termed M1/M2 polarization (18). Changes A limitation of the present study was the paucity of
in M1 macrophages must be also examined to confirm the the number of paired tissues from the same patients due
overall status of macrophages after RT and TMZ. to the relative rarity of salvage surgery for recurrent GBs
In contrast to TMZ, VEGF/VEGFR-targeted agents following failure of the RT and TMZ. Studies using a larger
promote an immunosupportive TME (9). This finding number of patients are warranted to confirm and generalize
was compatible with the results of our previous study (5). the findings of the present study.
The previous study demonstrated that VEGF-A produced
by the tumor enhances the expression of inhibitory
Conclusions
immune checkpoints, thus mediating T-cell exhaustion on
intratumoral CD8 (+) T cells. Therefore, a combinational This was the first study to show the alterations of the TME
approach using anti-VEGF-A and anti-PD-1 antibodies following RT and TMZ therapy using paired pre- and post-
© Annals of Translational Medicine. All rights reserved. Ann Transl Med 2020;8(6):297 | http://dx.doi.org/10.21037/atm.2020.03.11Page 10 of 11 Tamura et al. TME following radiation and temozolomide
treatment samples. The RT and TMZ standard therapy
did not yield an immunosupportive effect in patients with 1. Polyak K, Haviv I, Campbell IG. Co-evolution of
malignant glioma. tumor cells and their microenvironment. Trends Genet
2009;25:30-8.
2. Tamura R, Tanaka T, Akasaki Y, et al. The role of
Acknowledgments
vascular endothelial growth factor in the hypoxic and
The authors greatly thank Ms. Naoko Tsuzuki at the immunosuppressive tumor microenvironment: perspectives
Department of Neurosurgery, Keio University School for therapeutic implications. Med Oncol 2019;37:2.
of Medicine and Ms. Eri Honzawa at the Division of 3. Gabrilovich DI, Ostrand-Rosenberg S, Bronte V.
Diagnostic Pathology, Jikei University School of Medicine Coordinated regulation of myeloid cells by tumours. Nat
Kashiwa Hospital, for technical assistance with laboratory Rev Immunol 2012;12:253-68.
work and sample preparation. 4. Ohm JE, Gabrilovich DI, Sempowski GD, et al. VEGF
Funding: This study was supported by the Ministry of inhibits T-cell development and may contribute to tumor-
Education, Culture, Sports, Science and Technology and the induced immune suppression. Blood 2003;101:4878-86.
Japan Society for the Promotion of Science (KAKENHI), 5. Tamura R, Tanaka T, Ohara K, et al. Persistent
Grant/Award Number: 18J21382. restoration to the immunosupportive tumor
microenvironment in glioblastoma by bevacizumab.
Cancer Sci. 2019;110:499-508.
Footnote
6. Stupp R, Mason WP, van den Bent MJ, et al. Radiotherapy
Conflicts of Interest: TT serves as an unpaid editorial board plus concomitant and adjuvant temozolomide for
member of Annals of Translational Medicine from Dec 2019 glioblastoma. N Engl J Med. 2005;352:987-96.
to Nov 2021. The other authors have no conflicts of interest 7. Tamura R, Tanaka T, Miyake K. Histopathological
to declare. investigation of glioblastomas resected under bevacizumab
treatment. Oncotarget. 2016;7:52423-35.
Ethical Statement: The authors are accountable for all 8. Yamamoto Y, Tamura R, Tanaka T, et al. "Paradoxical"
aspects of the work in ensuring that questions related findings of tumor vascularity and oxygenation in recurrent
to the accuracy or integrity of any part of the work are glioblastomas refractory to bevacizumab. Oncotarget
appropriately investigated and resolved. All procedures 2017;8:103890-9.
in the present study were in accordance with the ethical 9. Voron T, Colussi O, Marcheteau E, et al. VEGF-A
standards of the institutional and/or national research modulates expression of inhibitory checkpoints on CD8+
committee and with the 1964 Helsinki declaration and its T cells in tumors. J Exp Med 2015;212:139-48.
later amendments or comparable ethical standards. This 10. Grossman R, Brastianos H, Blakeley JO, et al.
study was approved by the Institutional Review Board of Combination of anti-VEGF therapy and temozolomide
Keio University School of Medicine and Jikei University in two experimental human glioma models. J Neurooncol
Kashiwa Hospital (Reference number: 20050002 and 26- 2014;116;59-65.
334). Written consent was obtained from all patients. 11. Woo JY, Yang SH, Lee YS, et al. Continuous low-dose
temozolomide chemotherapy and microvessel density
Open Access Statement: This is an Open Access article in recurrent glioblastoma. J Korean Neurosurg Soc
distributed in accordance with the Creative Commons 2015;58;426-31.
Attribution-NonCommercial-NoDerivs 4.0 International 12. Dubois LG, Campanati L, Righy C. Gliomas and the
License (CC BY-NC-ND 4.0), which permits the non- vascular fragility of the blood brain barrier. Front Cell
commercial replication and distribution of the article with Neurosci 2014;12;8:418.
the strict proviso that no changes or edits are made and the 13. Batich KA, Reap EA, Archer GE, et al. Long-term Survival
original work is properly cited (including links to both the in Glioblastoma with Cytomegalovirus pp65-Targeted
formal publication through the relevant DOI and the license). Vaccination. Clin Cancer Res. 2017;23:1898-909.
See: https://creativecommons.org/licenses/by-nc-nd/4.0/. 14. Mitchell DA, Cui X, Schmittling RJ, et al. Monoclonal
antibody blockade of IL-2 receptor during lymphopenia
selectively depletes regulatory T cells in mice and humans.
References
© Annals of Translational Medicine. All rights reserved. Ann Transl Med 2020;8(6):297 | http://dx.doi.org/10.21037/atm.2020.03.11Annals of Translational Medicine, Vol 8, No 6 March 2020 Page 11 of 11
Blood. 2011;118:3003-12. antiangiogenic therapy in metastatic renal cancer patients.
15. Sampson JH, Schmittling RJ, Archer GE, et al. A pilot J Immunother 2010;33:991-8.
study of IL-2Rα blockade during lymphopenia depletes 20. Desar IME, Jacobs JH, Hulsbergen-vandeKaa CA, et al.
regulatory T-cells and correlates with enhanced immunity Sorafenib reduces the percentage of tumour infiltrating
in patients with glioblastoma. PLoS One 2012;7:e31046. regulatory T cells in renal cell carcinoma patients. Int J
16. Miyazaki T, Ishikawa E, Matsuda M, et al. Assessment Cancer 2011;129:507-12.
of PD-1 positive cells on initial and secondary resected 21. Du Four S, Maenhout SK, Benteyn D, et al. Disease
tumor specimens of newly diagnosed glioblastoma and progression in recurrent glioblastoma patients treated with
its implications on patient outcome. J Neurooncol. the VEGFR inhibitor axitinib is associated with increased
2017;133:277-85. regulatory T cell numbers and T cell exhaustion. Cancer
17. Lu-Emerson C, Snuderl M, Kirkpatrick ND, et Immunol Immunother 2016;65:727-40.
al. Increase in tumor-associated macrophages after 22. Tada Y, Togashi Y, Kotani D, et al. Targeting VEGFR2
antiangiogenic therapy is associated with poor survival with Ramucirumab strongly impacts effector/ activated
among patients with recurrent glioblastoma. Neuro Oncol regulatory T cells and CD8+ T cells in the tumor
2013;15;1079-87. microenvironment. J Immunother Cancer 2018;6:106.
18. Tamura R, Tanaka T, Yamamoto Y, et al. Dual role 23. Wallin JJ, Bendell JC, Funke R, et al. Atezolizumab in
of macrophage in tumor immunity. Immunotherapy combination with bevacizumab enhances antigen-specific
2018;10:899-909. T-cell migration in metastatic renal cell carcinoma. Nat
19. Adotevi O, Pere H, Ravel P, et al. A decrease of regulatory Commun 2016;7:12624.
T cells correlates with overall survival after sunitinib-based
Cite this article as: Tamura R, Tanaka T, Morimoto Y,
Kuranari Y, Yamamoto Y, Takei J, Murayama Y, Yoshida K,
Sasaki H. Alterations of the tumor microenvironment in
glioblastoma following radiation and temozolomide with or
without bevacizumab. Ann Transl Med 2020;8(6):297. doi:
10.21037/atm.2020.03.11
© Annals of Translational Medicine. All rights reserved. Ann Transl Med 2020;8(6):297 | http://dx.doi.org/10.21037/atm.2020.03.11You can also read