Check dam identification using multisource data and their effects on streamflow and sediment load in a Chinese Loess Plateau catchment
←
→
Page content transcription
If your browser does not render page correctly, please read the page content below
Check dam identification using
                multisource data and their effects on
                streamflow and sediment load in a
                Chinese Loess Plateau catchment

                Peng Tian
                Guangju Zhao
                Xingmin Mu
                Fei Wang
                Peng Gao
                Zhijuan Mi

Downloaded From: https://www.spiedigitallibrary.org/journals/Journal-of-Applied-Remote-Sensing on 25 Sep 2021
Terms of Use: https://www.spiedigitallibrary.org/terms-of-use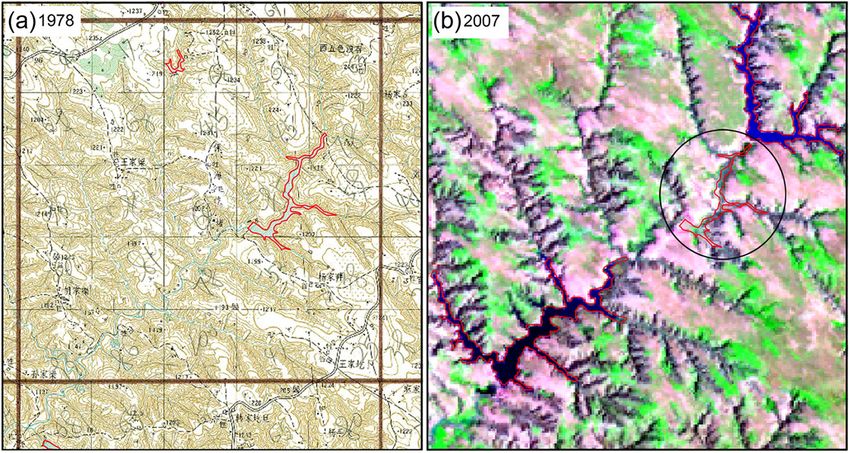
Check dam identification using multisource data and
                                   their effects on streamflow and sediment load in a
                                             Chinese Loess Plateau catchment

                                            Peng Tian,a Guangju Zhao,b,c Xingmin Mu,b,c Fei Wang,b,c
                                                         Peng Gao,b,c and Zhijuan Mid
                                    a
                                      Northwest A&F University, College of Resources and Environment, Yangling 712100,
                                                                    Shaanxi Province, China
                                    b
                                      Northwest A&F University, Institute of Soil and Water Conservation, 26 Xinong Road,
                                                           Yangling 712100, Shaanxi Province, China
                                                                     gjzhao@ms.iswc.ac.cn
                                 c
                                   Chinese Academy of Sciences and Ministry of Water Resources, Institute of Soil and Water
                                           Conservation, 26 Xinong Road, Yangling 712100, Shaanxi Province, China
                                    d
                                     Northwest A&F University, College of Water Resources and Architectural Engineering,
                                                           Yangling 712100, Shaanxi Province, China

                                 Abstract. During the recent six decades, numerous check dams have been constructed for soil
                                 erosion control and agricultural production, and have become the key measure for soil and water
                                 conservation in the Loess Plateau. Obtaining check dam information is very important for soil
                                 erosion control and river basin management. This study utilizes remote-sensing images in con-
                                 junction with Google Earth images and field survey to derive the spatial distribution of the check
                                 dams in the Huangfuchuan catchment. Multisource data including topographic maps, Landsat
                                 images, and images from Google Earth are collected for check dam identification. The results are
                                 verified based on a field survey. The water surface area of the check dams derives from in situ
                                 measurement and images present good relationship with the high correlation coefficient of 0.96.
                                 Furthermore, the area extent and number of check dams derived from the remote sensing images
                                 are similar to those from Google Earth images. Historically, an increase in the check dam num-
                                 ber, controlled area, and storage capacity indicate their substantial trapping effects on streamflow
                                 and sediment load in the Huangfuchuan catchment. This study may be a good reference for
                                 proposing an efficient approach to identify the check dams and provide decision supports
                                 for soil and water conservation in the Loess Plateau. © The Authors. Published by SPIE under a
                                 Creative Commons Attribution 3.0 Unported License. Distribution or reproduction of this work in
                                 whole or in part requires full attribution of the original publication, including its DOI. [DOI: 10
                                 .1117/1.JRS.7.073697]

                                 Keywords: check dams; multisource data; storage capacity; streamflow; sediment load;
                                 Huangfuchuan watershed.
                                 Paper 13092 received Mar. 24, 2013; revised manuscript received Aug. 17, 2013; accepted for
                                 publication Aug. 27, 2013; published online Sep. 24, 2013.

                                 1 Introduction
                                 Check dams are the most widely applied engineering structures for soil and water conservation in
                                 the erodible regions. In the gully-dominated regions, check dams have been widely constructed
                                 for retaining floodwater, intercepting soil sediment, improving gully slope stabilities, and
                                 increasing farmlands. At the beginning of construction, a water body similar to a small reservoir
                                 usually existed behind the check dam. Gradually, fertile cropland formed for grain production in
                                 the region, where a water body was filled by sediment deposition.1
                                     Unlike reservoirs, check dams are not common around the world. It has only been reported
                                 that check dams were implemented for soil erosion control in some countries and regions, such
                                 as France, Italy, Spain, China, etc.2,3 The majority of research on check dams has been conducted
                                 to investigate their impacts on geomorphology, channel morphology, river bed stability, and

                                 Journal of Applied Remote Sensing                    073697-1                           Vol. 7, 2013

Downloaded From: https://www.spiedigitallibrary.org/journals/Journal-of-Applied-Remote-Sensing on 25 Sep 2021
Terms of Use: https://www.spiedigitallibrary.org/terms-of-use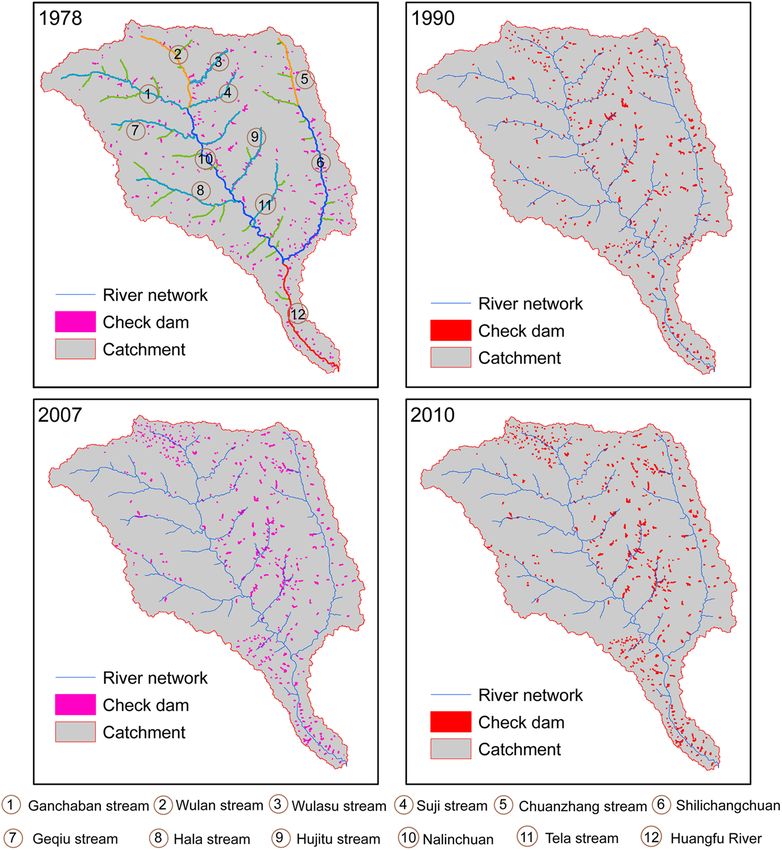
Tian et al.: Check dam identification using multisource data and their effects on streamflow. . .

                                 sediment yield through both field measurement and numerical simulation. It has been concluded
                                 that the check dams captured sediments and led to a decrease in the longitudinal gradient
                                 upstream, but accelerated downstream erosion because of the increased flow transport capacity
                                 and scour processes.1,4,5 Bombino et al.6 addressed statistically significant differences in channel
                                 form, sediment, and vegetation among the upper, the lower reaches, and the intermediate sec-
                                 tions of check dams in Southern Italian catchment. A reducing rate of 77% sediment yield by
                                 check dams has been reported by Boix-Fayos et al.2 in the Rogativa catchment of SE Spain. Ran
                                 et al.7 analyzed the coarse sediment retention by check dams in five typical catchments in the
                                 midstream of the Yellow River, and found that the average sediment reduction ratio could reach
                                 60% when the check dams area accounted for more than 3% of the drainage area.
                                     In Chinese Loess Plateau, check dams have attractive advantages because of unique envi-
                                 ronmental settings and regional food supply needs.5,8,9 For >400 years, check dams have been
                                 constructed for soil erosion control and agricultural production improvement. The check dams
                                 have become one of the most effective strategies for soil erosion control in the Loess Plateau.
                                 Especially during the recent six decades, thousands of check dams have been constructed in the
                                 region. By 2005, >120;000 check dams have been built on the Loess Plateau over the past
                                 50 years and approximately 21 billion m3 of sediments have been captured by these dams.10
                                 Although considerable studies have been conducted as mentioned above, the locations, storage
                                 capacities, and outflow methods have not been inventoried and documented. Thus, further under-
                                 standing the mechanisms on the hydrological effects of check dams was impossible.
                                     Traditionally, check dams and their storage capacity are estimated by using the topographic
                                 maps according to the in situ hydrographic survey with an electronic planimeter.11 However, this
                                 approach is usually laborious, costly, and time consuming. Advances in remote sensing, geo-
                                 graphic information systems, and computer technology have made satellite images convenient
                                 and less expensive for reservoir or dam measurement and monitoring.12,13 Remote-sensing
                                 images provide invaluable and timely information on spatial distribution, spectral and temporal
                                 attributes for reservoirs, and dam operation and management.14,15 However, research on check
                                 dam identification and quantitative estimation of storage capacities by means of remote-sensing
                                 images are very rare.16,17 The few studies available mainly focused on individual reservoirs or a
                                 rather small watershed and as a result, only some tentative applications have been reported.18
                                     To better understand the potential effects of check dams on hydrological processes and sediment
                                 yield at catchment scale, an accurate estimation of the check dam distribution and their storage
                                 volume becomes very important and necessary. The objectives of this study, therefore, were:
                                      1. to identify the check dams in a Loess Plateau catchment by making use of multi-
                                         source data;
                                      2. to quantify the actual storage capacity of the check dams through established empirical
                                         relationships; and
                                      3. to analyze the impacts of check dams on streamflow and sediment load in combination
                                         with recently observed dataset.

                                 2 Study Area and Data

                                 2.1 Study Area
                                 The study area, Huangfuchuan catchment, is one of the most severe soil erosion areas with the
                                 average annual sediment modulus higher than 17; 000 ton∕km2 (1955 to 2000). The
                                 Huangfuchuan River is a first-order tributary of the midstream Yellow River, located in the
                                 wind-water erosion criss-cross region. The river originates from the eastern part of the
                                 Ordos Plateau, flows through the transitional zone of the Loess Plateau and Inner Mongolia
                                 grassland, and empties into the main stream of the Yellow River in Fugu County of Shaanxi
                                 Province (Fig. 1). The Huangfuchuan catchment covers an area of 3246 km2 consisting of
                                 two subtributaries: Nalin River and Changchuan River. The main stream of the
                                 Huangfuchuan River is 137 km long with an average channel slope of 2.7%. The watershed
                                 is located in the transitional belt of warm temperate and mesothermal zones with the average

                                 Journal of Applied Remote Sensing                    073697-2                                    Vol. 7, 2013

Downloaded From: https://www.spiedigitallibrary.org/journals/Journal-of-Applied-Remote-Sensing on 25 Sep 2021
Terms of Use: https://www.spiedigitallibrary.org/terms-of-use
Tian et al.: Check dam identification using multisource data and their effects on streamflow. . .

                                                 Fig. 1 Location of the study area and hydro-meteorological stations.

                                 annual precipitation of about 380 mm, influenced by southeast monsoon in summer, and char-
                                 acterized by semi-arid continental climate.19 Frequently occurring floods in July and August
                                 often cause tremendous soil erosion in the catchment. Average annual discharge and sediment
                                 load are 1.269 × 10⁸ m3 and 0.408 × 10⁸ ton, respectively, between 1955 and 2010, nearly 80%
                                 of which is concentrated in the rainy season from June to September.
                                     The catchment can be described as “hilly and gully” landscape, and the land surface material
                                 is dominated by weathering sandstone, silty loess, and desert sand with coarser particles.
                                 According to the soil erosion type, the basin can be divided into three subregions: (1) loess
                                 hilly–gully region with an area of 918.3 km2 , mainly located in the eastern and southwestern
                                 parts of the watershed; (2) the sandy loess hilly–gully region with an area of 546.1 km2 , located
                                 between Nalin and Changchuan tributaries; and (3) the sandstone weathering hilly–gully region
                                 with an area of 1781.6 km2 , located in the northwestern part of the catchment. Due to the
                                 extremely high gully density and soil erosion rates, check dams have become the dominant
                                 soil and water conservation measures in the Huangfuchuan catchment. By 2010, approximately
                                 70% of the area in the Huangfuchuan watershed was controlled by check dams.

                                 2.2 Available Data
                                 The data used in this study were collected from topographic maps (1978), Landsat images (1990,
                                 2007), and images acquired in 2010 from Google Earth. Table 1 lists all the available datasets
                                 and sources. In total, we collected 28 topographic maps with the resolution of 1:50,000 from
                                 Bureau of Survey and Mapping Shaanxi Province. The images were downloaded from the
                                 Landsat imagery database.20 The coverage of an individual Landsat TM image is
                                 185 × 185 km2 . The resolution for bands 1 to 5 and 7 is 30 m, while it is 120 m for band

                                                   Table 1 Summary of the processed maps and Landsat images.

                                 Data                      Resolution         Path/row             Date                    Sources

                                                                                                                Bureau of Survey and Mapping
                                 Topography map            1∶50; 000                               1978               Shaanxi Province

                                 Landsat 5                 30 m               127 to 33         11/09/1989      http://earthexplorer.usgs.gov
                                 Landsat 5                 30 m               127 to 32         13/08/1990

                                 Landsat 5                 30 m               127 to 32         10/09/2006

                                 Landsat 5                 30 m               127 to 33         25/09/2007

                                 Google Earth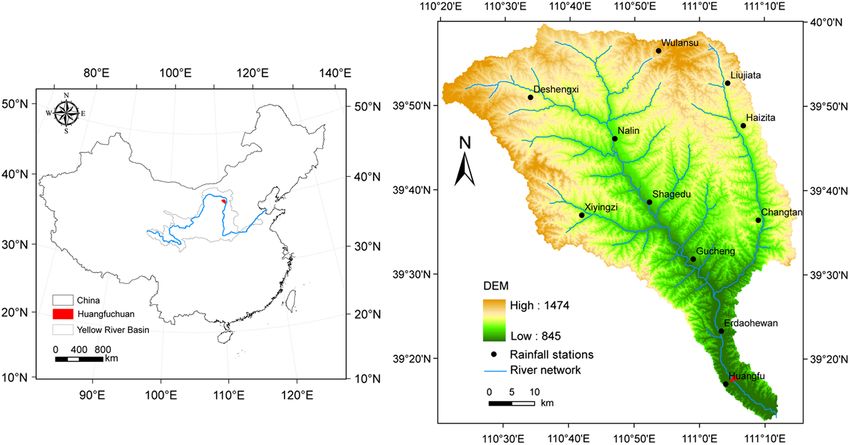
Tian et al.: Check dam identification using multisource data and their effects on streamflow. . .

                                 6. Cloud free (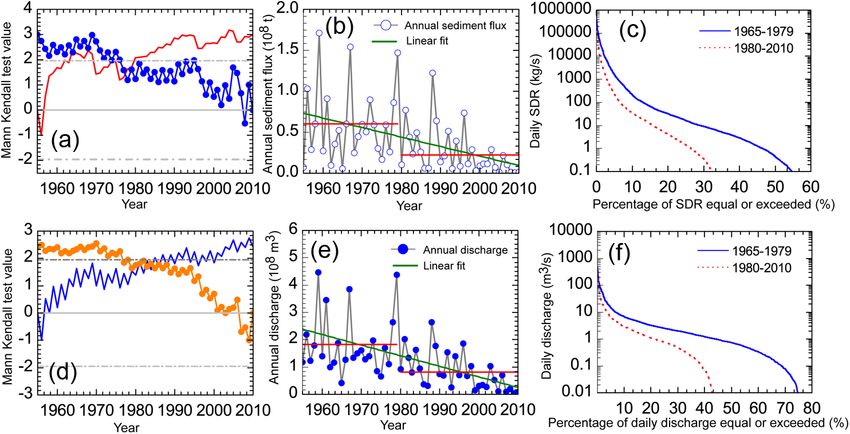
Tian et al.: Check dam identification using multisource data and their effects on streamflow. . .

                                 3.2 Storage Capacity Estimation
                                 If reservoirs or check dams can be assumed to approximate the shape of a square pyramid diago-
                                 nally cut in half,15,21,24 an empirical relationship between the storage capacity and its area can be
                                 expressed as
                                                                              V ¼ a × Areab ;                                      (3)

                                 where V is the check dams’ storage capacity, Area is its water surface area, and a and b are the
                                 constants to be determined. If reservoirs are indeed exactly half pyramids, then b ¼ 1.5. When
                                 the slopes are more convex (rare), the constant b is >1.5. In most cases of concave slopes, the
                                 value of b is
Tian et al.: Check dam identification using multisource data and their effects on streamflow. . .
Fig. 3 Examples of check dam identification through topography map and images: (a) 1978 and
(b) 2007.
precipitation in different seasons. For example, a minority of the check dams were dried up in
May 2012, but there was a large area of water in October due to heavy storms in July.
4.2 Storage Capacity Estimation in the Catchment
In total, datasets of 74 check dams with spatial distribution, built date, storage capacities, and
dike height were provided by the Yellow River Basin Committee. By representing various check
dams with different storage capacities, these check dams were employed to develop the relation-
ship between the water surface area and the storage capacity. As shown in Fig. 4, we investigated
the relationship between the storage capacity and the water surface area as well as the dam-
controlled area. The results indicate relatively good power relationship between the water surface
area and the storage capacity, and logarithmic relationship between check dam controlled area
and storage capacity. In contrast, Fig. 4(a) confirmed that the power equation represents a better
relationship between check dam water surface area and storage capacity [Fig. 4(b)]. Thus, an
empirical equation for calculating the check dams’ storage is
V ¼ 39.306 × Area0.712 : (4)
Equation (4) was applied to estimate the storage capacity of each check dam, and the
total storage capacity was estimated by summing all individual check dams’ storage together
(Table 3). The total storage capacities in the Huangfuchuan catchment have increased from
2.65 × 10⁸ m3 (1978) to 4.11 × 10⁸ m3 (2010), and the average storage capacity for the
check dams is nearly 7.25 × 10⁵ m3. The estimated errors for storage capacities mainly result
from the spatial heterogeneities in geometric shape and extracted water surface area. Ran and
Lu21 addressed that each different geometric shape requires a unique parameterization to pre-
cisely calculate its storage capacity. In addition, the over- or underestimated water surface area
may lead to misestimation of storage capacity for the check dams. However, compared with
traditional field survey approach, the proposed method in this study was useful, efficient,
and less expensive, and the estimation accuracy is satisfactory.
4.3 Historical Dynamics of Check Dams
Figure 5 shows historical dynamics of check dams derived from topographic maps (1978),
Landsat images (1990 and 2007), and images of Google Earth in 2010. The results indicate
that a general increase for the number of check dams can be clearly seen in the
Huangfuchuan catchment. As well, the spatial distribution indicates that most of the check
Journal of Applied Remote Sensing 073697-6 Vol. 7, 2013
Downloaded From: https://www.spiedigitallibrary.org/journals/Journal-of-Applied-Remote-Sensing on 25 Sep 2021
Terms of Use: https://www.spiedigitallibrary.org/terms-of-useTian et al.: Check dam identification using multisource data and their effects on streamflow. . .
Table 2 Comparison of water body area in check dams derived from images and field
measurements.
ID Longitude Latitude AreaGPS (ha) AreaSat (ha) DAI (%) NDAI (%) Storage (104 m3 ) Built date
1 39.961 110.973 5.006 5.026 −0.40 −0.20 143.4 1993
2 39.904 110.966 5.552 5.578 −0.46 −0.23 68.4 1987
3 39.895 110.993 0.436 0.419 3.92 2.00 9.26 2004
4 39.887 110.996 0.135 0.140 −3.71 −1.82 9.26 2004
5 39.875 111.007 0.480 0.478 0.46 0.23 73.8 1987
6 39.876 111.026 1.191 1.215 −1.95 −0.96 20.34 2004
7 39.862 111.088 1.275 1.374 −7.76 −3.73 156.7 1989
8 39.900 111.072 8.644 8.491 1.78 0.90 130.6 1993
9 39.913 111.059 2.339 2.411 −3.09 −1.52 70 1988
10 39.731 110.931 11.851 12.181 −2.78 −1.37 204.9 1990
11 39.722 110.901 1.567 1.529 2.40 1.21 74 1997
12 39.622 111.183 4.699 4.801 −2.16 −1.07 194.5 1992
13 39.599 111.005 3.365 3.550 −5.49 −2.67 167.55 1977
14 39.945 110.638 13.003 12.425 4.45 2.27 92.77 2005
15 39.953 110.606 3.414 3.106 9.03 4.73 89.8 2005
16 39.713 110.884 8.644 8.261 4.43 2.27 285 2001
17 39.692 110.943 7.617 8.283 −8.73 −4.18 204.99 1989
18 39.683 110.963 1.821 1.911 −4.97 −2.42 266 1990
19 39.632 110.895 2.183 2.215 −1.45 −0.72 237.84 1993
20 39.728 110.969 7.124 6.599 7.38 3.83 105.7 1994
21 39.736 110.858 2.163 2.311 −6.81 −3.29 302.2 1990
22 39.736 110.974 2.219 2.434 −9.69 −4.62 60.57 1992
23 39.948 110.797 17.473 15.330 12.27 6.53 673.97 2001
24 39.871 111.057 3.947 3.871 1.93 0.97 134.18 2005
25 39.900 111.076 3.789 3.985 −5.17 −2.52 86.3 1987
dams lie in the eastern part of the watershed. Taking the map of 2007, e.g., check dam density in
the Wulan stream, Hujitu stream, and Tela stream show evident increasing trends. In 1978, there
were only 16 check dams in the Wulan stream, while it had reached 118 in 2007
(Fig. 5).
Table 3 summarizes statistics of the check dams derived from multisource data in the
Huangfuchuan catchment. By 1978, there were 390 check dams built in the Huangfuchuan
catchment, with the water surface area of 10.76 km2 . The dam-controlled area was
1226.56 km2 , accounting for about one third of the whole catchment. By 2010, the number
of check dams had reached 567, and the dam-controlled area was 2216.47 km2 . This is con-
sistent with the field survey data reported by the Hydrology Bureau of the Yellow River
Water Resources Commission. Minor discrepancies were detected between Jiao et al.25 and
our estimation. They addressed that 392 major check dams had been constructed until 1992
Journal of Applied Remote Sensing 073697-7 Vol. 7, 2013
Downloaded From: https://www.spiedigitallibrary.org/journals/Journal-of-Applied-Remote-Sensing on 25 Sep 2021
Terms of Use: https://www.spiedigitallibrary.org/terms-of-useTian et al.: Check dam identification using multisource data and their effects on streamflow. . .
Fig. 4 Relationship between the estimated area and check dam storage. (a) power relation
between dams' volume and area, (b) logarithm relation between dams' volume and controlled
area.
Table 3 Statistics of check dams in the Huangfuchuan watershed from 1978 to 2010.
Period 1978 1990 2007 2010
Number of check dams 390 445 504 567
Water surface area (km2 ) 10.76 14.06 16.12 17.78
Dams controlled area (km2 ) 1226.56 1531.61 1925.84 2216.47
Total storage capacity (108 m3 ) 2.65 3.44 4.06 4.11
in the Huangfuchuan catchment, and approximately 1.07 × 10⁸ m3 sediment had been trapped
behind the check dams.
5 Discussion
5.1 Potential Impacts of Check Dams on Streamflow and Sediment Load
Figure 6 shows temporal trends of discharge and sediment load at Huangfu station. The abrupt
changes were detected in 1979 for both streamflow and sediment load by the sequential Mann–
Kendall test.26,27 Simple linear trend analysis indicates that the time series presents a significant
downward trend within the confidence level of 95%. Average decreasing rates of 0.04 × 10⁸ m3
and 0.01 × 10⁸ ton are estimated in streamflow and sediment load, respectively. Average annual
streamflow at Huangfu station was 0.82 × 10⁸ m3 (1980 to 2010), accounting for only 44.8% of
that during 1955 to 1979. Mean annual sediment load decreased from 0.6 × 10⁸ ton (1955 to
1979) to 0.22 × 10⁸ ton (1980 to 2010). Considerable evidence exists that check dams’ construc-
tion was responsible for the significant reduction in both streamflow and sediment load.8,10 Ran28
addressed that streamflow reduced by soil and water conservation measures ranged from 0.14 to
0.53 × 10⁸ m3 from 1970 to 1996. Average annual reducing rates for sediment load lay in the
range of 5.4 to 23.6 Mt. Among these, check dams are the dominant factors retaining discharge
and sediment in the watershed.29 Furthermore, sediment trapped by the check dams accounted
for >60% of the total reduced sediment load in the Huangfuchuan catchment.
To better understand the impacts of check dams on streamflow and sediment load, the hydro-
logical time series at Huangfu station were divided into two periods (1955 to 1979 and 1980 to
2010) by the Mann–Kendall test method. A referenced period from 1955 to 1979 was assumed to
be the period without intensive human influences on the hydrological process and the changing
period was between 1980 and 2010, which was highly affected by human activities. Figures 6(c)
and 6(f) show the daily flow duration curves within two different periods. The magnitude of the
daily flow generally decreased during the changing period compared with the referenced period.
Journal of Applied Remote Sensing 073697-8 Vol. 7, 2013
Downloaded From: https://www.spiedigitallibrary.org/journals/Journal-of-Applied-Remote-Sensing on 25 Sep 2021
Terms of Use: https://www.spiedigitallibrary.org/terms-of-useTian et al.: Check dam identification using multisource data and their effects on streamflow. . .
Fig. 5 Historical dynamics of check dams in the Huangfuchuan watershed.
Fig. 6 Changes of discharge and sediment load at Huangfu station from 1955 to 2010. (a, d) MK
test for annual sediment load and streamflow, (b, e) linear trends for annual sediment load and
streamflow, (c, f) flow duration curve for daily SDR and discharge.
Journal of Applied Remote Sensing 073697-9 Vol. 7, 2013
Downloaded From: https://www.spiedigitallibrary.org/journals/Journal-of-Applied-Remote-Sensing on 25 Sep 2021
Terms of Use: https://www.spiedigitallibrary.org/terms-of-useTian et al.: Check dam identification using multisource data and their effects on streamflow. . .
Table 4 Sediment particle sizes during July and August at Huangfu station.
Mean sediment load 0.05 mm Median Mean
Periods (104 ton) (%) (%) (%) (Ref. 29) (Ref. 29)
1966 to 1969 2928.16 34.95 15.56 49.48 0.059 0.152
1970 to 1979 2822.06 39.50 15.05 45.45 0.059 0.132
1980 to 1989 1989.64 41.61 15.17 43.22 0.051 0.127
1990 to 1995 1027.19 52.67 12.48 34.85 0.030 0.104
2005 to 2010 598.3 57.63 16.85 25.52 0.022 0.048
It can also be clearly seen that zero discharge accounts for much more during the changing
period. The daily sediment delivery ratio with 0 values is nearly 60% within 1955 to 1979
but reduced to 32.6% during the changing period. There is no discharge measured at
Huangfu station during all of 2011. Even a storm in 14th of August with 58.4-mm rainfall
did not produce surface flow.30 Thus, it can be concluded that numerous soil and water con-
servation measures, especially, the check dams trapped considerable discharge and sediment
in the Huangfuchuan catchment.
5.2 Sediment Particle Sizes Associated with Check Dam Construction
In general, hyper-concentrated sediment flow can be trapped in the check dams. In most cases,
the check dams consisted of the embankment, spillway, and outlet. Before 1980, most check
dams had no spillway or outlet, and all the upstream incoming sediment would be trapped
by the dams. In the check dams with spillway, the sediment flow will be filtered. In principle,
the coarse grain sediment will deposit rapidly in the water surface area of the dam, and the
sediment with fine particle sizes will be flushed away through the spillway. In such cases,
most coarse-grain sediment is trapped before the dams.
In the Huangfuchuan catchment, frequently occurring storms mainly concentrated in July
and August. Sediment load during these months contributed approximately 70% of the total.
In recent years, zero flow and sediment lasted several months during the dry season. Thus, sedi-
ment particle sizes during July and August may represent the effects of check dams on them. As
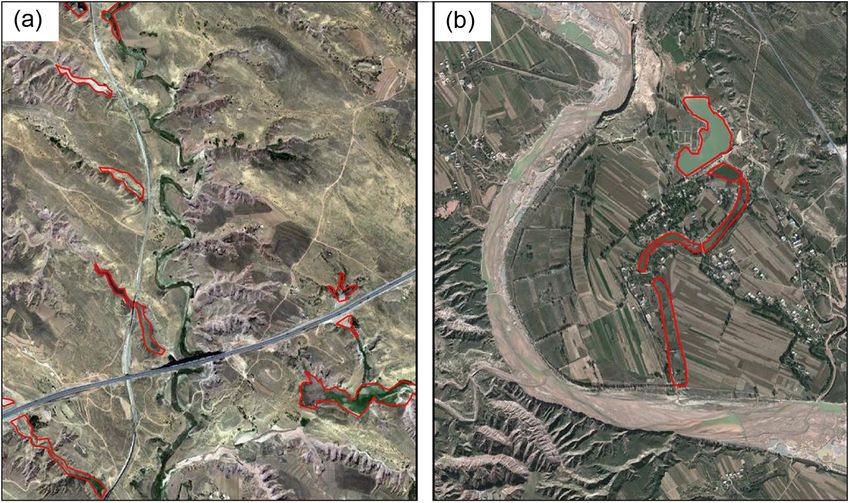
Fig. 7 Potential driving forces for check dam construction. (a) dam construction for highway pro-
tection; (b) dam construction for arable land.
Journal of Applied Remote Sensing 073697-10 Vol. 7, 2013
Downloaded From: https://www.spiedigitallibrary.org/journals/Journal-of-Applied-Remote-Sensing on 25 Sep 2021
Terms of Use: https://www.spiedigitallibrary.org/terms-of-useTian et al.: Check dam identification using multisource data and their effects on streamflow. . .
shown in Table 4, observed data at Huangfu hydrological station indicated that mean and median
sediment particle diameter illustrated evident decreasing trends, presenting the trapping effects
of the check dams. The percentage of sediment particle diameterTian et al.: Check dam identification using multisource data and their effects on streamflow. . .
2. C. Boix-Fayos et al., “Effects of check dams, reforestation and land-use changes on river chan-
nel morphology: case study of the Rogativa catchment (Murcia, Spain),” Geomorphology
91(1–2), 103–123 (2007), http://dx.doi.org/10.1016/j.geomorph.2007.02.003.
3. L. Zhang, C. X. Shi, and H. Zhang, “Effects of check-dams on sediment storage-release in
Chabagou Watershed,” Trans. CSAE 26(2), 64–69 (2010) (in Chinese).
4. C. Boix-Fayos et al., “The impact of land use change and check-dams on catchment sedi-
ment yield,” Hydrol. Process. 22(25), 4922–4935 (2008), http://dx.doi.org/10.1002/hyp
.v22:25.
5. X. Z. Xu, H. W. Zhang, and O. Y. Zhang, “Development of check-dam systems in gullies on
the Loess Plateau, China,” Environ. Sci. Policy 7(2), 79–86 (2004), http://dx.doi.org/10
.1016/j.envsci.2003.12.002.
6. G. Bombino, V. Tamburino, and S. M. Zimbone, “Assessment of the effects of check-dams
on riparian vegetation in the Mediterranean environment: a methodological approach and
example application,” Ecol. Eng. 27(2), 134–144 (2006), http://dx.doi.org/10.1016/j
.ecoleng.2006.01.005.
7. D. C. Ran et al., “Sediment retention by check dams in the Hekouzhen–Longmen Section of
the Yellow River,” Int. J. Sediment Res. 23(2), 159–166 (2008), http://dx.doi.org/10.1016/
S1001-6279(08)60015-3.
8. Y. F. Wang et al., “Check dam in the Loess Plateau of China: engineering for environmental
services and food security,” Environ. Sci. Technol. 45(24), 10298–10299 (2011), http://dx
.doi.org/10.1021/es2038992.
9. M. Huang et al., “River bed identification for check-dam engineering using SPOT-5 image
in the HongShiMao watershed of the Loess Plateau, China,” Int. J. Remote Sens. 30(8),
1853–1865 (2009), http://dx.doi.org/10.1080/01431160802508977.
10. Z. Jin et al., “How many check dams do we need to build on the Loess Plateau?,” Environ.
Sci. Technol. 46(16), 8527–8528 (2012), http://dx.doi.org/10.1021/es302835r.
11. D. Z. Peng et al., “Reservoir storage curve estimation based on remote sensing data,” J.
Hydrol. Eng. 11(2), 165–172 (2006), http://dx.doi.org/10.1061/(ASCE)1084-0699(2006)
11:2(165).
12. W. A. Marcus and M. A. Fonstad, “Optical remote mapping of rivers at sub-meter reso-
lutions and watershed extents,” Earth Surf. Proc. Land 33(1), 4–24 (2008), http://dx.doi
.org/10.1002/(ISSN)1096-9837.
13. G. X. Wang and S. H. Li, “Application of remote sensing data to extraction of underwater
topography of reservoir,” J. Hohai Univ. 26(6), 91–94 (1998) (in Chinese).
14. J. Liebe, N. van de Giesen, and M. Andreini, “Estimation of small reservoir storage
capacities in a semi-arid environment—a case study in the Upper East Region of
Ghana,” Phys. Chem. Earth 30(6–7), 448–454 (2005), http://dx.doi.org/10.1016/j.pce
.2005.06.011.
15. F. O. Annor et al., “Delineation of small reservoirs using radar imagery in a semi-arid envi-
ronment: a case study in the upper east region of Ghana,” Phys. Chem. Earth 34(4–5),
309–315 (2009), http://dx.doi.org/10.1016/j.pce.2008.08.005.
16. J. B. Liu and C. D. Dai, “The application of TM image in reservoir situation monitoring,”
Chin. Remote Sens. Environ. 11(1), 54–58 (1996) (in Chinese).
17. A. P. Propastin, “Simple model for monitoring Balkhash Lake water levels and Ili River
discharges: application of remote sensing,” Lake Reservoir: Res. Manage. 13(1), 77–81
(2008), http://dx.doi.org/10.1111/j.1440-1770.2007.00354.x.
18. M. Abedini, M. A. M. Said, and F. Ahmad, “Effectiveness of check dam to control soil
erosion in a tropical catchment (The Ulu Kinta Basin),” Catena 97, 63–70 (2012),
http://dx.doi.org/10.1016/j.catena.2012.05.003.
19. J. Y. Sui, Y. He, and B. W. Karney, “Flow and high sediment yield from the Huangfuchuan
watershed,” Int. J. Environ. Sci. Technol. 5(2), 149–160 (2008).
20. USGS, The United States Geological Survey, Earth Explorer database, http://earthexplorer
.usgs.gov (28 November 2012).
21. L. S. Ran and X. X. Lu, “Delineation of reservoirs using remote sensing and their storage
estimate: an example of the Yellow River basin, China,” Hydrol. Process. 26(8), 1215–1229
(2012), http://dx.doi.org/10.1002/hyp.8224.
Journal of Applied Remote Sensing 073697-12 Vol. 7, 2013
Downloaded From: https://www.spiedigitallibrary.org/journals/Journal-of-Applied-Remote-Sensing on 25 Sep 2021
Terms of Use: https://www.spiedigitallibrary.org/terms-of-useTian et al.: Check dam identification using multisource data and their effects on streamflow. . .
22. J. R. Jensen, Remote Sensing of the Environment: An Earth Resource Perspective, Prentice
Hall, New Jersey (2000).
23. T. Sawunyama, A. Senzanje, and A. Mhizha, “Estimation of small reservoir storage
capacities in Limpopo River Basin using geographical information systems (GIS) and
remotely sensed surface areas: case of Mzingwane catchment,” Phys. Chem. Earth
31(15–16), 935–943 (2006), http://dx.doi.org/10.1016/j.pce.2006.08.008.
24. J. Liebe, “Estimation of water storage capacity and evaporation losses of small reservoirs in
the upper east region of Ghana,” Diploma Thesis (Univ. of Bonn, 2002).
25. J. Y. Jiao et al., “Silting land and sediment blocking benefit of check dam in hilly and gully
region on the Loess Plateau,” Trans. CSAE 19(6), 302–306 (2003) (in Chinese).
26. H. B. Mann, “Non-parametric test against trend,” Econometrika 13(3), 245–259 (1945).
27. M. G. Kendall, Rank Correlation Methods, Charles Griffin, London (1975).
28. D. C. Ran, “Study on strategies of basin comprehensive harnessing and responses of runoff
and sediment to soil and water conservation measures in Huangfuchuan River Basin,”
Master Thesis, Xi’an University of Technology (2006).
29. S. J. Wang and L. S. Ran, “Analysis of dam effect on sediment yield in the Wudinghe River
Basin,” Geog. Res. 27(4), 811–818 (2008) (in Chinese).
30. Yellow River Water Conservancy Commission, Ministry of Water Resources Conservancy,
China (2011), Bulletin of the Yellow River, http://www.yellowriver.gov.cn/nishagonggao
(18 June 2013).
31. X. M. Fang, Z. H. Wan, and S. F. Kuang, “Mechanism and effect of silt-arrest dams for
sediment reduction in the middle Yellow River basin,” J. Hydraul. Eng. 29(10), 49–53
(1998) (in Chinese).
32. Ministry of Water Resource of P.R. China, “Programming for check dams in the Loess
Plateau,” Technical report, pp. 47–48 (2003) (in Chinese).
Biographies and photographs of the authors not available.
Journal of Applied Remote Sensing 073697-13 Vol. 7, 2013
Downloaded From: https://www.spiedigitallibrary.org/journals/Journal-of-Applied-Remote-Sensing on 25 Sep 2021
Terms of Use: https://www.spiedigitallibrary.org/terms-of-useYou can also read