Surface Water Detection Method for Water Resources Management
←
→
Page content transcription
If your browser does not render page correctly, please read the page content below

Journal of Physics: Conference Series

PAPER • OPEN ACCESS

Surface Water Detection Method for Water Resources Management
To cite this article: Abdulmalik T. Assaf et al 2021 J. Phys.: Conf. Ser. 1973 012149

View the article online for updates and enhancements.

                                This content was downloaded from IP address 46.4.80.155 on 25/09/2021 at 16:52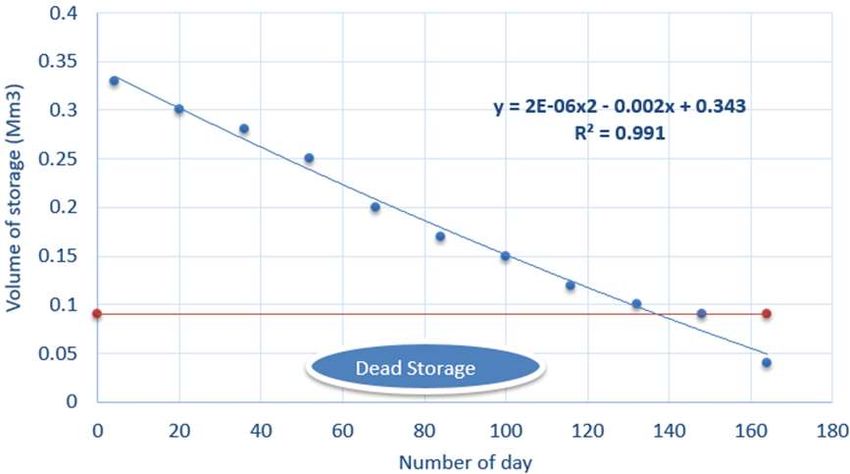
IICESAT Conference, College of Material Engineering, University of Babylon, Iraq        IOP Publishing
Journal of Physics: Conference Series          1973 (2021) 012149 doi:10.1088/1742-6596/1973/1/012149

            Surface Water Detection Method for Water Resources
            Management

                               Abdulmalik T. Assaf*1, Khamis N. Sayl*1and Ammar Adham*1
                               1
                                 Dams and water resources Department, Engineering college, Anbar
                               University, Ramadi, Iraq

                               abd19e4005@uoanbar.edu.iq
                               knsayl@uoanbar.edu.iq
                               Engammar2000@yahoo.come
                               abd19e4005@uoanbar.edu.iq

                               ABSTRACT: Small significance earth dams during the dry period for locals at most
                               semi-arid cannot be overestimated. Water stored in the same of these dams is little or
                               no lack of domestic water and drinking water for residents during dry periods. The
                               main limitation is the lack of knowledge of the storage quantities of small dams in the
                               study area and knowing this form of field data regularly is costly and needs a long
                               and arduous time. Remote sensing and geographic information systems (GIS) can be
                               used in this study due to their ability to measure and analyze the amount of water
                               stored in some small reservoirs. In this paper, the Water Natural Difference Index
                               (NDWI) is used to detect the surface area as the base to estimate small reservoir
                               storage capacities. The model equation created by this study provided a tool to know
                               the amount of water available per day in the small reservoirs during the dry season
                               and thus was able to obtain clear pictures of the water resources system by the
                               planners. This method may help the planners and water managers will quickly make
                               decisions on how to utilize and manage the available water given the various
                               competing uses.
                               Keywords: area curve method - volume - altitude - remote sensing - geographic
                               information system (GIS). Water Natural Difference Index (NDWI).

            1. Introduction
            Civilization is mainly based on the availability of water that has become a scarce resource
            with an exponential increase in the arid region[1]. However, large quantities of water are
            stored in these small reservoirs and the direction of the riverbed depends on the flow of this
            water, during periods of drought this water is rarely available in sufficient quantity [2].
            Effective management and planning are overwhelmed with the knowledge of storage volumes
            [3][4]. This causes a lack of sufficient knowledge of small storage capacities and this is a
            hindrance in the process of decision-making that relates to design and managing current water
            resources. Determining the amount of water present and its knowledge is important to
            maintain water sustainability as well as help planners in sustaining customer demand.

              Content from this work may be used under the terms of the Creative Commons Attribution 3.0 licence. Any further distribution
              of this work must maintain attribution to the author(s) and the title of the work, journal citation and DOI.
Published under licence by IOP Publishing Ltd                          1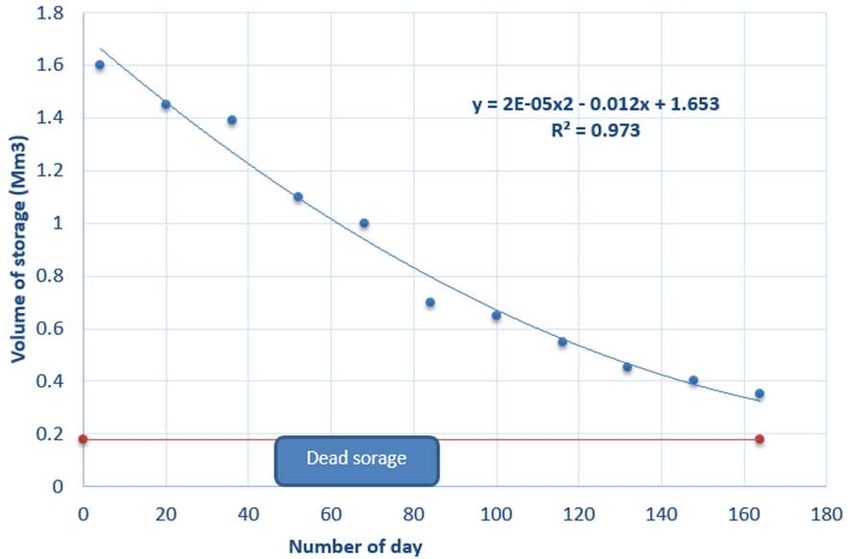
IICESAT Conference, College of Material Engineering, University of Babylon, Iraq        IOP Publishing
Journal of Physics: Conference Series          1973 (2021) 012149 doi:10.1088/1742-6596/1973/1/012149

         The sustainability of the rainwater collecting is fundamental to the development of livelihoods
         in both socio-economic and biophysical conditions in arid and semi-arid regions [5].
         Sustainability focuses on having a harvest in the consumption and use of natural water
         resources, through the rainwater harvesting uses. Where the existence of small reservoirs to
         provide ready and appropriate sources of water to be used in different communities of rural
         communities and that can become indispensable areas, which is very important in the
         development of livelihoods in the rural community[6].
         For water resources evaluation it is necessary to know the adequate capacity of the respective
         reservoir. The volume of water in the reservoir must be measured to estimate the shape of the
         reservoir at the earliest [3]. And because the long and cross-sections of the reservoir are
         usually irregular, so it is not easy. A good way to estimate the amplitude is to consider the
         area around the lines at proportional intervals. After that, the volume can be calculated
         between two successive contours, after which these volumes are recorded and the total dam
         capacity can be obtained. In many cases, it is here to design small dams without the need for a
         full topographic survey. The management of water resources in arid and semi-arid regions
         faces many difficulties, as the areas are not eligible and do not have the infrastructure, and
         this makes transportation difficult, especially since its valleys have vast areas [7][8][9].
         Therefore, it is imperative to manage the water resources in these areas with the necessary
         research.
         In terms of the availability of remote sensing techniques, climate models, and information
         available, more detailed in it has new capabilities in detail models of small reservoirs to
         measure its surface area to know their storage capabilities. However, the latest developments
         are commuter devices it has the means to process larger spectral data arrays in remote sensing
         and to integrate this data with other geographic information[10]. Consequently, there are
         indications of and scope for improvement concerning research on small dams and the need to
         establish a model equation for reservoir estimation store capacity for small dams using their
         remote surface area sensor.
         The discovery of bodies of water is the source of concern that has been followed since the
         first photos of Landsat were there are in previous years [11]. The most popular and simple
         way to determine surface water using remote sensing data is to know the calculation of
         spectral indicators. Several indicators were then developed specifically to take advantage of
         the unique spectral signature of water compared to other land cover types
         [12][13][14][15][16][17][7][18].
         Using remote sensing data, changes in the water level of small earthen dams can be assessed
         over time. Where many studies have used remote sensing data to assess the storage capacity
         of a small reservoir, such as the study in Ghana [11] where there is a relationship between
         depth, area, and volume of the reservoir, as well as the Limpopo River study to estimate the
         small size. Reservoir capacity using remote sensing surface area and storage volume in
         continental topographic climate [2]. Several studies have used GIS in calculating the storage
         capacity of rainwater harvesting structures mentioned in the literature [19][20][21].
         This study aims to estimate small reservoir storage capacities as a function of their remotely
         sensed surface areas during the dry season to assess the sustainability of water storage in
         small earth dams.
         2.Study area
         The study area was chosen as Wadi Houran in Anbar, in the western desert of Iraq, about 450
         km west of Baghdad, as shown in Figure (1). Wadi Houran is the largest valley in the Anbar
         desert, where the length of the valley is 458 km from the city of Al-Baghdadi, where it meets

                                                        2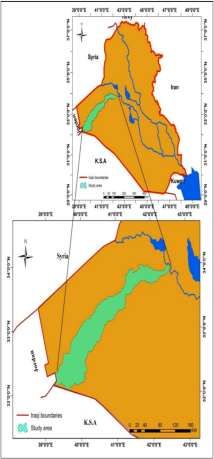
IICESAT Conference, College of Material Engineering, University of Babylon, Iraq        IOP Publishing
Journal of Physics: Conference Series          1973 (2021) 012149 doi:10.1088/1742-6596/1973/1/012149

         the Euphrates River until the border between Iraq and Saudi Arabia, as the geographical
         location of the Wadi Houran ranges between 39˚00'00' to 43˚00'00'' In the east and latitude
         32˚00''00', to 43˚ 30'00'' north [22]. The difference in slope between the start and the end was
         600 meters, and the valley catchment was about 11,370 square kilometers. The Wadi Houran
         region is cold in winter and hot in summer, so it is considered an arid region. The month of
         January is the coldest and July is the warmest month [23]. The valley temperature ranges
         between (0-48) degrees Celsius. The annual rainfall is about (75 - 150 mm). About 49% of the
         precipitation is in winter., 15% in autumn, 36% in spring, and summer without rain [24].
         Flooding occurs in the valley in short periods and the weather is dry most of the year.
         Maximum evaporation of destinations in the valley in July and August [25] the extent of
         evaporation ranges from (1600-1900) mm, and the range of relative humidity of the valley
         varies from month to month, and the annual rate ranges between (19% -82%).
         We notice the levels of deep groundwater in the study area and that the water of most of the
         wells is salty, as we note that the small earth dam is the ideal technology for freshwater. Wadi
         Houran contains four small earth dams, which are Al-Rutbah Dam, Al-Ubailah Dam, Houran
         Dam 2, and Houran Dam 3 as shown in Figure (1). The maximum storage of four dams is
         about (46) million cubic meters of water, as shown in Table (1).
         The Wadi Houran site is in a part of a fixed rack of the Arab platform and the valley area is
         almost flat. The Sheikh Al-Aas formation appears in Wadi Houran and downstream of about
         35 km. The Sheikh Alas formation is made of white, cream, and porous limestone. In an area
         near the Euphrates, the Euphrates formation along the Wadi Horan reveals most of the
         exposed rocks in the valley from hard limestone [26]. It provides a good base for terrain,
         social economy, hydrology, soil, and agricultural engineering [27]. Wadi Houran is a very
         important area in the Western Desert, as it receives large amounts of rain in the rainy seasons.
         Therefore, it is essential to optimize these quantities of water by storing the optimum amount
         of runoff [28][4].

                                              Figure 1. Study area

                                                         3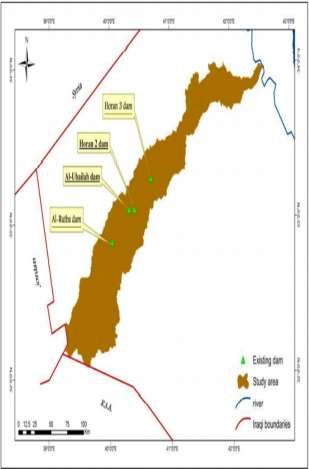
IICESAT Conference, College of Material Engineering, University of Babylon, Iraq        IOP Publishing
Journal of Physics: Conference Series          1973 (2021) 012149 doi:10.1088/1742-6596/1973/1/012149

                    Table 1. Small Dams in the study area (Ministry of Water Resources,2015)

                             Name of       Completion        Height of
                    N0.        Dam           Date            Dam (m)     Storage capacity (Mm3)
                1             Rutbah          1981             19                32
                2             Horan 2         2007             15                 5
                3             Horan 3         2003             15                5.3
                              AL-
                4           Ubailah            1973            11.5              4

         3.Methodology
         The methodology started to collect the area volume elevation curve for AL-Rutbah dam,
         Horan 2 dam, Horan 3 dam, and AL-Ubailah dam. To define the maximum dimensions of the
         reservoirs employing remote sensing data, which are represented by their largest surface area,
         the acquisition time should be as close as possible to the end of the rainy season, when the
         tanks are filled until the maximum full supply capacity and losses ((evaporation) and
         drawdown, leakage) is minimal.
         The procedure for estimating the surface areas used from the satellite imagery is image
         acquisition. However, the images were selected based on the images captured in this study
         every 16 days to make the storage capacity of the reservoir and define them in a surface area
         based on the area volume elevation curve. The Landsat 8 satellite image was imported into the
         Arc GIS 10.07 and projected UTM zone 37 north. Images were taken geographically and
         upon changing the pixel size to a resolution of 30m x 30m were combined into a single image
         strip.
         The detection and delineation of open surface water bodies using Landsat images were best
         done with imagery from the infrared and visible parts of the spectrum. The best method for
         detecting and determining the characteristic spectral reflection curve of water with increasing
         wavelength shows an overall decrease in reflection, such that the reflection of clear and deep
         water in the near-infrared is nearly zero [11].
         Spectral water index methods, such as the normalized difference water index, namely, and
         specifically, NDWI McFeeters [12], which are computed from a green band image and a
         single NIR-band image, and modification of the normalized difference water index, namely,
         [29], which is computed from a single green-band image and one SWIR-band image,
         extracting water body information more accurately, quickly and easily from general feature
         classification methods.
         NDWI was defined by McFeeters[12] as:

                          NDWI=(ρGreen-ρNIR)/(ρGreen+ρNIR)                           (1)

         where ρGreen and ρNIR are the reflectance of the green and NIR bands, respectively.
         The NDWI from McFeeters (1) using green wavelengths to maximize the reflection of a water
         body, (2) low reflectance filtering in NIR of water bodies, and (3) the extent to which high
         reflectance in NIR makes use of vegetation and soil characteristics [30]. As a result, water
         surface information and background information (vegetation and soil features) will be

                                                        4
IICESAT Conference, College of Material Engineering, University of Babylon, Iraq IOP Publishing
Journal of Physics: Conference Series 1973 (2021) 012149 doi:10.1088/1742-6596/1973/1/012149
restricted in the McFeters' NDWI images. By applying a border to NDWI images from
McFeters, means that bodies of water can be identified.
In the year 2020 for dry periods (May-October) one image per 16 days is captured. The
spectral band of Landsat used (B3&B5) these bands are merged through an equation (1) and
get surface area accurate. After digitizing the surface area was estimated. The three-step
analysis of this information and linked with the area volume elevation curve and formulate the
relationship between storage capacity and days in the dry period.
4.Results
In the study, through an inventory of satellite imagery, four small reservoirs from the western
desert of Iraq were visually identified. In each case, a reservoir has its area-volume curve and
depth-area curve. Thus, according to the NDWI, the remotely sensed surface area of a
reservoir, the volume storage can be estimated for each reservoir.
The main findings on the data obtained in the study are table (2) represents the relationship
between three parameters were the date of imagery taken, surface area, and volume storage in
the dry season.
To establish the model equation, a method used for quantitative estimation, an examination of
"informal modeling" was performed through which the basic premise is that the variable
(storage capacity) is affected by an independent variable (number of days). From the
regression equations, a regression curve was constructed for each dam. The regression curve
gives a formula in which the storage capacity of each reservoir is estimated, given the number
of days.
Satellite images may be used to assess changes in water levels in small dam over time. In this
case, the reservoir studied was evaluated to see the changes, which took place in storage
capacity in the dry season as a result of the various activities that take place around the
reservoir and most importantly the watering of the livestock. Since the capacitance is a
function of the surface area, we have provided expected changes in surface areas such as
selected by remote sensing of the studied reservoir.
Graphs 2,3,4 and 5 show the relationships between volume storage and the number of days in
the dry season for studied reservoirs Al-Rutbah, Horan 2, Horan 3, and Al-Ubailah dams.
Table 2. Surface area and the estimated storage volumes for Al- Rutbah, Horan 2, Horan 3,
and AL-Ubailah dams.
Date Name of Dame Surface area(m2) The volume of storage (Mm3)
AL-Rutbah 4700213.794 23
15/5 Horan2 800021.31 1.6
2020 Horan3 440302.5 0.33
Al-Ubailah 361121.32 0.35
AL-Rutbah 4657681.692 22.5
31/5 Horan2 775996.8659 1.45
2020 Horan3 420505.7 0.3
5IICESAT Conference, College of Material Engineering, University of Babylon, Iraq IOP Publishing
Journal of Physics: Conference Series 1973 (2021) 012149 doi:10.1088/1742-6596/1973/1/012149
Al-Ubailah 322313.13 0.3
AL-Rutbah 460002.321 21.8
16/6 Horan2 733218.1048 1.39
2020 Horan3 400312.1 0.28
Al-Ubailah 300136.34 0.25
AL-Rutbah 4451230.321 20.8
2/7 Horan2 637004.0287 1.1
2020 Horan3 394095.6482 0.25
Al-Ubailah 275432.05 0.2
AL-Rutbah 4362130.114 19.5
18/7 Horan2 583273.5375 1
2020 Horan3 349831.0949 0.2
Al-Ubailah 186325.44 0.1
AL-Rutbah 4300012.001 19
3/8 Horan2 501070.5999 0.7
2020 Horan3 222734.0346 0.17
Al-Ubailah ………………………. 0
AL-Rutbah 4211034.457 18.2
19/8 Horan2 461606.2597 0.65
2020 Horan3 255826.8981 0.15
Al-Ubailah ……………………….. 0
AL-Rutbah 4000013.142 16.5
4/9 Horan2 420671.1058 0.55
2020 Horan3 133657.7756 0.12
Al-Ubailah …………………………. 0
AL-Rutbah 3901267.298 16.1
20/9 Horan2 362503.42 0.45
2020 Horan3 104688.2052 0.1
Al-Ubailah ……………………... 0
AL-Rutbah 3800458.131 15.5
6/10 Horan2 305214.046 0.4
2020 Horan3 95789.3254 0.09
6IICESAT Conference, College of Material Engineering, University of Babylon, Iraq IOP Publishing
Journal of Physics: Conference Series 1973 (2021) 012149 doi:10.1088/1742-6596/1973/1/012149
Al-Ubailah ……………………… 0
AL-Rutbah 3651367.254 14
22/10 Horan2 293244.9656 0.35
2020 Horan3 62064.88856 0.04
Al-Ubailah ……………………… 0
5.Discuss Results
We see water described as the most precious natural resource in the Western Desert of Iraq. It
is undoubtedly the most vital and thus the need to effectively plan and manage water
resources. The storage capacity and the number of days in dry season relationships are built
for the four small earth dams in the Western Desert of Iraq. The cost of this method is less
labor and less cost.
The general curve shapes represent of expected curves of small reservoirs as shown by
common designs of small reservoirs. This is because reservoirs were very different in shape,
depth, and nature. It was found that all equations have a higher value of the coefficient of
identification (R2) higher (0.958%). The difference in R2 is explained by the different
properties of the dam. However, from the results given in Figures 2,3,4, and 5, the
summarized equation gives a better assessment of storage ability as compared with the height.
From a comparison of the tables of remote sensing areas 2, 3, 4, 5, the Al-Ubailah dam is less
than others. According to the regression analysis performed in this study of generalized
equations for storage capacities of small reservoirs in the Western Desert of Iraq is due to
their surface area, evaporation, dam shape, and water extraction.
There was evidence of local communities using small reservoirs to conserve water for
irrigation in the dry season. The differences in the storage capacity of the reservoir located in
the Western Desert of Iraq over the years due to the change in precipitation and the various
uses during years depending on whether or not the year of drought. Due to the amount of rain
it receives during the period, the estimated surface area is small in 2020, so its storage volume
is low compared to other years. This information is necessary regarding the management of
small dams, and storage estimation. Over time, depending on the time of acquisition of the
images and with the introduction of precipitation and disposal of silt, Storage capacities will
vary, and therefore benefit from using data to satellites to managing water levels in reservoirs.
So a clear picture was drawn of what the reservoirs could carry at any time. Demonstrating
this, water can be taken and allocated in larger reservoirs based on the variation of smaller
reservoirs.
Note that through measured capabilities, water managers and planners will make rapid
decisions about how to manage available water under different competing uses. Hence, from
the results of this study, using remotely sensed surface areas it is possible to estimate the
storage capacities of small reservoirs of dams. Remote sensing and geographic information
systems can be used in this study due to their ability to storage and retrieval the hydrological
data needed for planning and developing reservoirs and can measure and analyze the amount
of water stored in a small volume reservoir. However, the general estimation of water volume
in this study using a GIS procedure was based on a simple relationship dependent on surface
area and depth. Instead of measuring all parameters, the GIS technique makes usage of the
reduced levels to calculate storage volumes in a way that represents a basin that is emptied
over time. This process allows for the estimation of storage changes in water levels over time .
7IICESAT Conference, College of Material Engineering, University of Babylon, Iraq IOP Publishing
Journal of Physics: Conference Series 1973 (2021) 012149 doi:10.1088/1742-6596/1973/1/012149
Figure 2. Relationship between volume of storage and number of days for Al- Rutbah dam.
Figure 3. Relationship between volume of storage and number of days for Horan 2 dam.
8IICESAT Conference, College of Material Engineering, University of Babylon, Iraq IOP Publishing
Journal of Physics: Conference Series 1973 (2021) 012149 doi:10.1088/1742-6596/1973/1/012149
Figure 4. Relationship between volume of storage and number of days for Horan 3 dam
Figure 5. Relationship between volume of storage and number of days for Al-Ubailah dam
6.Conclusions
The main limitation is the lack of knowledge of the storage quantities of small dams in the
western desert of Iraq and knowing this form of field data regularly is costly and needs a long
and arduous time. The integration of GIS and remote sensing data has been developed to
estimate small reservoir volumes using remotely sensed surface area. The model equation
created by this study provided a tool to know the amount of water available per day in the
small reservoirs during the dry season and thus was able to obtain clear pictures of the water
9IICESAT Conference, College of Material Engineering, University of Babylon, Iraq IOP Publishing
Journal of Physics: Conference Series 1973 (2021) 012149 doi:10.1088/1742-6596/1973/1/012149
resources system by the planners. It can conclude that the use of satellite images and the
obtained small reservoir capacities have a significant effect on water resources planning and
management in the basin.
7.Reference
[1] A. H. C. De Teixeira, L. H. L. H. L. H. Bassoi, A. H. de C. Teixeira, L. H. L. H. L. H.
Bassoi, A. H. C. De Teixeira, and L. H. L. H. L. H. Bassoi, “Crop water productivity
in semi-arid regions: From field to large scales,” Ann. Arid Zone, vol. 48, no. 3–4, pp.
285–297, 2009.
[2] T. SAWUNYAMA, “ESTIMATION OF SMALL RESERVOIR STORAGE
CAPACITIES IN LIMPOPO RIVER BASIN USING GEOGRAPHICAL
INFORMATION SYSTEMS (GIS) AND REMOTELY SENSED SURFACE
AREAS,” ZIMBABWE, 2005.
[3] K. N. Sayl, N. S. Muhammad, and A. El-Shafie, “Optimization of area--volume--
elevation curve using GIS--SRTM method for rainwater harvesting in arid areas,”
Environ. Earth Sci., vol. 76, no. 10, p. 368, 2017.
[4] K. N. Sayl, N. S. Muhammad, and A. El-Shafie, “Identification of potential sites for
runoff water harvesting,” in Proceedings of the Institution of Civil Engineers-Water
Management, 2019, vol. 172, no. 3, pp. 135–148.
[5] S. O. Sulaiman, A. H. Kamel, K. N. Sayl, and M. Y. Alfadhel, “Water resources
management and sustainability over the Western desert of Iraq,” Environ. Earth Sci.,
vol. 78, no. 16, pp. 1–15, 2019, doi: 10.1007/s12665-019-8510-y.
[6] K. Stevenson, “The role of small dams in improving rural livelihoods in semi-arid
areas,” in Care Stakeholder Workshop, 2000, pp. 29–31.
[7] H. Q. Hashim and K. N. Sayl, “Detection of suitable sites for rainwater harvesting
planning in an arid region using geographic iHashim, H. Q., & Sayl, K. N. (2020).
Detection of suitable sites for rainwater harvesting planning in an arid region using
geographic information system. App,” Appl. Geomatics, pp. 1–14, 2020.
[8] H. Q. Hashim and K. N. Sayl, “The application of radial basis network model, GIS,
and spectral reflectance band recognition for runoff calculation,” Int. J. Des. Nat.
Ecodynamics, vol. 15, pp. 441–447, 2020.
[9] R. I. Naif, “Optimal Height and Location of Multipurpose Small Dams Series in the
Western Desert; Horan Valley - A Case Study,” Anbar, 2020.
[10] S. A. Isard, “Evaluation of models for predicting insolation on slopes within the
Colorado alpine tundra,” Sol. Energy, vol. 36, no. 6, pp. 559–564, 1986.
[11] J. Liebe, “Estimation of Water Storage Capacity and Evaporation Losses of Small
Reservoirs in the Upper East region of Ghana,” Thesis, p. 113, 2002, [Online].
Available: http://www.zef.de/fileadmin/template/Glowa/Downloads/thesis_liebe.pdf.
[12] S. K. McFeeters, “The use of the Normalized Difference Water Index (NDWI) in the
delineation of open water features,” Int. J. Remote Sens., vol. 17, no. 7, pp. 1425–
1432, 1996.
[13] G. L. Feyisa, H. Meilby, R. Fensholt, and S. R. Proud, “Automated Water Extraction
10IICESAT Conference, College of Material Engineering, University of Babylon, Iraq IOP Publishing
Journal of Physics: Conference Series 1973 (2021) 012149 doi:10.1088/1742-6596/1973/1/012149
Index: A new technique for surface water mapping using Landsat imagery,” Remote
Sens. Environ., vol. 140, pp. 23–35, 2014.
[14] L. Shen and C. Li, “Water body extraction from Landsat ETM+ imagery using
adaboost algorithm,” in 2010 18th International Conference on Geoinformatics, 2010,
pp. 1–4.
[15] C. J. Tucker, “Red and photographic infrared linear combinations for monitoring
vegetation,” Remote Sens. Environ., vol. 8, no. 2, pp. 127–150, 1979.
[16] A. Fisher, N. Flood, and T. Danaher, “Comparing Landsat water index methods for
automated water classification in eastern Australia,” Remote Sens. Environ., vol. 175,
pp. 167–182, 2016.
[17] J. P. Lacaux, Y. M. Tourre, C. Vignolles, J. A. Ndione, and M. Lafaye, “Classification
of ponds from high-spatial resolution remote sensing: Application to Rift Valley Fever
epidemics in Senegal,” Remote Sens. Environ., vol. 106, no. 1, pp. 66–74, 2007.
[18] M. H. A. Baig, L. Zhang, T. Shuai, and Q. Tong, “Derivation of a tasselled cap
transformation based on Landsat 8 at-satellite reflectance,” Remote Sens. Lett., vol. 5,
no. 5, pp. 423–431, 2014.
[19] A. Irvem and others, “Application of GIS to determine storage volume and surface
area of reservoirs: the case study of Buyuk Karacay dam,” Int J Nat Eng Sci, vol. 5,
pp. 39–43, 2011.
[20] A. Cvar, “GIS-based reservoir planning with limited data in developing nations: a case
study of the lower Mekong River basin,” Colorado State University, 2014.
[21] K. N. Sayl, N. S. Muhammad, Z. M. Yaseen, and A. El-shafie, “Estimation the
physical variables of rainwater harvesting system using integrated GIS-based remote
sensing approach,” Water Resour. Manag., vol. 30, no. 9, pp. 3299–3313, 2016.
[22] K. Sayl, A. Adham, and C. J. Ritsema, “A GIS-based multicriteria analysis in
modeling optimum sites for rainwater harvesting,” Hydrology, vol. 7, no. 3, p. 51,
2020.
[23] K. N. Sayl, A. S. Mohammed, and A. D. Ahmed, “GIS-based approach for rainwater
harvesting site selection,” IOP Conf. Ser. Mater. Sci. Eng., vol. 737, no. 1, pp. 0–10,
2020, doi: 10.1088/1757-899X/737/1/012246.
[24] A. Adham et al., “A GIS-based approach for identifying potential sites for harvesting
rainwater in the Western Desert of Iraq,” Int. Soil Water Conserv. Res., vol. 6, no. 4,
pp. 297–304, 2018, doi: 10.1016/j.iswcr.2018.07.003.
[25] B. M. Hussien, “Hydrogeologic condition within al-Anbar governorate,” J. Anbar
Univ. Pure Sci., vol. 4, pp. 97–111, 2010.
[26] A. S. Muneer, K. N. Sayl, and A. H. Kamal, “Modeling of spatially distributed
infiltration in the Iraqi Western Desert,” Appl. Geomatics, pp. 1–13, 2021.
[27] M. A. Khudhair, K. N. Sayl, and Y. Darama, “Locating site selection for rainwater
harvesting structure using remote sensing and GIS,” in IOP Conference Series:
Materials Science and Engineering, 2020, vol. 881, no. 1, p. 12170.
[28] A. S. Muneer, K. N. Sayl, and A. H. Kamel, “Modeling of Runoff in the Arid Regions
Using Remote Sensing and Geographic Information System (GIS),” J. homepage
http//iieta. org/journals/ijdne, vol. 15, no. 5, pp. 691–700, 2020.
[29] H. Xu, “Modification of normalised difference water index (NDWI) to enhance open
water features in remotely sensed imagery,” Int. J. Remote Sens., vol. 27, no. 14, pp.
11IICESAT Conference, College of Material Engineering, University of Babylon, Iraq IOP Publishing
Journal of Physics: Conference Series 1973 (2021) 012149 doi:10.1088/1742-6596/1973/1/012149
3025–3033, 2006.
[30] F. Karsli, A. Guneroglu, and M. Dihkan, “Spatio-temporal shoreline changes along the
southern Black Sea coastal zone,” J. Appl. Remote Sens., vol. 5, no. 1, p. 53545, 2011.
12You can also read