Aging Rate of Grade 3 Presspaper Insulation used in Power Transformers

Page created by Micheal Reyes
 
CONTINUE READING
Aging Rate of Grade 3 Presspaper Insulation used in Power Transformers
IEEE Transactions on Dielectrics and Electrical Insulation          Vol. 21, No. 5; October 2014                                     2355

                    Aging Rate of Grade 3 Presspaper Insulation
                           used in Power Transformers
                                                    Nick Lelekakis, Jaury Wijaya
                                                   Centre for Power Transformer Monitoring
                                                               Monash University
                                                         Clayton, VIC 3800, Australia

                                                      Daniel Martin, Tapan Saha
                                                            Power and Energy Systems
                                                             University of Queensland
                                                          St. Lucia, QLD 4072, Australia

                                                                   Dejan Susa
                                                                     Statnett
                                                             Trondheim, 7004, Norway

                                                         and Christoph Krause
                                                      Weidmann Electrical Technology AG
                                                       Rapperswil, CH-8640, Switzerland

                                                                   ABSTRACT
                     Paper materials are used as the insulation of power transformers. Over time these
                     materials slowly degrade, until they reach a point when they no longer function
                     effectively as transformer insulation, and the transformer has then reached its end of
                     life. The aging rate of paper is affected by temperature, water, oxygen and acids.
                     Investigations have been performed previously on Kraft and Kraft thermally upgraded
                     types of paper. However, a different type of paper used in transformer insulation,
                     Grade 3 presspaper (which contains cotton), has not been extensively tested and
                     compared to Kraft paper. In these experiments we studied the aging rate of Grade 3
                     presspaper and compared it to our previous studies of Kraft paper. Traditionally, the
                     aging rate of paper has been studied in sealed vessels. The problem with this approach
                     is that the chemical environment within the vessel will change during aging, and so the
                     aging rate will be affected. In our experiment setup we controlled the water and oxygen
                     content to more accurately determine the aging rate. Similarly to Kraft paper, the
                     aging rate of Grade 3 presspaper with the same water content increased with oxygen
                     content in the oil. Life curves were developed based on the water content of the paper
                     and the oxygen content of the oil.
                       Index Terms - Aging, cellulose, hydrolysis, paper insulation, oil-paper, power
                     transformer.

                     1 INTRODUCTION                                          contains cotton in addition to wood cellulose. The Grade 3
                                                                             presspaper tested conformed to standard IEC 60641-3-2 P.4.3
   IN our previous work equations for modelling the aging of                 [3]. The samples investigated were a 50 %/50 % mix of cotton
both Kraft and thermally upgraded paper were given [1, 2].                   and wood cellulose.
The motivation for this work was to provide transformer users
a tool to estimate the end of life of their assets. In this article             Not much research has been published on Grade 3
we report on the aging of another cellulosic material used to                presspaper. Despite a thorough literature review only one
insulate transformer windings, Grade 3 presspaper, which                     article on aging was found. McShane et al compared the aging
                                                                             of Grade 3 presspaper heated in mineral and vegetable oil at
Manuscript received on 23 August 2013, in final form 18 January 2014,        one temperature, 170 ⁰C [4]. The goal of their experiment was
accepted 24 March 2014.                                                      to investigate the relative rate of aging of presspaper in

                                                           DOI 10.1109/TDEI.2014.004266
Aging Rate of Grade 3 Presspaper Insulation used in Power Transformers
2356                                        N. Lelekakis et al.: Aging Rate of Grade 3 Presspaper Insulation used in Power Transformers

vegetable and mineral oil, not to determine an aging model.           Emsley also related aging rate k to temperature using the
Another study focussed on the aging of two types of                 Arrhenius relationship (3).
pressboard, Transformer board TIV (from wood cellulose) and
Cotton board [5]. This investigation determined that the aging                                                                   (3)
behaviour was very similar, and that the life of Transformer          where Ea is the activation energy required for the reaction in
board is slightly longer, ≈20 %, than that of the Cotton board.     J/mol, T is temperature in kelvin, R is the gas constant (8.314
                                                                    J/mol/K) and A is a pre-exponential factor in h-1.
   Grade 3 presspaper is a cellulosic material manufactured
from a mixture of cotton and wood pulp. It is used by                          1.2 CALCULATING PAPER END OF LIFE
transformer manufacturers as an alternative to standard Kraft           Equation (4) was used to model the fall in DP for both
paper. An advantage to using a blend is that the paper mill          oxidation and hydrolysis reactions, based on a pseudo zero
can modify the properties of paper such as strength,                 order kinetic equation. Emsley substituted equations (1) and
smoothness and evenness, dependent on fiber length [6].              (3) to form this equation [8], which was used to model the
Mixing Kraft pulp with cotton improves the mechanical                degradation of Kraft and thermally upgraded Kraft papers in
strength of the paper.                                               [1, 2].
   Since cotton is also a cellulosic material we assumed that                                                                                 (4)
the oxidation and hydrolysis reactions, which degrade Kraft
paper reported in [7-9], are relevant for describing the                In order to apply equation (4) to a transformer using Grade
degradation of Grade 3 presspaper because on the molecular           3 presspaper the A-values must be found, which was the goal
scale these materials are very similar. These materials are both     of this research. Despite a thorough literature review we were
cellulosic, formed from a large number of polymerized                unable to find published A-values for this material.
glucose links. The DP of this cotton/wood blend was slightly
higher than that of standard Kraft paper (≈1400 DP rather than               2 INVESTIGATION AND METHOD
1000 – 1200). Oxidation and hydrolysis reactions steadily              One problem with previous paper aging investigations was
cleave the cellulose polymer chain as the material ages. As the     that the chemical environment was not always kept constant.
average DP of the material falls its mechanical strength drops.     For instance, both oxygen and water affect the rate of aging
A DP of 200 is usually taken as end of life, when it has lost its   yet if the vessel is sealed their concentrations will change,
mechanical strength [10].                                           affecting the rate of reaction. In our previous work
                                                                    investigating the aging of Kraft, and thermally upgraded Kraft,
  In this investigation we present the results of aging
                                                                    a system was designed which would allow the operator to
experiments conducted on Grade 3 presspaper with a water
                                                                    minimize changes in the oxygen content of the oil, and water
content of 0.5, 1.6 and 2.7 % in mineral oil with low, medium
                                                                    content of the paper, during the investigation. This was
and high oxygen concentration.
                                                                    performed by adding oxygen if the level of this gas became
                    1.1 REACTION RATE                               too low, or by removing the paper and conditioning to return
  Emsley and Stevens reported in their review that most             its water content back to the desired value. This technique is
published data on cellulose aging can be modelled by a              fully described in [1, 2].
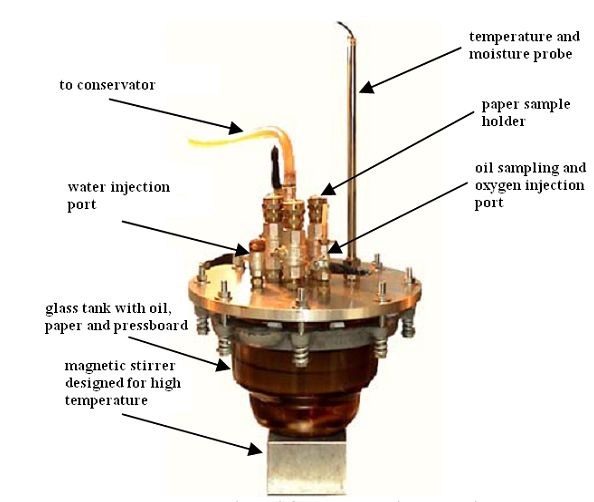
pseudo-zero rate law [11], i.e. the rate of reaction k is not          The paper samples were aged in 5-liter glass vessels shown
dependent on the availability of reactants, and is represented      in Figure 1. The lid was manufactured from stainless steel and
by the Ekenstam equation (1) [12].                                  included paper sample holders, a water activity probe, ports
                                                                    for adding water and oxygen. The water activity probe
                                                              (1)   measured the temperature and relative saturation of water in
                                                                    the oil. A magnetic stirrer was used to circulate the oil within
                                                                    the vessel. The vessel was placed in an air circulating oven set
   where DP is the average degree of polymerization per             to the desired temperature. A 2-liter conical flask with a 1-liter
molecular chain. Subscripts 0 and t refer to the DP value at        rubber bag was used as a conservator for when the oil
the initial t = 0 and at any time, t. Equation (1) assumes that     expands. The conservator was placed outside the oven and the
reaction rate k is constant. Therefore, the fall in DP is           rubber bag was purged with dry argon.
linear and thus rate k can be determined from the gradient.          Table 1. Properties of the paper samples used (tests performed according to
Calvini notes that the fall in DP starts to level off during        IEC Standard 60641-2). The Grade K presspaper was tested in a previous
aging [13]. However, the region between DP = 1000 and               study, reported in [1, 2].
DP = 200 is fairly linear, and thus a pseudo-zero order                                      Grade 3 presspaper          Grade K presspaper
reaction equation can be used. Emsley uses a first-order              Thickness (mm)               0.127                       0.127
                                                                      Sample size (mm)           150 x 11                    150 x 11
reaction equation to take into account the changing aging             Tensile strength               99                         94
rate [8], where two coefficients, rather than one, are used as        (machine
shown in equation (2).                                                direction) (MPa)
                                                                      Elongation                     2.3                         1.7
                                                                      (machine
                                    1                         (2)     direction) (%)
IEEE Transactions on Dielectrics and Electrical Insulation      Vol. 21, No. 5; October 2014                                               2357

  The mineral oil (Shell Diala AX) was dried and degassed                lower the water content of the oil (and thus the paper), or the
overnight using vacuum and 60 °C while being stirred. The                pressboard coils were replaced with new reconditioned
vacuum was released using dry argon gas. The antioxidant                 pressboards.
concentration of the oil was 0.19 %, found using method 5.1                 The oxygen concentration of the oil was measured using a
of IEC 60666 [14], and remained unchanged after oil                      gas chromatograph according to ASTM D3612 [17]. Oxygen
processing.                                                              is consumed by reactions occurring with both the oil and
                                                                         paper. Once the oxygen content approached the minimum of
                                                                         the required range it was topped up using a glass syringe filled
                                                                         with oxygen.
                                                                            The DP of the paper samples was measured according to
                                                                         standard ASTM D4243 [18]. The data was processed using
                                                                         software packages Microsoft Excel and Microcal Origin 6.0.

                                                                                                  3 RESULTS
                                                                            Paper aging experiments were conducted in low oxygen (<
                                                                         7000 ppm), medium oxygen (7,000–14,000 ppm) and high
                                                                         oxygen (16,500–25,000 ppm). Experiments were conducted at
                                                                         temperatures between 100 and 140 ºC. The water content of
                                                                         the paper was controlled at three levels 0.5, 1.6 or 2.7 %.
                                                                         Controlling the water content of paper using this method
                                                                         assumed that the isotherms of the paper did not change
                                                                         significantly during aging. The isotherms will change, so in
                                                                         order to determine the degree of change we measured the
           Figure 1. Vessel used for paper aging experiments.            water content of the paper, using Karl Fischer titration, at the
                                                                         beginning and end of aging.
   About 30 strips of paper were fixed on a paper sample
holders. The properties of the paper (as per the material data
sheets) are listed in Table 1, along with a comparison with                            3.1 WATER CONTENT OF PAPER
grade K presspaper.                                                         The water content of new and old paper was tested by
   The initial water content of the system was obtained by               placing the paper strips in a desiccator, and conditioning the
conditioning two lengths of type K pressboard (3 m length x              air relative humidity to 11.3 % (using a saturated LiCl
30mm width x 1 mm thickness) to the desired water content.               solution) and 43.2 % (ambient air) at a controlled room
The pressboards were formed into a coil, dried in the oven for           temperature (22 ± 1 °C). In Table 2 it can be seen that the
3 h and then placed on a laboratory balance. The pressboard              water content of Kraft and Grade 3 are very similar to one
absorbed moisture from the air and when the water content of             another at room temperature.
the pressboard reached the desired level for the experiment the               Table 2. Comparison of paper water content at room temperature.
pressboard was immersed in the oil. Water would then be                   Paper condition   Type of paper             Water content of paper
exchanged between the pressboard, oil and paper samples until                                   and DP                          (%)
equilibrium was achieved. The paper samples were not                                                            RH = 11.3 %          RH = 43.2 %
conditioned before use so that their DP remains unchanged.                     New               Kraft                2.9                6.5
                                                                                              DP = 1182
   The water content of paper in each experiment was                                            Grade 3               3.2                6.4
controlled by maintaining a relative saturation of water in the                               DP = 1433
oil that is equivalent to the desired water content of paper. The              Old               Kraft                2.2                4.9
                                                                                               DP = 245
relative saturation of water in the oil was measured using the                                  Grade 3               2.3                4.6
water activity probe. At constant temperature, thermodynamic                                   DP = 201
equilibrium exists between the oil and paper. The Fessler
equation was used to calculate the water content of paper from             The water content of Kraft and Grade 3 was measured
the water activity of the oil [15, 16]. This method has the              during one aging test, at 100°C, high oxygen and 2.7% paper
advantage that although the solubility of the oil to water may           water content. A discussion on the comparison between Kraft
change as the oil oxidizes, the solubility of the oil is not             paper, pressboard and the value provided by the Fessler
required for the calculation. The water content of paper was             equation was given in [2]. The measured water content of the
also occasionally measured directly using Karl-Fischer for               pressboard, 2.6 %, was found to be very similar to its
comparison with that provided by the Fessler equation. The               calculation, 2.7 %. However, the water content of the Kraft
water activity of the oil was continuously monitored and                 paper was found to be less, 2.3 %. It was thought that, as noted
adjusted to maintain a constant level. Measured quantities of            by Lundgaard in his investigation [9], some water had
water were added to experiments which consumed water. For                evaporated from the paper during sampling. The water content
experiments which produced water, either vacuum was used to              of Grade 3 was similar to the value for the Kraft paper,
2358                                                    N. Lelekakis et al.: Aging Rate of Grade 3 Presspaper Insulation used in Power Transformers

measured as 2.0 %. The water isotherms of Grade 3 are                                                        1600

therefore likely to be similar, within the range investigated, to                                                                                   Temperature and estimated
                                                                                                             1400
those for Kraft paper.                                                                                                                                 paper water content
                                                                                                                                                                100°C 0.5%
                                                                                                             1200                                               100°C 1.6%
                      3.2 CHANGES IN DP OF PAPER                                                                                                                100°C 2.7%
                                                                                                             1000                                               120°C 0.5%
   The changes in paper DP as a function of temperature                                                                                                         120°C 1.6%

                                                                                 DP value
                                                                                                                                                                120°C 2.7%
and paper water content for low, medium and high oxygen                                                      800
are shown in Figures 2 to 4. Error bars are marked on the
graphs, based on ± 2.5 %, in accordance with the likely                                                      600

measurement precision indicated by standard [18]. The
                                                                                                             400
effect of water and high oxygen can be seen in these
figures. Similarly to the other cellulosic materials, Kraft                                                  200
and thermally upgraded Kraft, the degradation rate of the
paper increased with water concentration. The increase in                                                        0
the oxygen content of the oil showed an increase in the                                                              0    500   1000     1500     2000      2500     3000      3500

aging rate of paper with the same water content and                                                                                    Aging time (hours)
temperature.                                                                    Figure 4. DP of Grade 3 presspaper insulation as a function of temperature
                                                                                and insulation wetness for high oxygen (16,500 – 25,000 ppm).

           1600

           1400
                                                                                                                 4 PSEUDO-ZERO ORDER KINETIC
                                              Temperature and estimated                                                  MODELLING
           1200
                                                 paper water content
                                                         100°C 2.7%
                                                                                   The Ekenstam pseudo-zero order approach was used to
                                                         120°C 1.6%             relate the reaction rate k with the change in DP (1) [12].
           1000
                                                         120°C 2.7%             Emsley [11] and Lundgaard [9] assumed the fall in DP is
                                                         140°C 0.5%
                                                                                linear until it levels off at 200. Consequently, k is the gradient
DP value

            800
                                                                                of a plot of 1/DPt – 1/DP0 from 0 to 4, from the start of the
            600                                                                 aging (DP ≈ 1400) until the DP has fallen to 200.
                                                                                   Origin 6.0 was used to plot Figures 5 to 7. The ± 2.5 % error
            400
                                                                                bars used in Figures 2 – 4 were used to plot the boundaries
            200
                                                                                caused by measurement precision. Either an interpolation or
                                                                                an extrapolation was performed to determine the aging time
              0                                                                 when the DP had fallen to 200. Aging rate k was then
                  0   500   1000    1500     2000       2500   3000     3500    determined using equation (1). The calculated aging rates are
                                   Aging time (hours)                           given in Tables 3 - 5. The calculations for Kraft paper are
Figure 2. DP of Grade 3 presspaper insulation as a function of temperature      from [1] and [2]. The higher k of Grade 3, compared to that of
and insulation wetness for low oxygen (< 7000 ppm).                             Kraft, indicates that it is aging slightly faster under these
                                                                                conditions.
           1600                                                                                              6
                                                                                                                                                            Temperature and estimated
           1400                                                                                                                                                paper water content
                                            Temperature and estimated                                        5                                                          o
                                               paper water content                                                                                                   100 C 2.7%
           1200                                      100°C 1.6%
                                                                                                                                                                        o
                                                                                                                                                                     120 C 1.6%
                                                                                                                                                                        o
                                                     120°C 0.5%                                                                                                      120 C 2.7%
                                                                                  (1/DP(t)-1/DP(0)) x 1000

                                                                                                             4
           1000                                      120°C 1.6%                                                                                                         o
                                                                                                                                                                     140 C 0.5%
                                                     120°C 2.7%
DP value

           800                                                                                               3

           600
                                                                                                             2
           400

           200                                                                                               1

             0
                                                                                                             0
                  0   500   1000     1500     2000      2500    3000     3500
                                                                                                                 0       500    1000     1500      2000       2500      3000      3500
                                   Aging time (hours)                                                                                  Aging time (hours)
Figure 3. DP of Grade 3 presspaper insulation as a function of temperature      Figure 5. 1/DPt –DP0 versus time relationship for Grade 3 presspaper in Shell
and insulation wetness for medium oxygen (7,000 – 14,000 ppm).                  Diala AX with low oxygen (< 7,000 ppm).
IEEE Transactions on Dielectrics and Electrical Insulation                                            Vol. 21, No. 5; October 2014                                       2359
                                     6
                                                                               Temperature and estimated                5 ANALYSIS OF PAPER AGING
                                                                                  paper water content
                                                                                                                  To determine the A-value two methods can be used. The
                                     5                                                  100°C 1.6%
                                                                                        120°C 0.5%             first method is to plot       against 1/ , this gives a line of
                                                                                        120°C 1.6%             form                where the gradient is       / and the y-
                                                                                        120°C 2.7%
                                     4                                                                         intercept is       , shown in equation (5). Since is 8.314
(1/DP(t)-1/DP(0) x 1000)

                                                                                                               J/mol, the gradient should be close to -13,000.
                                     3

                                                                                                                                     ln   ln                               (5)
                                     2

                                                                                                                  The second method to find the A-value involves the
                                     1                                                                         activation energy being known, and therefore equation (3)
                                                                                                               can be rearranged to calculate A. We used an activation
                                                                                                               energy of 111 kJ/mol, which has been confirmed by
                                     0
                                         0   500   1000    1500      2000       2500     3000     3500         Lundgaard in [9].
                                                          Aging time (hours)                                      Figure 8 shows the ln(k) versus 1/Temperature
Figure 6. 1/DPt –DP0 versus time relationship for Grade 3 presspaper in Shell                                  relationship. The five gradients in Figure 8 were used to find
Diala AX with medium oxygen (7,000 – 14,000 ppm).                                                              the 95 % confidence limits of the activation energy. Their
                                     8
                                                                                                               mean ( ) and standard deviation ( ) were calculated, being -
                                     7
                                                                                Temperature and estimated      12,722 and 2533 respectively. The 95 % confidence limits
                                                                                   paper water content
                                                                                            o
                                                                                                               were found using          1.96   ⁄√ , where is the number
                                                                                         100 C 0.5%
                                     6                                                      o
                                                                                         100 C 1.6%
                                                                                                               of observations.
                                                                                            o
                                                                                         100 C 2.7%               We calculated the 95 % confidence limits of the line
          (1/DP(t)-1/DP(0)) x 1000

                                     5                                                      o
                                                                                         100 C 0.5%
                                                                                            o
                                                                                                               gradients to be -10502 and -14943. When multiplied by gas
                                                                                         100 C 1.6%
                                                                                            o
                                                                                         100 C 2.7%
                                                                                                               coefficient , we calculated the mean activation energy of
                                     4
                                                                                                               this dataset to be 106 kJ/mol. The upper and lower
                                     3
                                                                                                               confidence intervals are 124 kJ/mol and 87 kJ/mol. The
                                                                                                               activation energy of 111 kJ/mol, confirmed by Lundgaard
                                     2                                                                         [9], falls within this range.
                                                                                                                  Equation (3) was used to calculate A-values for each
                                     1
                                                                                                               temperature investigated, based on an activation energy of
                                                                                                               111 kJ/mol (from [9]). The range in rate , given in Tables 3
                                     0
                                         0   500   1000     1500      2000       2500     3000       3500
                                                                                                               – 5, was used to determine both maximum and minimum A-
                                                          Aging time (hours)                                   values for each condition. The average A-value for each
Figure 7. 1/DPt –DP0 versus time relationship for Grade 3 presspaper in Shell                                  condition of oxygen level and water content, and the
Diala AX with high oxygen (16,500 – 25,000 ppm).                                                               tolerance, is given in Table 6.

                 Table 3. Pseudo-zero order reaction rates determined from 1/DPt – 1/DP0 versus time relationships for Grade 3 presspaper, low oxygen. Kraft data from [1].
                T (°C)                                                              Estimated paper water content
                                                                                                 (%)
                                               0.5                                              1.6                                               2.7
                                Grade 3                    Kraft                  Grade 3                    Kraft                  Grade 3                   Kraft
                100                 -                        -                       -                         -               0.9E-06 ± 0.05E-06            0.6E-06
                120                 -                        -               1.5E-06 ± 0.05E-6             1.5E-06             4.6E-06 ± 0.2E-06             2.4E-06
                140        1.1E-06 ± 0.05E-06            1.2E-06                     -                         -                        -                        -
       Table 4. Pseudo-zero order reaction rates determined from 1/DPt – 1/DP0 versus time relationships for Grade 3 presspaper, medium oxygen. Kraft data from [2]
        T (°C)                                                              Estimated paper water content
                                                                                         (%)
                                       0.5                                              1.6                                              2.7
                        Grade 3                    Kraft                  Grade 3                   Kraft                   Grade 3                  Kraft
        100                 -                        -              0.7E-06 ± 0.02E-06             0.5E-06                      -                      -
        120        1.6E-06 ± 0.01E-06             1.4E-06           3.7E-06 ± 0.02E-06             3.1E-06            12.0E-06 ± 0.5E-06           9.1E-06
                 Table 5. Pseudo-zero order reaction rates determined from 1/DPt – 1/DP0 versus time relationships for Grade 3 presspaper, high oxygen. Kraft data from [2]
                T (°C)                                                              Estimated paper water content
                                                                                                 (%)
                                               0.5                                              1.6                                                2.7
                                Grade 3                    Kraft                  Grade 3                    Kraft                  Grade 3                    Kraft
                100        0.6E-06 ± 0.02E-06            0.4E-06            1.1E-06 ± 0.03E-06              0.7E-06            1.9E-06 ± 0.2E-06             1.3E-06
                120        2.2E-06 ± 0.01E-06            1.5E-06             8.9E-06 ± 0.6E-06              6.2E-06             14.0E-06 ± 1E-06             8.3E-06
2360                                                  N. Lelekakis et al.: Aging Rate of Grade 3 Presspaper Insulation used in Power Transformers
                                                                                                                                   Table 7. Coefficients B and C for use in (6)
           2.7% low oxygen         1.6% medium oxygen 0.5% high oxygen                                                 Oxygen
                                                                                                                                         Boundary               B                  C
           1.6% high oxygen        2.7% high oxygen                                                                     level
                                                                                                                                                                    6
                                                                                                                                          Lower             52×10                 1.37
                 140°C                   120°C                         100°C                                             Low             Average            62×106                1.43
                   I                       I                             I
           -10                                                                                                                            Upper             68×106                1.49
             0.0024             0.0025             0.0026                  0.0027                                                         Lower             61×106                0.73
                                   Temperature (1/K)                                                                   Medium            Average            63×106                0.78
           -11                                                                                                                            Upper             64×106                0.83
                 y = -14855x + 26.651
                                                                                                                                          Lower             914×106               0.74
                 y = -15399x + 27.554                                                                                   High             Average           1,346×106              0.66
           -12                                                                                                                            Upper            1,785×106              0.61
                 y = -11534x + 17.065
   ln(k)

                 y = -12642x + 19.656
           -13
                 y = -9182.1x + 10.347
                                                                                                                                       G3 low oxygen
                                                                                                                                       G3 Medium oxygen
           -14                                                                                                        8E+09
                                                                                                                                       G3 high oxygen
                                                                                                                                       K low oxygen
                                                                                                                                       K high oxygen
           -15
                                                                                                                      6E+09

                                                                                     A-value (h-1)
Figure 8. Plot of reaction rate constant, k, against the inverse of temperature
in Kelvin, as a function of cellulose water content and oxygen.
                                                                                                                      4E+09
Table 6. Recalculated A-values, in h-1, based on an activation energy of 111
kJ/mol.
                              Estimated paper water content
                                            (%)                                                                       2E+09
        Oxygen
                         0.5                1.6               2.7
         level
                      1.28E+08           8.25E+08          3.00E+09
         Low                                                                                                          0E+00
                        ±7E06              ±4E08             ±6E08
                                                                                                                              0         0.5         1          1.5          2          2.5           3
                      9.26E+08           2.19E+09          5.20E+09                                                                                 Water content of paper (%)
       Medium
                        ±5E07              ±2E08             ±9E08
                      1.74E+09           4.44E+09          7.41E+09                 Figure 9. A-values for Grade 3 presspaper calculated using Ea = 111 kJ/mol.
         High
                        ±5E08              ±9E08             ±1E09

   The A-values for the presspaper are shown in Figure 9.                                                                                                                                      (9)
They are similar, however slightly higher, to those we
determined for normal Kraft paper in our previous work,                               Life curves for the presspaper, at different paper water
shown in the same figure [1, 2]. The A-values for Kraft were                        content, were built using the determined A-values, shown in
all less than 5 x 10⁹ h-1, whereas under the same conditions the                    Figures 10 to 12. The boundaries for A-values were used to
A-values for Grade 3 reach nearly 8 x 10⁹ h-1. The difference                       construct error bars in life expectancy.
between the A-values at high water implies that the reaction                                                            100
rate for Grade 3 is slightly higher than that of normal Kraft
paper.                                                                                                                                                                                   Paper water
                                                                                            Life Expectancy (years)

                                                                                                                         10                                                                content
   Equations were derived using equation (6) to interpolate A-
values for the different conditions of water and oxygen, where                                                                                                                                 0.5%
w is the water content of paper in percent. Coefficients B and                                                            1                                                                    1.0%
C were derived for each level of oxygen, given in Table 7.                                                                                                                                     1.5%
Upper and lower boundaries for these coefficients were                                                                                                                                         2.0%
determined based on the range of A-values which were                                                                    0.1
                                                                                                                                                                                               3.0%
calculated from measurements.
                                                             (6)                                                       0.01
                                                                                                                              90         100         110        120              130
                                                                                                                                               Temperature (°C)
                            6 LIFE CURVES
  The end of life of the presspaper at a given temperature was
calculated using equation (9), where              is 1400 and                       Figure 10. Life curves for Grade 3 presspaper in low oxygen (< 7,000 ppm)
       is 200.                                                                      using interpolated A-values from Monash, based on Ea= 111 kJ/mol.
IEEE Transactions on Dielectrics and Electrical Insulation                             Vol. 21, No. 5; October 2014                                                                                      2361
                              100                                                               is practically equal. At high oxygen levels the life expectancy
                                                                                                of Grade 3 was only slightly less than that of Kraft (although
                                                                                Paper water
                                                                                                still within the error boundary).
  Life Expectancy (years)

                               10                                                 content

                                                                                       0.5%                                       100         Low oxygen, 0.5% water content
                                1                                                      1.0%                                                                                             Paper, oxygen level
                                                                                                                                                                      Low oxygen,
                                                                                       1.5%                                                                                              and water content
                                                                                                                                                                      2% water
                                                                                       2.0%                                        10                                 content, both

                                                                                                      Life Expectancy (years)
                               0.1                                                                                                                                    G3 and K                G3 low 0.5%
                                                                                       3.0%
                                                                                                                                                                                              G3 low 2.0%
                              0.01                                                                                                   1                                                        G3 high 2.0%
                                     90   100         110        120      130
                                                                                                                                                                                              K low 0.5%
                                                Temperature (°C)
Figure 11. Life curves for Grade 3 presspaper in medium oxygen (7000 –                                                                                                                        K low 2.0%
14,000 ppm) using interpolated A-values from Monash, based on Ea= 111                                                              0.1                                                        K high 2.0%
kJ/mol.                                                                                                                                       High oxygen,
                                                                                                                                              2% water
                              100
                                                                                                                                              content
                                                                                                                                 0.01
                                                                                                                                         90        100     110      120         130
    Life Expectancy (years)

                                                                                Paper water
                               10                                                 content                                                            Temperature (°C)

                                                                                       0.5%     Figure 14. Comparison of life expectancy of Kraft (K) and Grade 3 (G3)
                                 1                                                              paper with 0.5 and 2.0 % water in low and high oxygen concentration.
                                                                                       1.0%
                                                                                       1.5%
                               0.1                                                     2.0%                                                          8 CONCLUSIONS
                                                                                       3.0%        Relationships between the A-value (pre-exponential factor),
                                                                                                water content of paper and oxygen content of oil were
                              0.01
                                     90   100         110        120      130
                                                                                                developed. Similarly to Kraft and thermally upgraded Kraft, the
                                                Temperature (°C)                                A-value is significantly affected by the concentration of oxygen
                                                                                                dissolved in the oil, and thus the A-value appropriate for the
Figure 12. Life curves for Grade 3 presspaper in high oxygen (16,500 –
25,000 ppm) using interpolated A-values from Monash, based on Ea= 111                           specific system must be used.
kJ/mol.                                                                                            The life expectancy of Grade 3 presspaper is very near to that
                                                                                                of normal Kraft paper. Under low levels of oxygen the life
 7 EFFECT OF OXYGEN ON LIFE CURVES                                                              expectancies were virtually equal. At high oxygen the life
   FOR GRADE 3 PRESSPAPER OF THE                                                                expectancy of Kraft was about 30 % longer than that of Grade
        SAME WATER CONTENT                                                                      3, for instance at 90 °C Grade 3 lasted 1 year, the Kraft paper
  The life expectancy of Grade 3 presspaper with the same                                       took 1.3 years to reach end of life.
water content of 1.5 % is compared in Figure 13. Similar to
Kraft paper, oxygen has a clear effect on the rate of aging of                                                                                    ACKNOWLEDGMENT
paper. It is therefore advisable to minimize the interaction                                       The authors wish to thank EPRI who funded this project.
between oxygen and the oil within a transformer.                                                The authors express their appreciation to the staff of Monash
                                                                                                University who supported this project, in particular Arthur
                              100                                                               Lowery, Pam Dickinson, Martin Linzner, David Morgan,
                                                                         Low oxygen             Valery Davydov and Andrew Reykherdt. We would also like
                                                                                                to thank Yuriy Odarenko, of Wilson Transformer Company,
  Life Expectancy (years)

                               10                                        Med oxygen

                                                                         High oxygen
                                                                                                for the many interesting discussions we had with him on
                                                                                                modelling DP and the practical considerations of investigating
                                1
                                                                                                paper degradation from a manufacturer’s viewpoint.

                               0.1                                                                                                                      REFERENCES
                                                                                                [1]                             N. Lelekakis, D. Martin, and J. Wijaya, “Ageing rate of paper insulation used in
                                                                                                                                power transformers. Part 1: oil/paper system with low oxygen concentration”,
                              0.01                                                                                              IEEE Trans. Dielectr. Electr. Insul., Vol. 19, pp. 1999-2008, 2012.
                                     90                     110                        130      [2]                             N. Lelekakis, D. Martin, and J. Wijaya, “Ageing rate of paper insulation used in
                                                      Temperature (°C)                                                          power transformers. Part 2: oil/paper system with medium and high oxygen
                                                                                                                                concentration”, IEEE Trans. Dielectr. Electr. Insul., Vol. 19, pp. 2009-2018,
Figure 13. Comparison of life expectancy of Grade 3 presspaper with 1.5 %                                                       2012.
water in low, medium and high oxygen concentration.                                             [3]                             IEC standard 60641-3-2, “Specification for pressboard and presspaper for
                                                                                                                                electrical purposes – Part 3: Specifications for individual materials – Sheet 2:
   Comparing Grade 3 with normal Kraft paper, Figure 14,                                                                        Requirements for presspaper, types P.2.1, P.4.1, P.4.2, P.4.3 and P.6.1”, IEC,
                                                                                                                                Switzerland, 2007.
shows that their life expectancy is very similar. The error bars                                [4]                             C. P. McShane, K. J. Rapp, and J. Luksich, “Aging of Cotton/Kraft
for Grade 3 cross over the traces for Kraft paper. Under low                                                                    Blend Insulation Paper in Natural Ester Dielectric Fluid”, presented at
oxygen levels, 0.5 and 2 % water content, their life expectancy                                                                 TechCon, Australia, 2003.
2362                                                        N. Lelekakis et al.: Aging Rate of Grade 3 Presspaper Insulation used in Power Transformers
[5]    H. P. Moser and V. Dahinden, Transformerboard II, Chapter S,                                                Jaury Wijaya was born in Baubau, Indonesia. He
       Weidmann, Switzerland, 1987.                                                                                received the B.Eng. degree in electrical engineering
[6]    T. V. Oommen and T. A. Prevost, “Cellulose Insulation in Oil-Filled                                         from Petra Christian University, Surabaya,
       Power Transformers: Part I History and Development”, IEEE Electr. Insul.                                    Indonesia, in 1999, and the M.Eng.Sc. degree in
       Mag., Vol. 22, pp. 28-135, 2006.                                                                            electrical engineering from Monash University. He
[7]    W. J. McNutt, “Insulation thermal life considerations for transformer                                       was a technical officer in the Department of
       loading guides”, IEEE Trans. Power Delivery, Vol. 7, pp. 392-401, 1992.                                     Electrical and Computer Systems Engineering at
[8]    A. M. Emsley, X. Xiao, R. J. Heywood, and M. Ali, “Degradation of                                           Monash from August 2004 to March 2009, and is
       cellulosic insulation in power transformers. Part 3: Effects of oxygen and                                  currently pursuing the Ph.D. degree in the
       water on ageing in oil”, Proc. IEE Sci., Measur. Techn., Vol. 147, pp. 115-                                 Department.
       119, 2000.
[9]    L. E. Lundgaard, W. Hansen, D. Linhjell, and T. J. Painter, “Aging of oil-
       impregnated paper in power transformers”, IEEE Trans. Power Delivery,
       Vol. 19, pp. 230-239, 2004.
[10]   CIGRE Task Force D1.01.10, “Ageing of cellulose in mineral-oil insulated
       transformers”, CIGRE Brochure No. 323, 2007.                                                                Dejan Susa (S’05-M’06) is the special advisor for
[11]   A. M. Emsley and G. C. Stevens, “Kinetics and mechanisms of the low-                                        power transformers at Statnett (Norwegian
       temperature degradation of cellulose”, Cellulose, Vol. 1, pp. 26-56, 1994.                                  transmission system operator). He received his
[12]   A. Ekenstam, “The behaviour of cellulose in mineral acid solutions:                                         D.Eng. degree in electrical engineering from the
       kinetic study of the decomposition of cellulose in acid solutions”, Berichte                                University of Nis, Nis, Serbia in 2000, and the
       der deutschen chemischen Gesellschaft, Vol. 69, pp. 553-559, 1936.                                          M.Sc. and D.Sc. degrees from the Helsinki
[13]   P. Calvini, “The influence of levelling-off degree of polymerisation on the                                 University of Technology, Espoo, Finland, in 2002
       kinetics of cellulose degradation”, Cellulose, Vol. 12, pp. 445-447, 2005.                                  and 2005, respectively. He was with the Power
[14]   IEC standard 60666 Ed. 1, “Detection and determination of specified anti-             Systems Laboratory, Helsinki University of Technology, from 2001 to
       oxidant additives in insulating oils”, IEC, Switzerland, 1979.                        2006. He joined the Centre for Power Transformer Monitoring,
[15]   W. A. Fessler, T. O. Rouse, W. J. McNutt, and O. R. Compton, “A refined               Diagnostic and Life Management, Monash University, Clayton, Australia,
       mathematical model for prediction of bubble evolution in transformers”,               from 2006 to 2007, and he was with SINTEF Energy Research
       IEEE Trans. Power Delivery, Vol. 4, pp. 391-404, 1989.                                Department, Trondheim, Norway from 2007 to 2012. Dr. Susa is a
[16]   N. Lelekakis, D. Martin, W. Guo, J. Wijaya, and M. Lee, “A field study of             member of Norwegian IEC National Committee, Convenor of the
       two online dry-out methods for power transformers”, IEEE Electr. Insul.               recently established IEC TC 14 MT1 with the task to prepare the next
       Mag., Vol. 28, No. 1, pp. 32-39, 2012.                                                version of the IEC loading guide 60076-7 and the TF leader of “Dynamic
[17]   ASTM D3612-02, “Standard Test Method for Analysis of Gases Dissolved                  Thermal Modeling” in the working group Cigre WG A2.38 – Thermal
       in Electrical Insulating Oil by Gas Chromatography”, ASTM International,              Modeling.
       2002.
[18]   ASTM D4243-99, “Standard Test Method for Measurement of Average
       Viscometric Degree of Polymerization of New and Aged Electrical Papers
       and Boards”, ASTM International, 1999.
                                                                                                                   Christoph Krause was born in Schaffhausen,
                           Nick Lelekakis received a Bachelor of Science with
                                                                                                                   Switzerland in 1956. He received the B.Sc. and the
                           Honours degree in Chemistry in 1995 from Monash
                                                                                                                   M.Sc. degrees from the ETH (Federal Polytechnic
                           University, Australia. He then moved to Electrical and
                                                                                                                   University) Zürich, Switzerland. He worked for
                           Computer Systems Engineering where he studied moisture
                                                                                                                   seven years at the high-voltage laboratory of Brown
                           migration in transformer insulation systems. He conducted
                                                                                                                   Boveri in Baden Switzerland, developing metal
                           many experiments investigating the effect of temperature
                                                                                                                   oxide surge arresters. He is currently vice president
                           and moisture on the risk of bubbles and water droplets
                                                                                                                   of the pressboard         manufacturing     company
                           formed in power transformers. Between 2004 and 2008 he
                                                                                                                   Weidmann      Electrical    Technology      AG     in
                           conducted a large research project investigating the effects of
                                                                                                                   Switzerland, where he is employed since 1989. He is
                           temperature, moisture and oxygen on the degradation of
                                                                                             head of the technology and innovation department, which comprises
paper insulation for developing a life estimation tool for transformers. Between 2009
                                                                                             laboratories, transformer design and engineering services.
and 2012 he was the project leader in a number of field research projects involving
Australian utilities on dry-out, aging and failure investigations of power transformers.
In 2013 he is leading the transformer research centre at Monash University to develop
a transformer life tool to access moisture, dry-out and insulation age.

                         Daniel Martin received the B.Eng. degree in electrical and
                         electronic engineering (with study abroad in Germany) from                                Tapan K. Saha (SM’97) was born in Bangladesh
                         the University of Brighton, UK in 2000. He joined Racal                                   and immigrated to Australia in 1989. Currently, he
                         Electronics, which became the international electronics                                   is Professor of Electrical Engineering in the School
                         company Thales, working on communication and aircraft                                     of Information Technology and Electrical
                         systems. He left Thales in 2004 to pursue his Ph.D. degree in                             Engineering, University of Queensland, Brisbane,
                         electrical insulation at the University of Manchester, UK. He                             Australia. Before joining the University of
                         investigated the suitability of using vegetable oils and                                  Queensland, he taught at the Bangladesh University
                         synthetic esters as substitutes for mineral oil within large                              of Engineering and Technology, Dhaka, for three-
                         power transformers, and graduated in 2008. He joined                                      and half years and then at James Cook University,
Monash University in Australia working on transformer condition monitoring,                                        Townsville, Australia, for two and half years. His
quickly assuming the directorship of the Centre for Power Transformer Monitoring.            research interests include power systems, power quality, and condition
At the beginning of 2013 he moved to University of Queensland, Australia, working            monitoring of electrical plants. Prof. Saha is a Fellow of the Institution of
on a transformer condition monitoring project funded by the local Utilities.                 Engineers, Australia.
You can also read