Investigation of the impacts of design parameters on thermal performance of buildings in cold climate
←
→
Page content transcription
If your browser does not render page correctly, please read the page content below
E3S Web of Conferences , 07002 (2021)                                                                 https://doi.org/10.1051/e3sconf/202124607002
Cold Climate HVAC & Energy 2021

                   Investigation of the impacts of design parameters on
                     thermal performance of buildings in cold climate
            Rashid Gaitov1, Serik Tokbolat2,*, Hua Zhong2, Mohamad Mustafa3
            1
             Dept. of Civil and Environmental Engineering, Nazarbayev University, 53 Kabanbay Batyr Ave, Nur-Sultan, 010000,
            Kazakhstan
            2
             Dept. of Construction Management, Nottingham Trent University, 50 Shakespeare street, Nottingham NG1 4FQ, United
            Kingdom
            3
             Dept. of Building, Energy and Material Technology, UiT The Arctic University of Norway, PO Box 385, Narvik, 8514,
            Norway

                          Abstract. While design optimization of buildings seeks to improve energy efficiency and, thus,
                          leads to greenhouse gas emissions reduction, the thermal performance of buildings can be
                          compromised. Thermal performance is an important aspect as it directly affects the health and well-
                          being of occupants. This study aims to investigate using a simple simulation tool to examine the
                          correlation between a set of building physical design parameters such as orientation, shading and
                          shape, optimization of which helps to make a positive impact on the thermal performance of the
                          building in a cold climate zone. The thermal performance simulation tool Passive Design Assistant
                          (PDA) was used to build a simulation model and test the interdependence between the design
                          parameters and thermal performance. The results indicate that modifications of building's
                          parameters such as orientation and shape or the addition of shadings lead to improvements of the
                          internal thermal temperature, heat gain and loss, hence the optimal parameters should prevail. A
                          case study for cold climate is analyzed, in Nur-Sultan, Kazakhstan, the optimal orientation for the
                          squared building is 30° from East to South (building rotated 120°) and the optimal building’s shape
                          is rectangular, which attracts up to 2.6 times higher solar gains than the square one. Moreover, the
                          use of shadings can regulate the internal temperature of the building by 2 °C. General
                          recommendations based on the findings are made and could be considered in the earlier stage of
                          building design and construction processes.

        1 Introduction                                                         Various studies have proved that low thermal comfort
                                                                               levels can negatively affect the occupants’ productivity,
            Rapid urbanization and population growth processes                 health and overall thermal satisfaction [8], [9]. To ensure
        in both developed and developing countries lead to                     comfortable thermal conditions, for example, indoor
        increasing pressure on the building sector in terms of the             temperature, air velocity, humidity, etc., various
        need for new buildings. However, a mere provision of                   stakeholders need to address these issues in their
        “square meters” is not a sufficient measure. The                       respective work stages. In this regard, the role of early
        continuously evolving regulations and construction                     design was reported to be profoundly critical. According
        standards, especially in developed countries, tend to                  to Echenagucia [10], the design stage presents the greatest
        demand delivering more sustainable, energy-efficient and               chance to ensure high thermal performance by a building.
        thermally comfortable buildings for occupants than before              Decisions made at this stage do not only define the future
        [1]-[3]. The fact that globally buildings are responsible for          performance of a building but in many instances cannot
        nearly 40% of the total energy consumption and 35% of                  be changed at later stages. For example, building
        carbon dioxide (CO2) emissions justifies such demands                  orientation or shape must be decided at this stage.
        [4], [5]. Along with the role of energy use and building                   Previous studies have looked at the impact of
        sustainability, thermal comfort is becoming a prominent                orientation on energy use [11], facade types on
        aspect in recent years due to improving living condition               environmental performance [3], envelope components on
        requirements and evolving research around the topic of                 energy use [12], building shape on energy efficiency and
        human well-being [6].                                                  wind safety [13]. There is a lack of studies around the
            According to the American Society of Heating,                      thermal comfort aspect in the context of the extreme cold
        Refrigerating and Air-Conditioning Engineers [7],                      climate zone such as Kazakhstan. Considering the
        thermal comfort is defined as the “degree of subjective                extreme weather conditions with hot summers and cold
        satisfaction of humans with the thermal environment”.                  winters in the case study city, Nur-Sultan, Kazakhstan,

            *Corresponding author: serik.tokbolat@ntu.ac.uk

   © The Authors, published by EDP Sciences. This is an open access article distributed under the terms of the Creative Commons Attribution License 4.0
   (http://creativecommons.org/licenses/by/4.0/).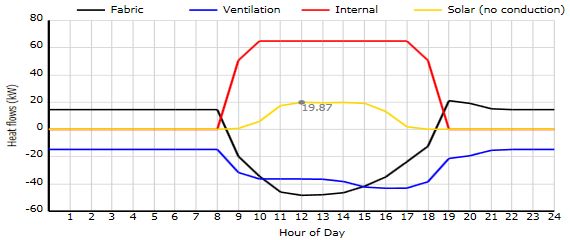
E3S Web of Conferences , 07002 (2021)                                                             https://doi.org/10.1051/e3sconf/202124607002
Cold Climate HVAC & Energy 2021

       there is a high demand for energy considerations as                  2 Methodology
       heating and cooling demands can cause excessive energy
       consumption. Therefore, this study considers building
       orientation, shading and shape and assesses how their                2.1 Input data
       modification affects the thermal performance in terms of                 The PDA simulation tool was used to develop
       indoor temperature and heat balance. Such analysis is                simulation models to perform the analysis. The models
       hard to perform using simple calculations and requires               were populated with the data relevant to the case study
       adopting simulation tools.                                           locality and buildings’ assumed parameters. The location
           Over the past 60 years, literally hundreds of Building           of the model is Nur-Sultan, the capital city of Kazakhstan.
       Energy Simulation (BES) software have been developed,                Nur-Sultan is the second coldest capital in the world [15].
       such as IES-VE, TAS, Hevacomp, EnergyPlus,                           Specific location details are provided in Table 1. The
       TRANSYS, doe-2, and are in use throughout the building               highest temperature that was recorded in Nur-Sultan in
       energy community. BES is a widely used tool and has                  July is 41.6 °C and the lowest temperature was -51.6 °C
       played an important role in improving energy efficiency              in January [16]. The other parameters concerning the
       and optimising building-performance. The core tools in               outside temperature, humidity, wind velocity were
       the building energy field are the whole-building energy              assumed according to the location’s latitude and altitude
       simulation programs that provide users with key building             and obtained from the software library.
       performance indicators such as energy use and demand,
       temperature, humidity, and costs. The commercial BES                                 Table 1. Location details [17]
       software is instrumental for comprehensive design
       purposes, not only because it covers               legislative                     Location         Nur-Sultan
       requirements such as Building Regulations or local codes
       (Part L in England and Wales, Section 6 in Scotland and                            Latitude         51° 10'
       Part F in Northern Ireland), but also due to its ability to
                                                                                          Altitude         361 m
       rate the environmental performance or impact of
       buildings using such rating systems as BREEAM, LEED
       or GreenStar. In the UK, IES-VE, TAS and Hevacomp                       The climate parameters for selected months used for
       have become the first 3 software tools approved by the               simulation are provided in Table 2.
       Department of Communities and Local Government for
                                                                                       Table 2. Climate parameters [16], [18]
       Part L building regulations calculation and BREEAM
       assessment. The BES software will typically provide a                                      July      September        December
       fast-calculated load assessment based on simple CIBSE
       Admittance or ASHRAE Heat Balance methods or more                       Avg Ground            20            15           -15
       detailed dynamic thermal modelling, which determines                    Temp (°C)
       how much energy the building will consume during peak
                                                                              Max Dry Bulb           33            29           -8
       heating and cooling situations. The application of these                Temp (°C)
       tools in the development of buildings is prevalent across
       all disciplines, so providing the elemental information                Min Dry Bulb           8             5            -24
       required to evaluate building performance. Incorporating                Temp (°C)
       building performance analysis into the new-build and
       refurbishment design process allows architects and                       The building design parameters used for the models of
       engineers to easily assess the comparative merits of                 different shapes (square and rectangular) are shown in
       different passive solar principles and high-performance              Table 3. It should be noted that in case of square building
       building technologies. However, these commercial                     simulation for various orientations, a window was added
       simulation software tools are expensive and not very user            only to one side (the North facing window). In the case of
       friendly for architects or stakeholders without specific             comparison of different shaped building models, the
       building physical knowledge and simulation experience.               windows were assumed to be on all sides. Figure 1 shows
       Also, they have comprehensive functions that require                 the initial orientation of 0 degrees assigned to the
       highly detailed inputs and long simulation time for                  Northern orientation (in the case of the rectangle building
       generating the accurate results, besides, it is incompatible         it was assumed that the elongated wall was facing to the
       to the architects or clients iterative working need for              North).
       exploring multiple alternatives at an early stage that                   The models were assigned to minimal HVAC system
       requires manageable input [14].                                      values (Table 3) in order to maximize the influence of the
           For all building projects, it is critically important at         analyzed parameters such as model orientation and shape.
       their earliest stages that strategic decisions are made
       which will determine the success of the development in
       terms of its energy efficiency and all-round building
       performance. Decisions made later in the building process
       are far more costly and potentially less effective. The
       important step is to undertake some form of building
       performance modelling early in the process by simple and
       user-friendly tools.                                                          Figure 1. Illustration of the model building

                                                                        2
E3S Web of Conferences , 07002 (2021) https://doi.org/10.1051/e3sconf/202124607002
Cold Climate HVAC & Energy 2021
Table 3. Building model parameters assumptions divided into one-hour intervals, and the results are shown
as hourly monthly-averages.
Dimensions Square Rectangular This paper aims to use the PDA tool to examine the
optimal passive design for thermal comfort in a typical
Length (m) 45 101.25 cold climate zone based on the major passive design
principles. The model examines the thermal response of a
Width (m) 45 20
single square or rectangular space to the different
elements important in the development of a passive design
Area (m2) 2025 2025
strategy, such as Orientation, fenestration, shading,
Height (m) 3.7 3.7 ventilation, thermal mass, internal gains and climate
conditions.
Occupancy (m2/person) 10 10 The limitations of the results generated by PDA will
be discussed. The results of the simulation provide the
Lighting Power Density (W/m2) 10 10 data about solar, internal, ventilation and fabric heat
flows. The overall heat balance, which is the sum of the
Time Lights On (h) 8 8 heat losses, is equal to the sum of the heat gains. Passive
design is the reduction of the heat losses of the building.
Wall construction U/Y-Values 0.25/1 0.25/1 The free heat gains are then almost sufficient to keep the
(W/m2K) temperature at a comfortable level. However, due to the
scope of this study, only solar heat flows are considered.
Walls 1&3 window area (m2) 42 94
Walls 2&4 window area (m2) 42 18.5 3 Results and Discussions
Ventilation Rate (ac/h) 1 1
3.1 July - building orientation analysis
Solar factor 0.6 0.6
The PDA software provides the results of the analysis
U-Value (W/m2K) 1.54 1.54 of the squared building’s indoor climate changes affected
by the rotation of the building (Figure 2). The side with
the window is considered for the orientation variations
2.2 Simulation tool (only one side of the square building has a window).
Figure 3 shows monthly-averaged hourly temperature
Compared with other commercial BES software, values. The results presented in the figure show that the
Passive Design Assistant (PDA) is a freely available highest indoor temperature is when the building is rotated
software tool developed to enable conducting simple to 120° (30° from East to South). This orientation
dynamic thermal calculations in a way that is accessible represents the largest sunlight absorptive capacity and
to a broad range of users, e.g. engineers, architects, and results in the highest maximum indoor temperature for
other construction professionals. PDA is to elucidate the squared building. The maximum temperature equals
principles of passive design and to enable basic design 40.11 °C. On the other side, the lowest building
calculations to be conducted, for instance, the assessment temperature refers to 0 degree orientation (North facing),
of indoor temperatures in naturally ventilated buildings being 37.42 °C. Therefore, the change of building's
and to compare the energy consumptions for different orientation may result in a 6.7% decrease in internal
building shapes with the same floor areas [19]. temperature.
Furthermore, PDA is a user-friendly tool that can be It should be noted that since the building models were
used to demonstrate the feasibility and benefits of passive built based on simple assumptions for the building
design in simple spaces. The tool will help inform without heating, ventilation and air-conditioning systems,
designers about the principles of passive design in the the internal temperature values may not be equal to
earlier building design stage for the following parameters: required standards.
1. Orientation, 2. Fenestration and shading, 3. Thermal However, since the design parameters were altered
mass, 4. Internal gains, 5. Building forms. 6. Ventilation. and tested assuming all other parameters were constant
The calculation method used in PDA is the standard and equal to the values, automatically generated by the
CIBSE Simple Dynamic Thermal model. Some further PDA software. This fact might have caused extremely
enhancements of the CIBSE method have also been high indoor temperature values. Therefore, the results of
implemented in PDA. this study should be considered carefully.
However, The CIBSE Dynamic Thermal Model
method assumes that all internal and external loads are
represented by a mean or steady-state component plus an
alternating component that has 24-hours. The model,
therefore, only generates results for a repeating 24-hour
period that is a limitation when analyzing results using
PDA, which should be observed by all users [20]. The
simulation has the time span of one calendar month
3E3S Web of Conferences , 07002 (2021) https://doi.org/10.1051/e3sconf/202124607002
Cold Climate HVAC & Energy 2021
Figure 2. Maximum internal temperature for a square model’s
different orientations in July
Figure 4. The effect of shadings on the 120° (30° from East to
South) orientated model
Figure 5 shows the relationship between the maximum
solar heat gains of the squared building and the building's
orientation in Nur-Sultan in July. The values are average
for the month. The chart shows that the highest solar gain
in July is at 90° orientation (East), which corresponds to
18.01 kW (Figure 5). On the other side, the least result
a) 0° (North) orientation refers to the North facing orientation of the building,
which has only 4.03 kW of solar gain. The analysis of the
120° oriented model with shadings shows the 42.2%
decrease in solar heat gains.
b) 120° (30° from East to South) orientation
Figure 3. Temperature results for a squared building
The orientation of the building that showed the highest
maximum indoor temperature (120°) is analyzed with
addition of shadings. This orientation was chosen in order Figure 5. Maximum solar gains for model’s different
to see the maximum effect of adding shading by adding it orientations
to the side of the building, thus, the orientation with the
highest indoor temperature. The results show the effect of 3.2 July, September & December - building
the shadings on the room temperature in July (the hottest shape analysis
month). The use of 1 m long shadings on each of the
windows reduces the highest internal temperature by 4% Figure 6 shows the maximum internal temperatures of
(from 40.11 °C to 38.50 °C) as shown in Figure 4. The square and rectangular models during July, September,
results show the importance of using shadings, especially and December. The highest difference that stands out is in
in Nur-Sultan during high outdoor temperatures. December. Whereas, the maximum temperature in a
rectangular building is 8.45 °C, it is 1.88 °C for a squared
building. This is most likely related to the fact that
windows are located on all sides, in the case of squared
buildings, and winds are quite strong in Nur-Sultan, hence
the impact can be great. The rectangular shaped buildings'
shorter walls are facing West and East. Since the
4E3S Web of Conferences , 07002 (2021) https://doi.org/10.1051/e3sconf/202124607002
Cold Climate HVAC & Energy 2021
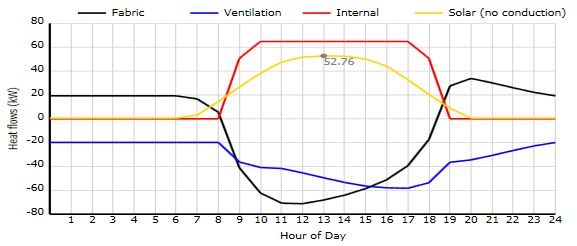
predominant winds in Nur-Sultan are from the West, the Figures 8 & 9 are the heat balance charts that show
building is less affected by wind, thus, causing less impact heat flow changes due to the fabric, sunlight, ventilation
to the internal temperature [21]. The difference in and internal heat flows during the day. The charts also
September is less noticeable, but significant enough to be show the difference in solar gains in December between
considered, being about 2 °C, which gives 4.9 % squared and rectangular models. Interestingly, the
difference. Finally, the analysis for July shows the least rectangular model absorbs much more energy than the
difference of 0.6%, where the temperatures for square and squared model, especially in cold seasons. In the middle
rectangular rooms are 42.22°C and 41.95 °C respectively. of the day, the solar heat flow into the rectangular building
To conclude, the results show that the internal peaks at 52.76 kW, which is 165% higher than that for the
temperature is most significantly affected by the square building. In addition, the heat flow into the
building's shape in low outdoor temperatures in rectangular building has a wider positive interval, starting
December. at 06:00 and finishing at 20:00 hours compared to the
square building, which has a shorter solar gain interval
ranging from 08:00 to 18:00 hours.
Figure 8. Heat balance chart for the squared building in
December
Figure 6. Maximum internal temperature in July, September
and December for squared and rectangular models.
Although the change of building shape from square to
rectangular significantly affects the internal temperature
most significantly in December, the heat gain differences
are high in all three months. Figure 7 shows the maximum
heat gains of square and rectangular models in three
different months, specifically, in July, September and
December. The rectangular model has higher values
regardless of the change of a month. Its highest heat gains
are in September and December, both being equal to 52.76
kW. In July, the rectangular model gains 42.23 kW,
whereas the square building has 28.2% less heat gain
(30.34 kW). For the squared model, the difference Figure 9. Heat balance chart for the rectangular building in
between the highest (in September) and the lowest (in December
December) heat gains is 42.9%. The high difference is
mostly due to the changes in solar heat flows, which are 4 Conclusions
discussed in the next paragraph.
Present-day challenges associated with energy
scarcity and carbon dioxide emissions are creating a
pressing demand from the building sector to deliver
energy-efficient and sustainable buildings. There is also
an increasing attention to the thermal performance aspects
due to improving living standards. The special attention is
given to places with cold climate conditions such as Nur-
Sultan city, Kazakhstan which is also known for its hot
summers. Designing the building accordingly in such
climate conditions is essential to avoid thermal discomfort
during buildings’ operation stage.
In this study, it was aimed using PDA as the simple
simulation tool to assess the impacts of building design
parameters such as orientation, shading and shapes. With
regards to orientation, the model building was tested for
Figure 7. Maximum heat gains for different building shapes in
July, September and December different orientations with one window for the hottest
5E3S Web of Conferences , 07002 (2021) https://doi.org/10.1051/e3sconf/202124607002
Cold Climate HVAC & Energy 2021
month July. The results for July showed that the most [2] Y. Sun, R. Wilson, and Y. Wu, “A Review of
energy efficient orientation of the building is 120° (30° Transparent Insulation Material (TIM) for
from East to South). The similar process was done for the building energy saving and daylight comfort,”
solar gain case to understand which orientation is the most Applied Energy, vol. 226, pp. 713–729, 2018.
optimal. In this case, the 90° (East) seems to be preferable [3] S. Tokbolat, Y. Naizabekov, and S. Mariani, “The
based on overall heat balance. Identifying the maximum impacts of different façade types on energy use in
solar gain orientation is particularly useful for the winter residential buildings,” E3S Web of Conferences,
season. Then, the orientation, which reached the highest vol. 172, p. 24010, 2020.
indoor temperature value of 120° (30° from East to [4] “Transition to Sustainable Buildings. Strategies
South), was simulated with the addition of shading in and Opportunities to 2050”. IEA, Paris, 2013
order to understand how the internal comfort was [5] I. Artola, K. Rademaekers, R. Williams, and J.
affected. The use of shadings on the windows provided Yearwood, Boosting building renovation: what
reduction of solar gains by 42.2% and resulted in a potential and value for Europe? Brussels:
decrease of the maximum indoor temperature by 4%. The European Parliament, 2016.
results show the importance of using shadings, especially [6] Z. Gou, “Human factors in green building:
in Nur-Sultan during high outdoor temperatures in building types and users' needs”, Buildings, vol.
summer. To conclude, the findings recommend orienting 9, p. 17, 2019.
the buildings in Nur-Sultan at 120° (30° from East to [7] “Thermal Environmental Conditions for Human
South) in order to decrease the use of the heating system Occupancy,” Academia.edu. [Online]. Available:
by increasing the heat gains. However, the increase in https://www.academia.edu/20841731/Thermal_E
sunlight energy absorption makes it imperative to nvironmental_Conditions_for_Human_Occupanc
additionally decrease the temperature during summer, for y. [Accessed: 25-Dec-2021].
example, by use of shadings which proved to be effective. [8] L. Yang, H. Yan, and J.C. Lam, “Thermal
Next, the study looked at the impact of the building comfort and building energy consumption
shape on the internal temperature and solar gains. Square implications - a review”, Appl. Energy, vol. 115,
and rectangular shaped building models of the same area pp. 164-173, 2014
were simulated to identify the optimal shape in terms of [9] H. M. Kamar, N. Kamsah, F. Ghaleb, and M. I.
internal temperature (in three key months: July, Alhamid, “Enhancement of thermal comfort in a
September, and December). The results indicated that the large space building,” Alexandria Engineering
rectangular building has higher solar energy gains than the Journal, vol. 58, no. 1, pp. 49–65, 2019.
squared model, mostly in cold seasons. In December, the [10] T. M. Echenagucia, A. Capozzoli, Y. Cascone,
rectangular model has 165% higher solar energy and, M. Sassone, “The early design stage of a
absorption, while in July and September the differences building envelope: Multi-objective search through
are 39.2% and 51.5% respectively. heating, cooling and lighting energy performance
Further, even though the solar gain values were found analysis”, Appl. Energy, vol. 154, pp. 577-591,
to be high during the selected three months, the effect of 2015.
building shape alteration from square to rectangle is most [11] S. Tokbolat, R.Tokpatayeva, and S. Al-Zubaidy,
significantly evident during December. In fact, the “The Effects of Orientation on Energy
monthly-average indoor temperature for the rectangular Consumption in Buildings in Kazakhstan,”
model is higher by 6.57 °C, which gives a threefold Journal of Solar Energy Engineering, vol. 135,
increase. The differences in internal temperatures are less no. 4, 2013.
obvious in September (2 °C) and lowest in July (0.27° C). [12] S. Tokbolat, F. Nazipov, J. Kim, F. Karaca,
The study had limitations and assumptions, which “Evaluation of environmental performance of
have to be taken into consideration while considering this residential building envelope components.
article. For example, the outdoor temperatures in July, Energies (MDPI),” vol. 13, no. 1, p. 174, 2020.
September and December are assumed as constant and [13] S. Tokbolat, R. Tokpatayeva, S. Al-Zubaidy,
equal to the monthly average temperatures (Table 2). “CFD Investigation of the Effect of Building
However, the consideration of the temperature Passive Design Strategy on Energy Efficiency
fluctuations during the day in Nur-Sultan would and Wind Comfort in Extreme Weather
significantly affect the results. Further research should Conditions in Astana, Kazakhstan,” Applied
consider the different building sizes and shapes based on Mechanics and Materials, vols. 253-255, pp. 658-
the different locations' weather data. In addition, 669, 2012.
orientations should be tested for winter conditions and [18] A. Walters, “Digital Energy Estimation Tool
should consider the wind impacts. (DEET),” Centre for Digital Built Britain, 25-
May-2020. [Online]. Available:
https://www.cdbb.cam.ac.uk/research/digital-
5 References infrastructure/digital-energy-estimation-tool-deet.
[1] I. Kovacic and V. Zoller, “Building life cycle [Accessed: 1-Jan-2021].
optimization tools for early design phases,” [15] “The coldest cities in the world,” The Active
Energy, vol. 92, pp. 409–419, 2015. Times, 22-Nov-2019. [Online]. Available:
https://www.theactivetimes.com/travel/coldest-
cities-in-the-world. [Accessed: 1-Jan-2021].
6E3S Web of Conferences , 07002 (2021) https://doi.org/10.1051/e3sconf/202124607002
Cold Climate HVAC & Energy 2021
[16] “Astana, Kazakhstan Travel Weather Averages,” [19] “Passive Design Assistant (PDA),” ARUP,
Weatherbase, [Online]. Available: [Online]. Available:
https://www.weatherbase.com/weather/weather.p https://www.arup.com/perspectives/publications/r
hp3?s=351881. [Accessed: 1-Jan-2021]. esearch/section/passive-design-assistant
[17] “Kazakhstan topographic maps, elevation, relief,” [20] A. White, M. Holmes, D. J. H. and T. D. Saulles,
topographic. [Online]. Available: https://en- N. C. (2012) “CIBSE ASHRAE Technical
bw.topographic- Symposium, Imperial College, London UK – 18
map.com/places/922/Kazakhstan/. [Accessed: 1- and 19 April 2012”, CIBSE ASHRAE Technical
Jan-2021]. Symposium, (April), pp. 1–12.
[18] “Nur-Sultan, Nur-Sultan, Kazakhstan Monthly [21] “Average Weather in Astana, Kazakhstan, Year
Weather,” AccuWeather. [Online]. Available: Round - Weather Spark,” WeatherSpark.com,
https://www.accuweather.com/en/kz/nur- [Online]. Available:
sultan/222343/august-weather/222343. https://weatherspark.com/y/107257/Average-
[Accessed: 1-Jan-2021]. Weather-in-Astana-Kazakhstan-Year-Round.
[Accessed: 1-Jan-2021
7You can also read