Spectrum Sensing on High Density Cognitive Radio Vehicular Ad Hoc Network
←
→
Page content transcription
If your browser does not render page correctly, please read the page content below
Journal of Communications Vol. 16, No. 7, July 2021
Spectrum Sensing on High Density Cognitive Radio
Vehicular Ad Hoc Network
K. V. Rop1, P. K. Langat2, and H. A. Ouma3
1
Pan African University, Institute for Basic Sciences, Technology, and Innovation, Kenya
2
Jomo Kenyatta University of Agriculture and Technology, Kenya
3
University of Nairobi, Kenya
Email: {vikrop; kibetlp; habsaloms}@gmail.com
Abstract—Intelligent Transport System (ITS) has emerged as opportunistically use the spectrum through CR when the
the most probable technology for improved transport experience PUs are idle. This allows the unlicensed SUs to utilize the
more so in environments with high vehicular density. Effective temporarily unused licensed spectrums without
vehicular communication is however hindered by spectrum interfering with the licensed PUs [5]–[9].
scarcity due to the already crowded licensed spectrum. This has
The cognition cycle of CR consists of multiple phases:
led to the emergence of Cognitive Radio (CR) systems as a
solution to the spectrum scarcity problem. A crucial component
Observe, Analyze, Reason, and Act [6], [10]. The goal is
in CR is spectrum sensing. Various spectrum sensing techniques to detect available spectrum, select the best spectrum,
including Cyclostationary, Matched Filter, and Energy detection select the best operational parameters, coordinate the
have been proposed and applied with varied outcomes. In this spectrum access with other users, reconfigure the
paper, the above mentioned detection techniques are discussed operational parameters, and vacate the frequency when a
and an improved energy detection based cooperative spectrum PU appears. Therefore, there are four important
sensing scheme is proposed for improved communication in functionalities in CR networks: spectrum sensing,
vehicular ad hoc networks (VANET). The proposed scheme spectrum management, spectrum sharing, and spectrum
showed an improvement in the performance of a network which mobility or spectrum handoff. In this work, the process of
in turn could lead to more efficient utilization of spectrum. spectrum sensing is investigated. Spectrum sensing is the
Index Terms—Cognitive Radio, Spectrum Sensing, Vehicular process of detecting the PUs by sensing the radio
ad hoc network frequency (RF) environment. The CR user should
efficiently identify and exploit the spectrum holes for
I. INTRODUCTION required throughput and quality-of service, while taking
precaution to ensure that they do not cause harmful
Increase in vehicular communication applications and
interference to PUs by either switching to another
high data rate traffic flows in vehicular ad hoc networks
available band when a PU appears, or limiting its
(VANETs) leads to more and more information exchange
interference with the appearing PU to an acceptable level
facilitated by wireless communications. More and more
[5], [6], [11].
vehicle-to-vehicle (V2V) and vehicle-to-infrastructure
In CR, each SU must sense the surrounding spectral
(V2I) information exchange, shall be facilitated by
environment to learn about incumbents or interferers,
wireless communications through the use of wireless
from which it determines which frequency bands to use
access in vehicular environments (WAVE) [1], [2]. With
[5], [6]. SUs with limited sensing capabilities in CR ad
these requirements for additional radio resources for use
hoc networks strive to discover and share available
in VANETs, the already crowded communication
spectrum resources without impairing PU transmission.
spectrum is bound to be overstretched thus, necessitating
Sensing strategy design objectives include high CR
additional radio resources for vehicular communication
network throughput, resolution of SU competition,
through other technologies like Cognitive Radio (CR).
distributed implementation, and reliable performance
Some of the licensed radio spectrum is underutilized,
under node mobility. Achievement of these objectives is
as recent experiments by the FCC shows that the
further complicated by the high mobility nature of nodes
spectrum utilization varies from 15%-85% with
in VANETs [11], [12].
frequency, time and geographical location [3], [4]. CR
There are three fundamental requirements for spectrum
technology is one solution for utilizing the underutilized
sensing [5], [6], [11], [12].
spectrum opportunistically [4]. CRs can detect unused
a) Continuous spectrum sensing to monitor the
spectrum bands (spectrum holes), and can access these
absence or presence of the PUs.
holes opportunistically. CR systems involve Primary b) Precautions to avoid interference to potential
Users (PU) and Secondary Users (SU) of the spectrum; PUs.
PUs are license holders, while SUs seek to c) Independent detection of the presence of PUs
without their help.
Manuscript received December 30, 2020; revised June 15, 2021.
Corresponding author email: vikrop@gmail.com
Such spectrum sensing can therefore be conducted
doi:10.12720/jcm.16.7.259-266 non-cooperatively (individually), in which each SU
©2021 Journal of Communications 259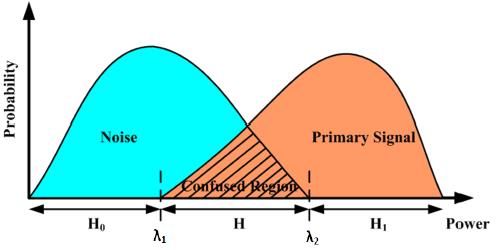
Journal of Communications Vol. 16, No. 7, July 2021

conducts radio detection and makes decisions by itself. network performance has emerged as a possible solution
However, the sensing performance for one cognitive user to these challenges [17].
will be degraded when the sensing channel experiences The spectrum sensing of primary signal can be
fading and shadowing. It has been proposed in the recent expressed mathematically as [18]–[21];
past that collaboration among SUs can improve the
 ( ) , 0
spectrum sensing, and thus may significantly enhance ( ) = { (1)
 ( ) + ( ), 1
secondary spectrum access [4], [11], [12].
 In this paper, Cyclostationary, Matched Filter, and where, ( ) is the signal received at the cognitive radio
Energy based spectrum detection techniques are terminal, ( ) is the additive white Gaussian noise
discussed, and an improved energy detection based (AWGN) with zero mean and variance 2 , ( )
cooperative spectrum sensing scheme is proposed for represents the primary user signal, Ho represents absence
improved communication in VANETs. The novel of licensed PU, and H1 represents the presence of a
contributions here include the development of a triple licensed PU.
threshold energy detection technique for improve sensing The Signal-to-Noise Ratio (SNR), can be given as
efficiency. [18] [21];
 The organization of the rest of the paper is as follows. 2
Section II discusses various spectrum detection = 2 (2)

techniques that are used in VANETs environments.
 where 2 is the variance of the signal and 2 is the
Sections III proposed an improved detection technique
 variance of the noise.
based on energy detection method while section IV and V
discusses the simulation results and concludes the work Received
 Spectrum
 Threshold Sensing
respectively. Sensing
 Signal Comparison Decision
 Method

 II. SPECTRUM DETECTION TECHNIQUES Fig. 1. Spectrum sensing model

 The essence of CR systems is to provide a licensed Fig. 1 [21] illustrates the spectrum detection general
channel that belongs to the PU for use by SU when the model where the block representing spectrum sensing
channel is idle. This means that the SUs must have the method is varied depending on the detection technique
capability to perform spectrum sensing. Spectrum sensing employed.
is a process of obtaining awareness about the spectrum
usage and existence of PUs in a certain geographical area A. Matched Filter Detection Technique
[13]–[15]. An effective spectrum sensing scheme is Matched filter detection requires accurate
desirable for detection of the presence of spectrum holes synchronization and a priori knowledge of the PU’s
and, most importantly, for detection of the presence of features used to demodulate the received signal, such as
PUs. Real-time decisions about which bands to sense, bandwidth, modulation type and order, operating
when, and for how long is a requirement for any CR frequency, and pulse shaping. This information can be
system. Also, the sensed spectrum information must be obtained from the PU if it intends on leveraging
sufficient for the cognitive radio to reach accurate cooperation. With proper synchronization, this method
conclusions regarding the radio environment. With can achieve a shorter sensing time for a given probability
constant changes in the environment, the spectrum of false alarm or probability of detection [21].
sensing must be fast in order to be useful. Energy The test statistic ( ) is given as;
Detection, Cyclostationary, and Matched Filter detection
 ( ) = ∑ −1 ∗
 =0 ( ) ( ) (3)
are the most common PU signal detection methods [16].
 ∗ ( )
 The probability of detection (Pd), probability of false where y(n) is the received signal and represent the
alarm (Pfa), and probability of missed detection (Pm) are correlation coefficient which is a copy of known signal
the most commonly used performance metrics when x(n).
analyzing the performance of spectrum detection Based on Neyman-Pearson hypothesis, the Pd and Pfa
techniques. Pd is probability of a vacant frequency can be are expressed as [21];
channel being declared vacant leading to utilization of the
spectrum band. Pfa is the probability that a vacant −
 = ( ) (4)
frequency channel is declared occupied, and consequently 2
 √
the free band is not utilized by the CR. The Pm on the
other hand is the probability that an occupied channel is
declared vacant, causing interference to the PU, if the CR = ( ) (5)
 2
 √
then utilizes the occupied channel. Challenges like hidden
PU problem, fading, multipath, and shadowing, may lead where E is the PU signal energy and Q is the Marcum Q-
to PU interference by SU. Cooperative spectrum sensing function. Sensing threshold is giving as a function of
by exploiting multiple CR users to improve the sensing PU signal energy and noise variance expressed as [21];

©2021 Journal of Communications 260
Journal of Communications Vol. 16, No. 7, July 2021
= −1 ( )√( 2 ) (6) frequency region in the time domain. The power of
received signal samples is then measured. The input band
Cumbersome and large algorithms are used in this pass filter of the energy detector selects the center
method leading to difficulties in implementation and high frequency, fs and the bandwidth of interest, W. This filter
computation power requirements. These are its major is followed by a squaring device to measure the received
drawbacks coupled by the fact that knowledge of PU energy and an integrator that determines the observation
features is necessary. interval, T. Finally, the output of the integrator, Y is
B. Cyclostationary Detection Technique compared with a threshold, λ to decide whether the
primary user signal is present or not. The energy of the
In cyclostationary based detection technique, the
received signal, E can be estimated as [9], [25], [26];
algorithms are used to differentiate noise from primary
users’ signals since the noise is wide-sense stationary = ∑
=1| |
2
(11)
with no correlation while modulated signals are th
where yi is the i sample of the received signal, and N =
cyclostationary with spectral correlation due to the
2TW is the time bandwidth product.
redundancy of signal periodicities. The cyclostationary
Some of the challenges with energy detector based
feature detector does not require transmitter information
sensing include, selection of the threshold for detecting
at the CR, but it requires excessive signal processing
PUs, and the challenge in differentiating from PUs and
capabilities and is computationally very complex to
SUs already occupying the spectrum holes. Also, as this
implement. It also introduces an element of time delay
method relies on the knowledge of accurate noise power,
[22].
it suffers from noise uncertainty.
Cyclic Spectral Density (CSD), a cyclic correlation
function, is used in this method instead of Power Spectral
III. IMPROVED ENERGY BASED SPECTRUM DETECTION
Density (PSD) for signal detection [18]. The TECHNIQUE
autocorrelation function, ( , ), and mean, ( ), are
used to determine cyclostationary property of the A. Single Threshold Energy Detection
received signal, ( ) as; Single threshold energy detection technique is a
conventionally method where the received signal energy,
( ) = ( + 0 ) (7) Ei, as measured over a specified observation time, is
( , ) = ( + 0 , + 0 ) (8) compared with a threshold λ, to determine the presence or
absence of a PU [27], [28]. Under this method, the only
where T0, t, τ, and m are the time period, time index, two possible results are absence or presence of PU
autocorrelation function lag, and integer, respectively. denoted by H0 and H1, respectively, in Fig. 3. Decision H0
Considering the Fourier series, the CSD function is given will be made when Ei is less than the threshold value λ,
by the expression;
and H1 will be made when Ei is greater than the threshold
( , ) = ∑∞
=−∞ ( )
− 2
(9) value λ, as seen in Eq. (1).
( ) = [ ( − ) ∗ ( − ) − 2 ] (10)
where ( ) is the cyclic autocorrelation function and α
is the cyclic frequency.
C. Energy Detection Technique
Fig. 3. Single threshold energy detection
In the energy detection technique, the signal is detected
by comparing the output of the energy detector with a For hypothesis H0, PU is absent and only noise is
threshold which depends on the noise floor [16], [23], detected. Here, the test statistic γ is the sum of the squares
[24]. This is the most widely used spectrum sensing of 2u Gaussian variables with zero mean and 2 variance.
method since prior knowledge of the licensed user signal In this case, statistic E follows a central chi-square (χ2)
is not required and it performs well with unknown distribution with 2u degrees of freedom. For hypothesis
dispersive channels with less computational and H1, the received signal comprises of PU signal and noise.
implementation complexity. Fig. 2 shows a block Here, the decision statistic Ei will follow a non-central (χ2)
diagram of the energy detection technique. distribution with 2u degrees of freedom and a non-
centrality parameter 2γ as shown in Eq.(12) [12], [28].
2
2 , 0
≈ { (12)
2
Fig. 2. Energy detection scheme
2 ,2
, 1
A band-pass filter in CR system is applied to the Probabilities of Detection, Missing , and False Alarm
received signal for power measurement in a particular can be given as [29]–[31];
©2021 Journal of Communications 261Journal of Communications Vol. 16, No. 7, July 2021
= { > | 1 } = (√2 , √ ) (13) 1 = 2(1 − ) 2 Γ −1 ( , Γ( )) (18)
= { ≤ | 1 } = 1 − (14)
2 = 2(1 + ) 2 Γ −1 ( , Γ( )) (19)
Γ( , ⁄2)
= { > | 0 } = (15) where, the estimated noise variance is assumed on the
Γ( )
interval [(1 − ) 2 , (1 + ) 2 , ] where 0 2 | 0 } = (24)
Γ( )
Each SU performs spectrum sensing individually and
make a decision depending on the fusion rule adopted.
For cooperation of the nodes, the spectrum sensing results
Ei from SU is sent to the fusion center with the results
designated as Ri and Di. The result Ri is where Ei satisfies
λ1 < Ei 2
represents H0 and H1 respectively.
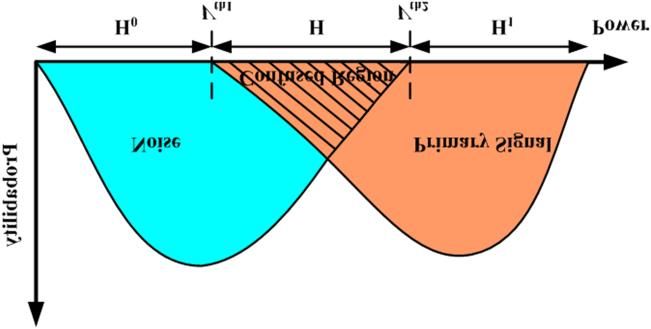
Fig. 4. Illustration of double threshold energy detection regions
, 1 ≤ ≤ 2
The place on uncertainty where the noise and PU = { (25)
, ℎ
signals overlaps illustrates the uncertainty region where
the SU scanning the spectrum is not 100% sure of the 0, < 1
presence or absence of PU. This region is called region of = { (26)
1, > 2
uncertainty, confused region, or fuzzy region as shown in
Fig. 5.
C. Improved Triple Threshold Energy Detection
Fuzzy
Ho Region H1 For improved spectrum performance and utilization, it
would be crucial to have proper classification of the
region of uncertainty in spectrum sensing results, as well
0 λ1 λ2 Ei
as avoiding the use of small scale PUs, like WIFI, which
Fig. 5. Double threshold energy detection are unreliable as they span over a short distance, leading
to constant reallocation of spectrum space to SU if used
Under the double threshold energy detection method,
for VANETs. Thus, the region of uncertainty can be
the user reports H1 if the energy value, Ei exceeds λ2. If Ei
expanded to include all uncertain spectrum sensed results
is less than λ1, the decision H0 will be made. Otherwise, if
with different thresholds. Fig. 6 and 7 illustrates the
Ei is between λ1 and λ2, then the SU reports its
proposed improved triple energy detection method with
observational energy value Ei for further decision making
the three threshold levels indicated.
at the fusion center.
0 , > 1
Ho H1
( ) = { , 1 ≤ ≤ 2 (17) Fuzzy Region
1 , > 2
By using the lower and upper limit of noise variance, 0 λ1 λ2 λ3 Ei
the lower threshold λ1 and the upper threshold λ2 Fig. 6. Triple energy detection threshold levels
respectively are chosen as;
©2021 Journal of Communications 262Journal of Communications Vol. 16, No. 7, July 2021
The probabilities of detection, false alarm, and missing
are given by the following equations;
= { > 3 | 1 } = (√2 , √ 3 ) (34)
= { < 1 | 1 } = 1 − 1, − 1 (35)
Region of Uncertainity Γ( , 3⁄2)
= { > 3 | 0 } = (36)
Γ( )
λ1 λ2 λ3
Equations (25) and (26) can be modified to include the
Fig. 7. Illustration of triple energy detection regions
three thresholds where the result is for satisfying 1
The region of uncertainty is from the first threshold λ1 < ≤ 3 , denoted as , otherwise . can either be
to the third λ3. The uncertainty region can be analyzed or representing no decision and unreliable region
further to determine whether there is presence or absence satisfying 1 ≤ < 2 and 2 ≤ ≤ 3 respectively.
of small scale PU, presence or absence of PU, or absence
of both. All the nodes will relay all the spectrum scanned , 1 ≤ ≤ 3
= { (37)
information to the Fusion Center (FC). , ℎ
In the proposed model, the FC receives two kinds of where,
information: local decisions and observational values of
the SU, i.e. local energy values. The local sensing using , 1 ≤ ≤ 2
= { (38)
energy detection for triple threshold method, x(n) is , 2 ≤ ≤ 3
determined as;
0, < 1
= { (39)
0, ≤ 1 1, > 3
( ) = {1, > 3 (27)
IV. SIMULATION RESULTS
, ℎ
To check the spectrum sensing performance of CR
where k is the region of uncertainty given as; users, various performance metrics were simulated under
different scenarios. Monte Carlo simulations under
, 1 < < 2 AWGN with mean 0 and noise variance 1 were simulated
={ (28)
, 2 ≤ ≤ 3 with the number of iterations set at 1000. A QPSK
modulation technique with a modulation index of 4 was
Generally, Equation 27 and 28 can be written as;
adopted in this simulation with the number of signal
0, ≤ 1
samples set at 1000. Probability of false alarm and signal-
, 1 < < 2
( ) = { (29) to-noise ratio are the common parameters that are used to
, 2 ≤ ≤ 3
estimate the probability of detection and the probability
1, > 3
of missed detection in cognitive radio systems.
The simulations were carried out in two phases. The
For the ith SU, the parameters 0, and 1,
first phase was to analyze the spectrum sensing
representing the probability of 2 ≤ ≤ 3 under performance under different values of Pfa and SNR using
hypothesis 0 and 1 respectively, and 0, and 1, conventional single threshold method of checking for the
representing the probability of 1 ≤ ≤ 2 under presence or absence of PU. The same procedure was then
hypothesis 0 and 1 respectively, can be given as; repeated under double and triple thresholds and
comparison drawn. The Pfa from 0.01 to 1 in steps of 0.01
∆1, = { 2 ≤ ≤ 3 | 1 } was first used to check the Pd and the Pm. Also, the same
= (√2 , √ 2 ) − (√2 , √ 3 ) (30) procedure was repeated with the SNR set at -16 dB to 0
dB. The receiver operating characteristics (ROC) curves
0, = { 2 ≤ ≤ 3 | 0 } that depict the Pd and Pfa relationship at a specific SNR
( , 3⁄2)
( , 2⁄2)
value and Pd and SNR relationship at a specific Pfa values
= − (31) are discussed below.
( ) ( )
Fig. 8 shows the ROC of Pd vs Pfa at different SNR
1, = { 2 ≤ ≤ 3 | 1 } values, and based on conventional single threshold
= (√2 , √ 2 ) − (√2 , √ 1 ) (32) energy detection method. Liu, et.al [34] points out that
the recommended Pfa of 0.1 indicates a confidence level is
0, = { 2 ≤ ≤ 3 | 0 } 95%, which corresponds to the IEEE 802.22
Γ( , 2⁄2)
1⁄ recommended and the acceptable values for Pfa and Pd as
Γ( , 2)
= Γ( )
− Γ( )
(33) ≤ 0.1 and ≥ 0.9 respectively [35]–[37]. At the
©2021 Journal of Communications 263Journal of Communications Vol. 16, No. 7, July 2021 recommended Pfa level of 0.1, the highest SNR of 1dB Similarly, in order to prevent underutilization of has the highest Pd of approximately 0.988 as compared to transmission opportunities, a lower Pfa with a lower Pm is Pd of 0.886, 0.39, and 0.169 at -5 dB, -10 dB, and -15 dB recommended. A lower Pm with a higher SNR will respectively. provide better spectrum utilization. Fig. 10 shows a complementary ROC comparison of Pm with SNR under different values of Pf. It is observed that the higher the SNR, the lower Pm at different values of Pfa. This presents an ideal situation in which the CR user does not fail to note the presence of PU, and thus avoiding causing interference to licensed users. A clear distinction between the presence and absence of PU may not be possible in some situations due to the impact of noise. To test the performance of the proposed triple threshold method for improved performance of VANET, the Pfa was set at 0.01 and SNR set at -15dB to 5dB at intervals of 0.5. Fig. 8. Pd vs Pfa for different SNR Fig. 11. Pd vs SNR with different thresholds Fig. 11 compares the probabilities of detection versus Fig. 9 Pd vs SNR for different Pfa SNR based on the three thresholds, conventional single threshold, double threshold, and triple threshold, The results in Fig. 9 shows that the higher the SNR techniques. Similar to Fig. 9, Fig. 11 shows that the Pd value, the higher the Pd . Also the lower the Pfa, the lower increases with the increase in the SNR value. Due to the Pd value for the same SNR. The detection unclear fuzzy region, the Pd under single threshold was performance for SNRs lower than −5 dB can be seen to the lowest as compared with the double and triple degrade further. This degradation can be attributed to thresholds. Double and triple threshold have comparable increase in noise levels received as well as the possibility Pd with the triple threshold having a higher Pd. At -10 dB of window shadowing. A Pfa of 0.1, 0.5, 0.01, and 0.001 SNR, the Pd of 0.795, 0.705, and 0.104 for triple, double, at SNR of −5 dB, −4.67 dB, −4.16 dB, and − 3.46 dB and single thresholds, respectively, are obtained. This respectively yields a recommended Pd of 0.9. shows clearly that triple threshold method outperforms double threshold by Pd of approximately 0.09, an improvement of approximately 12.8%. The improvement over single threshold method is over 6 fold. This can be very significant given the high rate of operation of the users, and result in significant improvement in network data efficiency. Fig. 12 compares the Pd versus the Pf. Based on the recommended Pfa of 0.1, the Pd of 0.95, 0.90, and 0.205 were noted for triple, double, and single threshold, respectively. These results shows that triple threshold method performed better that both the double and single threshold methods. The difference in Pd between triple and double threshold is 0.05 or 5.3%, and thus detections Fig. 10. Pm vs SNR for different Pfa are likely to improve by this percentage. ©2021 Journal of Communications 264
Journal of Communications Vol. 16, No. 7, July 2021

 [4] K. Baraka, L. Safatly, H. Artail, A. Ghandour, and A. El-
 hajj, “An infrastructure-aided cooperative spectrum
 sensing scheme for vehicular ad hoc networks,” Ad Hoc
 Networks, vol. 25, pp. 197–212, 2015.
 [5] A. Riyahi, S. Bah, and M. Sebgui, “Clasification and
 analysis of spectrum sensing mechanisms in cognitive
 vehicular networks,” EAI Endorsed Trans. Smart Cities,
 vol. 2, no. 7, pp. 1–10, 2018.
 [6] J. R. D, “Vehicular Ad-Hoc Networks (VANETs) assisted
 by cognitive radio technology: Current prominence,
 challenges, and explore trends - a survey,” Int. J. Sci. Res.
 Rev., vol. 7, no. 4, pp. 1758–1767, 2018.
 [7] R. P. Surender Pal, “Vanet based simulation using cluster,”
 Int. J. Latest Res. Sci. Technol., vol. 6, no. 3, pp. 25–28,
Fig. 12. Pd vs Pfa for varying threshold 2017.
 [8] X. He, W. Shi, and T. Luo, “Survey of cognitive radio
 V. CONCLUSION VANET,” KSII Trans. Internet Inf. Syst., vol. 8, no. 11, pp.
 3837–3859, 2014.
 Spectrum detection methods are discussed in this paper
 [9] S. Yu, J. Liu, J. Wang, and I. Ullah, “Adaptive double-
with emphasis on the proposed spectrum sensing method threshold cooperative spectrum sensing algorithm based on
based on an energy detection method that improves the history energy detection,” Wirel. Commun. Mob. Comput.,
spectrum sensing performance for VANETs. Due to its vol. 2020, pp. 1–12, 2020.
advantages, energy detection method has been researched [10] I. F. Akyildiz, B. F. Lo, and R. Balakrishnan, “Cooperative
extensively and thus was analyzed further in this work. spectrum sensing in cognitive radio networks : A survey,”
The use of triple threshold method in this work has be Phys. Commun., vol. 4, no. 1, pp. 40–62, 2011.
shown to significantly improve the performance of a [11] J. M. Lim, Y. C. Chang, M. Y. Alias, and J. Loo,
network which in turn could lead to more efficient “Cognitive radio network in vehicular ad hoc network
utilization of spectrum. ( VANET ): A survey,” Cogent Eng., vol. 29, no. 1, pp. 1–
 19, 2016.
 CONFLICT OF INTEREST [12] R. Adriano and A. D. Souza, “Simulation platform for
 The authors declare no conflict of interest. performance analysis of cooperative eigenvalue spectrum
 sensing with a realistic receiver model under impulsive
 AUTHOR CONTRIBUTIONS noise,” Veh. Technol. - Deploy. Appl. INTECH Open Sci.,
 pp. 171–198, 2013.
 All authors contributed to research and modelling the [13] M. Lai, S. Peng, X. Yang, and L. Zhou, “Fast Two-Step
proposed spectrum sensing technique. K.V. Rop energy detection for spectrum sensing,” J. Electr. Comput.
simulated the proposed technique under the guidance and Eng., vol. 2015, pp. 1–6, 2015.
advice of Dr. P.K. Langat and Prof. H.A. Ouma; All [14] P. Verma and B. Singh, “Threshold optimization in energy
authors had approved the final version. detection scheme for maximizing the spectrum utilization,”
 Procedia Comput. Sci., vol. 93, pp. 191–198, 2016.
 ACKNOWLEDGEMENT [15] X. L. Hu, P. H. Ho, and L. Peng, “Fundamental limitations
 The authors wish to thank the Pan African University in energy detection for spectrum sensing,” J. Sens.
Institute for Basic Sciences, Technology, and Innovation Actuator Networks, vol. 7, no. 3, p. 25, 2018.
(PAUISTI) and African Union (AU) for the funding of [16] M. R. and A. B. A. Razaq, “Analysis of spectrum sensing
this research. techniques in cognitive radio,” Sci. Int.(Lahore), vol. 29,
 no. 2, pp. 417–426, 2017.
 REFERENCES [17] D. Xue, E. Ekici, and M. C. Vuran, “Cooperative spectrum
 sensing in cognitive radio networks using
[1] A. Riyahi, M. Sebgui, S. Bah, and B. Elgraini, “Analysis of multidimensional correlations,” IEEE Trans. Wirel.
 the impact of cognitive vehicular network environment on Commun. Wirel. Commun., vol. 13, no. 4, pp. 1832–1843,
 spectrum sensing,” Emerg. Technol. Dev. Countries. 2014.
 AFRICATEK 2017, vol. 206, pp. 22–32, 2018. [18] M. M. I. S. Ali, “Comparative study of spectrum sensing
[2] F. B. S. De Carvalho, W. T. A. Lopes, M. S. Alencar, and methods in cognitive radio network,” Int. J. Emerg.
 V. S. José, “Cognitive vehicular networks : An overview,” Technol. Comput. Appl. Sci. (IJETCAS), vol. 12, no. 1, pp.
 Procedia Comput. Sci., vol. 65, pp. 107–114, 2015. 91–95, 2015.
[3] D. Das and S. Das, “An intelligent approach for resource [19] R. Aswatha, V. Seethalakshmi, K. Murugan, N.
 allocation in the cognitive radio vehicular ad hoc network,” Sathishkumar, A. Reethika, and S. Gunanandhini,
 Trans Emerg. Tel Tech., vol. 28, pp. 1–11, 2017. “Implementation of cooperative spectrum sensing using

©2021 Journal of Communications 265
Journal of Communications Vol. 16, No. 7, July 2021

 cognitive radio testbed,” Indian J. Sci. Technol., vol. 13, no. markov model for cognitive radio,” Pone, vol. May, pp. 1–
 13, pp. 1355–1366, 2020. 18, 2017.
[20] X. Qian and L. Hao, “Performance analysis of cooperative [35] S. Shellhammer and G. Chouinard. (2006). IEEE P802.22
 sensing over time-correlated rayleigh channels in vehicular wireless RANs - spectrum sensing requirements summary.
 environments,” MDPI Electron. JournalElectronics J., vol. [Online]. pp. 1–10. Available: http://www.ieee802.org
 9, no. 1004, pp. 1–20, 2020. [36] A. J. Onumanyi, E. N. Onwuka, A. M Aibinu, O. C.
[21] F. Salahdine, N. Kaabouch, H. El, and G. Matched, Ugweje, and M. J. E. Salami, “A modified Otsu’s
 “Matched filter detection with dynamic threshold for algorithm for improving the performance of the energy
 cognitive radio networks,” in Proc. International detector in cognitive radio,” Int. J. Electron. Commun., vol.
 Conference on Wireless Networks and Mobile 79, no. September 2017, pp. 53–63, 2017.
 Communications (WINCOM), 2015, pp. 1–6. [37] A. Kumar, P. Thakur, S. Pandit, and G. Singh, “Analysis of
[22] A. Trivedi, R. Dubey, and R. B. Ahirwar, “A review on optimal threshold selection for spectrum sensing in a
 cooperative spectrum sensing in cognitive radio networks,” cognitive radio network: An energy detection approach,”
 Int. J. Digit. Appl. Contemp. Res., vol. 3, no. 3, pp. 2108– Wirel. Networks, vol. 25, no. 7, pp. 3917–3931, 2019.
 2113, 2014.
[23] A. Bagwari and G. Tomar, “New cooperative spectrum Copyright © 2021 by the authors. This is an open access article
 detectiontechnique in cognitive radio networks,” Int. J. distributed under the Creative Commons Attribution License
 Wirel. Mob. Commun. Ind. Syst., vol. 3, no. 1, pp. 43–58, (CC BY-NC-ND 4.0), which permits use, distribution and
 2016. reproduction in any medium, provided that the article is
[24] G. H. Alsuhli, A. Khattab, and Y. A. Fahmy, “Double- properly cited, the use is non-commercial and no modifications
 or adaptations are made.
 Head clustering for resilient VANETs,” Wirel. Commun.
 Mob. Comput., vol. 2019, pp. 1–17, 2019.
 K. V. Rop was born in Kericho, Kenya. He is currently a PhD
[25] D. M. M. Plata and Á. G. A. Reátiga, “Evaluation of
 student in Electrical Engineering (Telecommunication option) at
 energy detection for spectrum sensing based on the
 Pan African University Institute of Science, Technology and
 dynamic selection of detection-threshold,” Procedia Eng.,
 Innovation, Nairobi, Kenya. He received his M.Sc. degree in
 vol. 35, pp. 135–143, 2012.
 Telecommunication Engineering from JKUAT, Kenya, in 2013.
[26] A. Ostovar, “Cooperative spectrum sensing optimal
 His research interests include wireless communications and
 threshold selection in cognitive radio networks,” Internet
 networks and cognitive radio systems.
 Technol. Lett., vol. 3, no. e197, pp. 1–6, 2020.
[27] A. Folaponmile, O. J. B, and M. A. Abubakar, “Threshold
 P. K. Langat received his PhD in Electronic Engineering from
 optimization of energy detector using fuzzy logic for
 Stellenbosch University, South Africa in 2011. He holds a BSc.
 cognitive radio,” Jorind, vol. 14, no. 1, pp. 1–12, 2016.
 in Electrical & Electronic Engineering and MSc.
[28] B. Ahuja and K. Sharma, “Adaptive double threshold
 Telecommunication Engineering from JKUAT, Kenya. He is
 based spectrum sensing for cognitive radio networks,” Int.
 currently a Senior Lecturer in the Department of
 J. Energy, Inf. Commun., vol. 5, no. 6, pp. 1–16, 2014.
 Telecommunication and Information Engineering at JKUAT.
[29] J. Wang, Q. Wu, X. Zheng, and J. Chen, “Cooperative
 His research interests include wireless communication, applied
 Spectrum Sensing,” Intech Open Sci., pp. 1–15, 2009.
 electromagnetics, and multi-antenna communications and
[30] R. Mokhtar, B. M. Ali, N. K. Noordin, R. Saeed, and Y.
 applications.
 Abdalla, “Distributed cooperative spectrum sensing in
 cognitive radio networks with adaptive detection threshold,”
 H. A. Ouma was born in Kisumu, Kenya in 1965. He received
 Proc. Asia-Pacific Adv. Netw., vol. 30, p. 90, 2010.
 B.Sc.(Hons) in Electrical Engineering from University of
[31] D. Zhang, X. Lin, and H. Zhang, “An improved clustering
 Nairobi, Kenya in 1988; M.Eng. in Telecommunication
 cooperative spectrum sensing algorithm,” J. Comput., vol.
 Engineering from the University of Technology, Sydney (UTS),
 8, no. 10, pp. 2678–2681, 2013.
 Australia in 1993; and Ph.D in Engineering from the Kanagawa
[32] A. L. I. Çalhan, “A fuzzy logic based clustering strategy
 Institute of Technology (KAIT), Kanagawa, Japan in 1998. He
 for improving vehicular ad-hoc network performance,”
 is presently an Associate Professor of Telecommunications
 Sadhana - Acad. Proc. Eng. Sci., vol. 40, no. 2, pp. 351–
 Engineering at the department of Electrical and Information
 367, 2015.
 Engineering, University of Nairobi, Kenya. His current research
[33] X. Li, T. Song, Y. Zhang, G. Chen, and J. Hu, “A hybrid
 interests include heuristic optimization and evolution in
 cooperative spectrum sensing scheme based on spatial-
 Wireless Communication Networks, and Image Processing. He
 temporal correlation for CR-VANET,” IEEE, pp. 1–6,
 is also a Senior Member of the Institute of Electrical and
 2018.
 Electronic Engineers (SMIEEE).
[34] Y. Liu, J. Liang, N. Xiao, X. Yuan, Z. Zhang, and M. Hu,
 “Adaptive double threshold energy detection based on

©2021 Journal of Communications 266
You can also read