Automated Detection of Cardio Vascular Disease using Enhanced KNN classifier based on Sand Piper Optimization Algorithm
←
→
Page content transcription
If your browser does not render page correctly, please read the page content below
10 Received on Aug 2020

 Automated Detection of Cardio Vascular
 Disease using Enhanced KNN classifier
 based on Sand Piper Optimization
 Algorithm
 K. Kalamani1*, D. Brindha2

 1
 Professor, Department of Electronics and Communication Engineering, Coimbatore Institute of
 Engineering and Technology, Coimbatore: 641109, Tamil Nadu, India
 2
 Associate Professor, Department of Electronics and Communication Engineering, Coimbatore
 Institute of Engineering and Technology, Coimbatore: 641109, Tamil Nadu, India
 *
 Corresponding author email: kalaimaniswetha@gmail.com

 Abstract: In this manuscript recognition cardio vascular disease (CVD) is detected based on sand piper
 optimized with Enhanced KNN classifier is proposed. In this method the images are taken from the various
 data sets of the cardiac images are taken to excerpt the features of the images calculated using left ventricle
 (LV), end – diastolic volume (LVEDV), and end–systolic volume (LVSEV). In this proposed algorithm
 shows the optimal accuracy and computational performance for myocardial mass, wall thickness, left
 ventricle (LV) and right ventricle (RV) volume and ejection fraction (EF). The accuracy of the proposed
 Enhanced KNN classifier and Sand Piper Optimization (SPO) algorithmmethod shows the accuracy 6.45%,
 sensitivity shows 7.65%, Specificity shows 3.67%.F-measure shows the 12.56%, Recall shows the 7.89%,
 shows higher outputs when comparing with existing methods like Random Forest Classifier (RFC) and
 principle component analysis (PCA) respectively.

 Keywords: Cardiovascular diseases (CVD), Magnetic resonance image (MRI), Sandpiper optimization
 algorithm, Enhanced KNN classifier.

 carditis, venous thrombosis, thromboembolic disease and
1. INTRODUCTION peripheral disease provide path disease to integrate into
 CVD [5].In Cardiovascular disease(CVD) [6] two groups of
Currently heart disease is the main problem and it will cause disease are analyzed using modals in coronary artery
death rate also high [1]. Coronary artery disease (CAD) [2], disease, they are invasive and non–invasive methods[7,8].
like angina and dead myocardial tissue [3,4], cause heart The images in catheter- based fit to invasive techniques [9,
attack, stroke, heart disappointment, cardiac arrhythmia, 10] and the images in the non-catheter- based belongs to the
hypertensive coronary disease, cardiomyopathy, coronary non- invasive image model [11,12]. In certain clinical cases,
artery disease rheumatic disease, congenital coronary artery multiple images are obtained in dissimilar points in time or
disease, aortic aneurysms, coronary valvular disease, from different points of view [13, 14].

 Journal of Soft Computing and Engineering Applications, Vol. 1, No. 3, 2020
11 Received on Aug 2020 The ML and AI methods are conceivable to sustenance genetic set of classifiers for the detection of arrhythmias doctors to analyze and to compute accurate value of the with ECG signals. This method was used to implement a patient in time [15,16]. These approaches can recover the three-layer (48 + 4 + 1) deep genetic ensemble of classifiers ability of doctors and researchers to recognize and then (DGEC). The advanced technique was a hybrid associating examine the basic difference that cause disease. These (1) joint learning, (2) deep learning, and (3) evolutionary procedures collected from conventional algorithms like computing. The developed DGEC system achieved a Support Vector Machine (SVM), Neural Network (NN), and recognition of accuracy = 99.37%, specificity = 99.66% deep learning algorithms as Convolution Neural Network with single sample classification time = 0.8736 (s) in the (CNN).These algorithms prime to numerous levels of detection of 17 ECG classes of arrhythmia. concept, image and data routinely from huge set of images In 2017, Mahdi, et.al [24] has presented a feature-based that demonstrate the preferred performance of figures [17]. classifier and convolutional neural networks for detecting The main objective of this manuscript sand piper arrhythmias of short ECG segments. This method was used algorithm is proposed to optimize Cardio vascular disease. to implement the cardiovascular diseases using atrial In this segmenting process the heart image is taken from fibrillation (AF) was extensive and exclusive. Then the cardio vascular magnetic resonance imaging (MRI) and experimental results show that convolutional neural network approximations from the specific dataset is intended using scored 72.1% in improved database and 83% in the test set. left ventricle (LV), end – diastolic volume (LVEDV), and In 2017, Asl et al [25] have presented an automated end- systolic volume (RVESV) [18]. diagnosis of patients with coronary artery disease (CAD) The major contributions of this manuscript are with optimized SVM. This technique was used to summarized below: implement the method for automatic examination of Here, an automatic CMR image examination, ordinary and coronary artery disease conditions by heart rate utilise an Enhanced KNN based Sand Piper variability (HRV) signal removed as electrocardiogram Optimized [19] Algorithm is proposed. (ECG). The principal component analysis (PCA) was The efficiency of the system has been appraised applied for decreasing the number of features. The Support with a number of mechanical metrics, involving Vector Machine (SVM) classifier has been used for Dice metric, mean contour and Hausdorff distance, classifying two classes of data with extracted distinctive and clinically relevant measures with LV, RVEDV features. and RVESV [20]. In 2017, Wang et al [26] have presented a Detection of Remaining manuscript is mentioned as below. The cardiovascular diseases from mammograms with deep Literature survey is described in section 2. Section 3 A learning. Coronary artery disease mainly affect the women proposed Segmentation methods based on sand piper to diagnose this disease Breast arterial calcifications optimized Enhanced KNN classifier for cardiovascular (BACs), method was used. The result of this method shows disease (CVD). Result and discussion are suggested on linear regression with a coefficient of determination of section 4 and at last, Section 5 concludes the manuscript. 96.24%. 2. LITERATURE SURVEY 3. PROPOSED DETECTION METHOD BASED ON SAND PIPER OPTIMIZED ENHANCED KNN In 2017, Mai et.al [21] introduced improved wearable and CLASSIFIER FOR CARDIOVASCULAR DISEASE mobile technology interventions for diminishing sedentary (CVD) behavior and heart problems. It was used to estimate the efficiency of enhanced experience interferences aimed at In this section Detection method based on sand piper eliminating sedentary behavior (SB) on healthy adults and optimized Enhanced KNN classifier is explicated for the to observe the behavior change techniques (BCT) utilized. detection of CVD using MRI image. From figure 1 shows The experimental results show that the gears of mobile and the block diagram for detecting the cardiovascular disease, wearable technology caused an average reduction of -41.28 the Left ventricle and right ventricle cardiac image is taken min per day (min / day). as the input and the image is taken by the process of In 2019, Srivastava et.al [22] presented effective magnetic resonance image (MRI) method. In this the input prediction of heart disease with hybrid machine learning image is used to detect the cardio vascular disease (CVD) in techniques. This method was used to predict the important the heart and to analyzes in the feature extraction. Then structures by using machine learning systems that allow the feature extraction process is takes place by using the sand precision on calculation of cardiovascular diseases to be piper optimized fully deep convolutional neural network. tamed. The experimental results show that accuracy level of This process is used to detect the diseases in the heart. In 88.7% performed by prediction model of heart disease this, a cavity is detected in the input image and then the through the hybrid random forest with linear model image is partioned into a series of semantically or (HRFLM). automatically significant regions, interms of quantitative In 2020, Acharya et.al [23] have presented a deep measures that may be removed like myocardial mass, wall Journal of Soft Computing and Engineering Applications, Vol. 1, No. 3, 2020
12 Received on Aug 2020 thickness, LV volume, RV volume, and ejection fraction In this i[a] represents the a-th component of vector I and (EF), so on. To detect CVD in heart the existing method -th th wo [a, b] signifies the component a row and b- column of shows less accuracy, to get more accuracy Enhance KNN matrix I. classifier is used. Then to get more optimal solution the Then the convolved characteristics of the image does optimization problem sandpiper optimization algorithm not crash with neighbors through size 6 6 is calculated as (SPO) is proposed. Input cardiac 6x 6j 1 1 1 MRI image Po [a1, b1 ] Lo [a, b] (3) Detection using 6 x (6 x 5) v(6 x 5 Left Sandpiper 1 1 Ventricle Feature Extracxtion Optimized Enhanced KNN classifier Then the output can be calculated as the original cardio multi resonance image 256 256 is up sampled to 32 32 . Right Ventricle 3.1 Enhanced K-Nearest Neighbor classifier (EKNN) CVD detection Output In this Enhanced KNN classifiers are used to determine the training set of cardiac images. In this process the trained CVD detection images are calculated by using the n and m image features. output LV Then the image features are calculated as r 1 r r CVD detection Nw N w2 N wv output RV D w1 , w1 ,.......w1 (4) r r r Figure 1: Block diagram for the detection of cardiovascular Where D represents the class center in the measured V disease (CVD) diministic features space, r is the number of examples in the Enhanced KNN classifier model has two methods namely class, N wj is the data of j th dimension of the wth example. training and testing stages to test the cardiac image data. To Then the strength of the item Li is formulated as test the image, cardiac images are taken to detect the Cardiovascular disease (CVD) and the images are cropped center by utilizing 256 × 256 pixel dimensions. The cardiac JH ( Li ) * JH A ( Li ) * JH B ( Li ) (5) magnetic resonance image introduces a dataset with heart 2 and the circulatory tissues of the human body. To decrease the computational difficulty in time and to recover the Where JH ( Li ) represents the strength of the item Li , and it accuracy. In this find the location of LV and RV. Here to is the weight average of two values. And it is the strength of decrease the computational difficulty in the input image size the image in the class and it is denoted as JH A ( Li ) . Then that is 256 256 after reducing the image size then the image is close to each other and it is denoted as consider 64 64 it is the input. JH B ( Li ) . and are the weighting factors to calculate the Then observe the pixel coordinates of the top left and the computational complexity respectively. Then the JH A ( Li ) bottom right of the images is [1,1] and [64,64] . Then the and JH B ( Li ) is calculated as convolved MRI imagecharacter computes the value is denoted in equation 1 EDIST (L , L 1 JH A ( Li ) (6) m) Lo [a, b] h(wo [a, b]) (1) iM i EDIST (L , D) 1 Where JH B ( Li ) (7) iM i EDIST (L , L 11 11 1 wo [a, b] H [D D ]A[a D 1, b D C p 1 C p 2 o 1 2 1 2 1] x0 [o] (2) Where JH A ( Li ) iM i m) is the computational Journal of Soft Computing and Engineering Applications, Vol. 1, No. 3, 2020
13 Received on Aug 2020 EDIST (L , D) 1 reduce the costs, danger, and increase the reliabilities. complexity and JH B ( Li ) is the cost iM i 1 Step by Step procedure time of image complexity. Then the Euclidian distance with In this section have to discuss the segmentation process in in the image Li andLM are represented by the below medical images using Sandpiper algorithm reduce the equations such as cardiovascular diseases during the segmentation process. The step-by-step procedure shows the inspiration and v computational representation of the proposed algorithm. EDIST (Oa , Ob ) (O j 1 a j Obj ) 2 (8) This method is used to enhance the diagnosis and treatment of cardiac diseases and to reduce the death rate of CVD. This algorithm is calculated by using the distinct positions. Sandpipers may attack the particular position of the image Where Oaj and Obj is the value of the j th dimension of the and given to real life. This algorithm estimates the points Oa and Ob in the v dimensional feature space. Then movement of the image from one position to another, during this process sand piper algorithm is used to clarify the the computation complexity and time are calculated as by distance. The proposed sandpiper optimization algorithm substituting equation 5 in 8 and it is given as shows step by step procedure to solve the CVD is as follows: 1 i M EDIST ( Li , Lm ) EDIST ( Li , D) Step 1: Initialization JH ( Li ) (9) Initialize the initial position of sandpipers to detect the MRI 2 image and to find the cardiovascular disease from the heart, Equation 9 is known as the computational complexity and and detect the faults of this disease. Sand piper optimization time cost. The faults in the Enhanced KNN classifier are, it algorithm is proposed to get optimized values with greater requires more recall expenditures when large amount of data accuracy. During this movement’s error may occur to is to be in progress. The myocardial infraction for Enhanced minimize that errors and piper optimization is proposed KNN classifier shows the accuracy 0.67%. To get more from the following equations: accuracy and optimization technique is proposed in Here initialize the population Lbp as the best searching sandpiper optimization algorithm technique. term to detect cardiac disease and the below equation In this Sandpiper optimization (SPO) algorithm is becomes proposed to decrease the cardiovascular disease (CVD) and to reduce the death of the human being. CVD is most dangerous disease and can stop the human life. Coronary Lbp LY K bs (w) (7) artery diseases (CAD) like angina and dead myocardial tissue cause heart attack, stroke, heart disappointment, cardiac arrhythmia, hypertensive coronary disease, Where LY is the collision avoidance, Lbp is the positions of cardiomyopathy, rheumatic coronary disease, congenital the searching term that will not collides between additional coronary disease, aortic aneurysms, Coronary valvular the searching criteria, K bs (w) denotes the present position disease, carditis, venous thrombosis, thromboembolic of searching criteria, q denotes the present iterations in disease and peripheral disease provide a route of integration searching area. in CVD. While detecting Cardiovascular disease (CVD) using MRI image segmentation causes dangerous or serious process in real life heart cardiovascular performance LY Lh (w Lh / iterMax ) (8) metrices. To overcome the cardiovascular problem in human heart here proposed a novel algorithm called sand Where, w 0,1,2,....iterMax (9) piper optimization algorithm. This algorithm is used to Where Lh denotes the controlling frequencies to change the solve the above problem and give challenge to the real-life problems. Using sandpiper algorithm can find the causes of variable LY is linear lower from Lh to 0 , and if limitation attacking behavior of the human body. This algorithm is LY =2 i.e. assuming, the variables will lesser from 2 to 0 used to execute by using two processes such as highlight and then the value is 2 then the step is going on up to intensification and diversification of the searching area. In assuming the values. this algorithm the experimental result shows the computational difficulty and convergence performance is Step 2: Random generation calculated. Then sand piper algorithm use machine – After the collision avoidance process then to converge the learning algorithm to enhance the real-life results. It will Journal of Soft Computing and Engineering Applications, Vol. 1, No. 3, 2020
14 Received on Aug 2020 probing measures near the way of best neighbors. K xBy are LAcc 0.5 Qrand (11) the best probing measures and the equation is given below. Where Wrand a random number is lies on range of [0, 1]. Step 3: Fitness Function M by LX ( K xvr (w) K bt (w) (10) From the initialized values, the random number of solutions is created. The fitness function of solution is evaluated and the objective function is represented in an optimization of Initialization function in equation (6). Step 4: Update the position using sand piper optimization (SPO) algorithm Generate the initial Population In this step , SPO assigns the current best solution for the and position of the input image cardio vascular disease (CVD). Sandpiper is used to optimize the CVD and gives the best probing measures for the optimization. Then update the position by sand piper’s optimization Determine the detection by behavior using the following equation (13) probing EKNN-SPO measures are derived as: Nbp Lbk Vbl (12) Optimize the Cardiovascular disease using SPO Substitute equation 7 and 10 in equation 12 to update the space and to measure the CVD. N yl Lbk Vbl LA LX ( K xvr (w) K bt (w) (13) while ( q itermax ) Where N yl denotes the space in the CVD measures and the excellent right probing measures. At the position of the detection the sandpiper may Update optimal solution and change its position and angle and to analyze the correct return the best solution position to examine the images at entire points over the cardiac cycle. Then Sand pipers can generates the spiral behaviour to analyze the image. Then the 3-dimensional view of the cardiac cycle is given below: Minimization of cardiovascular disease J ' Qradius sin c(a) (14) F ' Qradius cos c(a) (15) Yes Halting criteria W ' Qradius a (16) min(CVD) is met q r cj (17) No Termination Where, Qradius denotes the radius of every spin, a is the variable lie in the range of [0 C 2 ] t and a denote the Figure 2: Flow chart for CVD spiral shape constant and denotes the base of the natural L Acc is the random variable and it is responsible for better algorithm. Then consider the values j and r is 1 and it accuracy LAcc Is derived as: behave as constant then the updated equation is (19) Journal of Soft Computing and Engineering Applications, Vol. 1, No. 3, 2020
15 Received on Aug 2020 Step 5: Minimization of cardiovascular disease segmentation B and manual segmentation A and the Let us consider the constant values u. j. 1 then the shape equation can be derived as follows: of the image become complex. So, the position is updated as 2 | X Y | D.M (20) | X | |Y | N yl (w) ( Fyl ( j ' f ' w' )) N ayl (q) (18) The above equation 7 denotes the values between the 0 and Where N yl (w) minimize the cardiovascular disease using 1. Then 0 denote no collision and 1 denotes perfect agreement. magnetic resonance heart image and gives the best solution for the sandpiper optimization algorithm. 5.5.2. Mean contour distance Step 6: Termination Consider, y b and y a are the dice surfaces equivalent to two The sandpiper optimization algorithm optimizes the disorders in the cardiovascular diseases in heart using binary segmentation masks b and a. The mean counter equation 18; here both the objective functions and constraint distance (MD) is defined as: functions are taken from magnetic resonance image and e(P, B )) 1 1 1 used to find the disorders in the heart. Finally, the outputs of M .D ( e( P, Ba ) y (21) sandpiper optimization (SPO) algorithm are achieved by 2 N y ly Nb zya b minimizing the cardiovascular diseases in heart based on Enhanced KNN Classifier, and the performance metrics are 5.1.3. Hausdorff distance (HD) shown in table 1. Then the Hausdorff distance (HD) is defined as: 4. RESULT AND DISCUSSION H .D Maxi ( Maxi e(P, B ), Maxi e( x, B ) X y (22) In this section, the simulation performance of proposed to lyb zya Enhance KNN classifier interms of Sandpiper optimization algorithm is used to optimize the CVD. Here the Where, e( P, B X ), min i e(P, x) denotes the minimum zy presentation metrics has been estimated using the technical metrics, such as Dice metric, mean contour and Hausdorff distance of point l from the points. Then the mean distance distance, for the clinically refer to LV, LVEDV, RVEDV and the Hausdorff distance calculate the largest distance and RVESV. The MATLAB simulations are performed on among two surfaces and it is very sensitivity. From equation PC with the Intel Core is, 2.50 GHz CPU, 8GB RAM and 7 and 8 the mean counter and Hausdorff distance is Windows 8. All simulation programs are implemented. Here calculated and the maximal distance at point Y and the proposed the accuracy, specificity, sensitivity, F-measure, segmentation counter Yb and Ya . Recall are performed in the cardiac disorders. Then the performance of the proposed method Sandpiper 5.1.4. Ejection Fraction optimization algorithm (SPO)gives better result when compared with existing method such as Random Forest Ejection Fraction (EF) is a vital cardiac parameter to Classifier (RFC) and principal component analysis (PCA). identify the cardiac output. And it is defined as 5.1 Evaluation Metrics EDV ESV EF 100% (23) EDV In this paper, different performance measures are used to calculate the results. The accuracy, are evaluated in Where EDV implies end – diastolic volume and ESV allocation task for the proposed CBIR framework. The implies end systolic volume. above-mentioned terms are calculated as, 5.1.5. myocardial Mass K A 0.5 Wrand (19) The myocardial mass (M. mass) and myocardial volume (M. Where Wrand a random number is lies on range of [0, 1]. volume) is defined as 5.1.1. Dice metrics M.mass M - volume(cm)3 1.06( gram / cm 3 ) (25) The dice metric can be calculated in the automated Then the performance metrics shows the LV, LVEDV, and Journal of Soft Computing and Engineering Applications, Vol. 1, No. 3, 2020
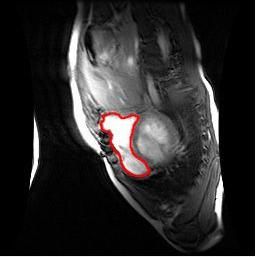
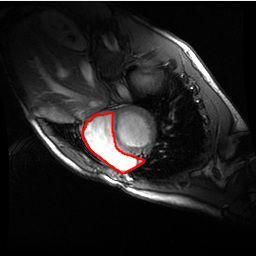
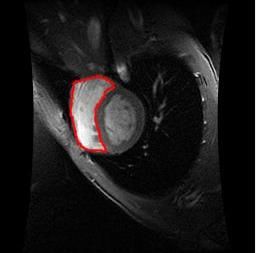
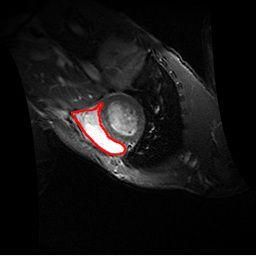
16 Received on Aug 2020

LVESV, LVM; RV, RVEDV and RVESV. ventricle End systolic volume are diagnosed using MRI
 image technique by using sand piper optimization (SPO)
5.2. Simulation Phase 1: MRI Medical Image for Cardio algorithm. The input image shows the Left ventricle MRI
vascular disease (CVD) image shows the abnormalities in the left ventricle wall
 position then the image is diagnosed during the End
The below figure 3 shows the segmented image for the diastolic volume, then also a cavity is found in the wall of
cardio vascular disease using magnetic resonance image the heart and then diagnosed the wall after segmentation
(MRI) [29, 30]. The segmentation process is done by using process. After analyzing the End Systolic wall thickness of
the proposed algorithm namely sandpiper optimization the heart, the cavity is found that is recognized and
algorithm. The below figure shows that automated diagnosed using the sand piper optimization algorithm.
segmented MRI image. Then the image variations are calculated by using fully deep
 The segmented images are calculated by using the Dice convolution Network, Deep convolution filters, Dice metric,
metric, mean contour and Hausdorff distance for Left mean contour and Hausdorff distance.
ventricle. In this the Left ventricle end diastolic volume, left

 Input image Left Ventricle LVEDV LVSEV Output image

 Figure 3: Shows the segmentation figure for Left ventricle

 Journal of Soft Computing and Engineering Applications, Vol. 1, No. 3, 2020
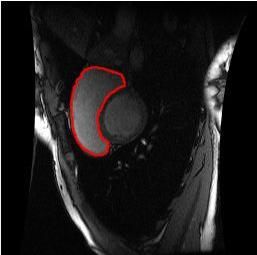
17 Received on Aug 2020

 Input image Right Ventricle RVEDV RVSEV Output image

 Figure 4: shows the segmentation figure for Right ventricle

The figure 4 shows the segmented image for the cardio vascular disease using magnetic resonance image (MRI).

 Journal of Soft Computing and Engineering Applications, Vol. 1, No. 3, 2020
18 Received on Aug 2020

The segmentation process is done by using the proposed
algorithm namely sandpiper optimization algorithm. The
below figure shows the automated segmented MRI image. Performance measure
The segmented images are calculated by using the Dice
metric, mean contour and Hausdorff distance for Left
ventricle. In this the Left ventricle end diastolic volume 10000
[31], Left ventricle End systolic volume are diagnosed using
MRI image technique by using sand piper optimization
(SPO) algorithm. The input image shows the Left ventricle EKNN-SPO
MRI image shows the abnormalities in the left ventricle wall
 0 (Proposed)
position then the image is diagnosed during the End
 RFC-PCA

 MCC
 Recall
 F-Measure
diastolic volume, then also a cavity is found in the wall of
the heart and then diagnosed the wall after segmentation
process. After analyzing the End Systolic wall thickness of
the heart, the cavity is found that is recognized and
diagnosed using the sand piper optimization algorithm.
Then the image variations are calculated by using fully deep
convolution Network, Deep convolution filters, Dice metric, Figure 6: Performance Metrics
mean contour distance and Harsdorf distance.
 Figure 6 shows the existing method such as RFC and
 PCA, set proposed sandpiper optimization (SPO) Shows the
5.3. Simulation Phase 1: Performance Comparison of better performance metrics in F-measure, Recall, Matthews
various methods correlation coefficient (MCC). At the node F-measure, the
 proposed sandpiper optimization (SPO) algorithm shows the
 F-measure, 8.79%, 12.5%,10%,16.47% higher than the
 Performance metrics Existing RFC and PCA, set the proposed sandpiper
 optimization (SPO). At the node Recall the proposed
 sandpiper optimization (SPO) algorithm shows the Recall,
 10000 8.13%, 12.04%, 14.81%, 3.33% higher than the RFC and
 PCA set the proposed sandpiper optimization (SPO). At the
 EKNN-SPO node Matthews correlation coefficient (MCC), the proposed
 (Proposed) sandpiper optimization (SPO) algorithm shows the
 0 Matthews correlation coefficient (MCC), 15.18%, 12.34%,
 RFC-PCA 13.75%,21.33% higher than the Existing RFC and PCA, set
 the proposed sandpiper optimization (SPO)respectively.

 Figure 5: Performance Metrics

 Figure 5 shows the existing method such as RFC and
PCA, set the proposed sandpiper optimization (SPO) Shows
the better performance metrics in Accuracy, Sensitivity,
Specificity. At the node Accuracy, the proposed sandpiper
optimization (SPO) algorithm shows the Accuracy, 3.1%,
6.45%, 6.0%, 4.21% higher than the Existing RFC and PCA
set the proposed sandpiper optimization (SPO). At the node
sensitivity the proposed sandpiper optimization (SPO)
algorithm shows the Sensitivity, 5.55%, 4.39%, 2.15%,
5.55% higher than the RFC and PCA, set the proposed
sandpiper optimization (SPO). At the node Specificity, the
proposed sandpiper optimization (SPO) algorithm shows the
Specificity, 6.59%, 8.98%, 5.43%, 2.10% higher than the
Existing RFC and PCA, set the proposed sandpiper Figure 7: Technical Metrics and mean values
optimization (SPO)respectively.

 Journal of Soft Computing and Engineering Applications, Vol. 1, No. 3, 2020
19 Received on Aug 2020

 Figure 7 shows the proposed sandpiper optimization than LV myocardium mass and RV. Then the Mean contour
(SPO) for Technical metrics in Dice metric, Mean Contour distance shows the Right ventricle cavity is higher than the
and Hausdorff Distance. From this graph the various Left ventricle cavity and myocardium mass. Then the
technical measures of Dice metric of LV cavity is higher Harsdorf Distance shows the Right ventricle cavity is higher
than LV myocardium mass and RV. Then the Mean contour than the Left ventricle cavity and myocardium mass and
distance shows the Left ventricle myocardium mass is comparing with existing methods such as RFC and PCA, set
higher than the Left ventricle cavity and Right ventricle the proposed sandpiper optimization (SPO) respectively.
cavity. Then the Harsdorf Distance shows the Right Figure 9 shows the existing method such as RFC and
ventricle cavity is higher than the Left ventricle cavity and PCA set the proposed sandpiper optimization (SPO) shows
myocardium mass and comparing with existing methods the improved Technical metrics and mean. At node the Left
such as RFC and PCA, set the proposed sandpiper Ventricle End systolic volumes lower than the obese person.
optimization (SPO) respectively. The LV Mass is lower than the obese person. The RVEDV
 is higher than the obese person. The LVESV is lower than
 the obese person, comparing with existing methods such as
 RFC and PCA, set the proposed sandpiper optimization
 (SPO) respectively.

 Figure 8: Technical Metrics and standard Deviation Figure 10: Clinical Measures and Standard deviation

 From figure 10 shows the existing method such as RFC
 and PCA set the proposed sandpiper optimization (SPO)
 shows the improved Technical metrics and standard
 deviation on LVEDV, LVESV, LVM, RVEDV, and
 RVESV. From the graph, for the normal person at node The
 LVEDV is lower than the obese person. At node the
 LVESV is lower than the obese person. The LV Mass is
 lower than the obese person. The RVEDV is lower than the
 obese person. The LVESV is higher than the obese person,
 comparing with existing methods such as RFC and PCA set
 the proposed sandpiper optimization (SPO) respectively.
 Figure 11 shows the manual mode of proposed
 sandpiper optimization (SPO), shows the better clinical
 measures and mean in Left ventricle stroke volume, left
 ventricular ejection fraction, left ventricular cardiac output,
 Right ventricular stroke volume, Right ventricular Ejection
 Figure 9: Clinical Measures and mean fraction, Right ventricle cardiac output. At node Left
 ventricle stroke volume, the manual observation is higher
 Figure 8 shows the proposed sandpiper optimization than the observation 1, 2, 3. At the node Left ventricle
(SPO) for Technical metrics in Dice metric, Mean Contour ejection fraction the manual observation is higher than the
and Hausdorff Distance. From this graph the various observation 1, 2, 3. At the node Left ventricle cardiac output
technical measures of Dice metric of LV cavity is higher the manual and observation value is equal when compare

 Journal of Soft Computing and Engineering Applications, Vol. 1, No. 3, 2020
20 Received on Aug 2020

with observation 1, 2. At the node Right ventricle stroke 2. S. Hamada, D. Kashiwazaki, S. Yamamoto, N. Akioka,
volume the observation 1 is higher than the manual output N. Kuwayama and S. Kuroda, Impact of Plaque
and observation 2, 3. At the node Right ventricle ejection Composition on Risk of Coronary Artery Diseases in
fraction observation 3 is higher than the manual output and Patients with Carotid Artery Stenosis, Journal of
observation 1, 2. At the node Left ventricle cardiac output Stroke and Cerebrovascular Diseases, vol. 27, no. 12,
the manual output is higher than the observation 1,2,3 and pp. 3599-3604, 2018. Available:
comparing with existing methods such as RFC and PCA, set 10.1016/j.jstrokecerebrovasdis.2018.08.031.
the proposed sandpiper optimization (SPO) respectively. 3. L. Bavia, K. Lidani, F. Andrade, M. Sobrinho, R.
 Nisihara and I. de Messias-Reason, Complement
 activation in acute myocardial infarction: An early
 marker of inflammation and tissue
 injury?, Immunology Letters, vol. 200, pp. 18-25,
 2018.
 4. M. Slavich, G. Pizzetti, A.M. Vella, C. Carlucci, D.
 Margonato, R. Spoladore, G. Fragasso, and A.
 Margonato, Extracorporeal myocardial shockwave
 therapy; a precious blast for refractory angina
 patients, Cardiovascular Revascularization Medicine,
 vol. 19, no. 3, pp. 263-267, 2018. Available:
 10.1016/j.carrev.2017.09.018.
 5. H. Miptah, A. Ramli, M. Mohamad, H. Hashim and Z.
 Tharek, Non-alcoholic fatty liver disease (NAFLD)
 and the cardiovascular disease (CVD) risk
 categories in primary care: is there an
 Figure 11: Clinical Measures and mean association?, BMC Family Practice, vol. 21, no. 1,
 2020. Available: 10.1186/s12875-020-01306-7
5. CONCLUSION 6. A. Gheorghe, U. Griffiths, A. Murphy, H. Legido-
 Quigley, P. Lamptey and P. Perel, The economic
In this paper, to detect the Cardio vascular Diseases (CVD) burden of cardiovascular disease and hypertension
in Heart is identified by the method Enhanced KNN in low- and middle-income countries: a systematic
Classifier using the proposed algorithm known as Sandpiper review, BMC Public Health, vol. 18, no. 1, 2018.
optimization algorithm (SPO) in clinical basis. In this, the Available: 10.1186/s12889-018-5806-x
use of CVD- MRI image is taken as the input image then the 7. R. Alizadehsani, M.J. Hosseini, A. Khosravi, F.
disease is optimized using Sand piper optimization Khozeimeh, M. Roshanzamir, N.Sarrafzadegan, and S.
algorithm. The complications in LVEDV, LVESV, LVM, Nahavandi, Non-invasive detection of coronary
RVEDV, RVESV are optimizes using the proposed method artery disease in high-risk patients based on the
sandpiper algorithm (SPO). In this a cavity is noticed and stenosis prediction of separate coronary
that cavity is diagnosed using this method and then the arteries, Computer Methods and Programs in
image is analyzed using Dice metric, mean contour, and Biomedicine, vol. 162, pp. 119-127, 2018. Available:
Hausdorff distance Method. The experimental outcomes 10.1016/j.cmpb.2018.05.009.
demonstrate that proposed system sandpiper shows the 8. E. Makovac, J. Thayer and C. Ottaviani, A meta-
better performance such as accuracy of proposed system analysis of non-invasive brain stimulation and
shows the 3.56%, sensitivity shows 6.45%, Specificity autonomic functioning: Implications for brain-heart
shows 8.554%. F-measure shows the 4.556%, Recall shows pathways to cardiovascular disease, Neuroscience &
the 9.57%, for compared with different nodes when Biobehavioral Reviews, vol. 74, pp. 330-341, 2017.
compared with the existing method RFC and PCA set the Available: 10.1016/j.neubiorev.2016.05.001.
proposed sandpiper optimization (SPO) respectively. 9. P. Maury, P. Defaye, D. Klug, C. Alonso, F. Anselme,
 L. Fauchier, E. Gandjbakhch, D. Gras, J.S. Hermida,
REFERENCES G.Laurent, and J. Mansourati,Position paper
 concerning the competence, performance and
1. F. Yu, N. Selva Kumar, D. Choudhury, L. Foo and S. environment required for the practice of ablation in
 Ng, Microfluidic platforms for modeling biological children and in congenital heart disease, Archives of
 barriers in the circulatory system, Drug Discovery Cardiovascular Diseases, vol. 113, no. 8-9, pp. 492-
 Today, vol. 23, no. 4, pp. 815-829, 2018. Available: 502, 2020. Available: 10.1016/j.acvd.2020.02.002 [
 10.1016/j.drudis.2018.01.036. 10. C. El-Hajj and P. Kyriacou, A review of machine
 learning techniques in photoplethysmography for

 Journal of Soft Computing and Engineering Applications, Vol. 1, No. 3, 2020
21 Received on Aug 2020

 the non-invasive cuff-less measurement of blood based on hybrid feature selection and enhanced
 pressure, Biomedical Signal Processing and Control, KNN classifier, Knowledge-Based Systems, vol. 205, p.
 vol. 58, p. 101870, 2020. Available: 106270, 2020. Available:
 10.1016/j.bspc.2020.101870 10.1016/j.knosys.2020.106270.
11. W. AlJaroudi and F. Hage, Review of Cardiovascular 21. A. Stephenson, S. McDonough, M. Murphy, C. Nugent
 Imaging in the Journal of Nuclear Cardiology in and J. Mair, Using computer, mobile and wearable
 2016. Part 1 of 2: Positron Emission Tomography, technology enhanced interventions to reduce
 Computed Tomography and Magnetic sedentary behaviour: a systematic review and meta-
 Resonance, Journal of Nuclear Cardiology, vol. 24, no. analysis, International Journal of Behavioral Nutrition
 2, pp. 649-656, 2017. Available: 10.1007/s12350-017- and Physical Activity, vol. 14, no. 1, 2017. Available:
 0820-4 10.1186/s12966-017-0561-4.
12. G. Verma, R. Kesharwani, P. Veeresh, H. Kaur, D. 22. S. Mohan, C. Thirumalai and G. Srivastava, Effective
 Sarmah, V. Kotian, L. Mounica, A.Borah, K. Kalia, and Heart Disease Prediction Using Hybrid Machine
 P. Bhattacharya, Advances in Diagnostic Techniques Learning Techniques, IEEE Access, vol. 7, pp. 81542-
 for Therapeutic Intervention, Biomedical 81554, 2019. Available: 10.1109/access.2019.2923707.
 Engineering and its Applications in Healthcare, pp. 23. P. Pławiak and U. Acharya, Novel deep genetic
 105-121, 2019. Available: 10.1007/978-981-13-3705- ensemble of classifiers for arrhythmia detection
 5_5 using ECG signals, Neural Computing and
13. A. Lam, Update on Adrenal Tumours in 2017 World Applications, vol. 32, no. 15, pp. 11137-11161, 2019.
 Health Organization (WHO) of Endocrine Available: 10.1007/s00521-018-03980-2.
 Tumours, Endocrine Pathology, vol. 28, no. 3, pp. 24. F. Andreotti, O. Carr, M. Pimentel, A. Mahdi and M.
 213-227, 2017. Available: 10.1007/s12022-017-9484-5. De Vos, Comparing Feature Based Classifiers and
14. S. Kazemifar et al., MRI-only brain radiotherapy: Convolutional Neural Networks to Detect
 Assessing the dosimetric accuracy of synthetic CT Arrhythmia from Short Segments of ECG, 2017
 images generated using a deep learning Computing in Cardiology Conference (CinC), 2017.
 approach, Radiotherapy and Oncology, vol. 136, pp. Available: 10.22489/cinc.2017.360-239.
 56-63, 2019. Available: 10.1016/j.radonc.2019.03.026 25. A. Davari Dolatabadi, S. Khadem and B. Asl,
15. S. Fahle, C. Prinz and B. Kuhlenkötter, Systematic Automated diagnosis of coronary artery disease
 review on machine learning (ML) methods for (CAD) patients using optimized SVM, Computer
 manufacturing processes – Identifying artificial Methods and Programs in Biomedicine, vol. 138, pp.
 intelligence (AI) methods for field 117-126, 2017. Available:
 application, Procedia CIRP, vol. 93, pp. 413-418, 10.1016/j.cmpb.2016.10.011.
 2020. Available: 10.1016/j.procir.2020.04.109 26. J. Wang et al., Detecting Cardiovascular Disease
16. F. García-Peñalvo and A. Mendes, Exploring the from Mammograms With Deep Learning, IEEE
 computational thinking effects in pre-university Transactions on Medical Imaging, vol. 36, no. 5, pp.
 education, Computers in Human Behavior, vol. 80, pp. 1172-1181, 2017. Available:
 407-411, 2018. Available: 10.1016/j.chb.2017.12.005 10.1109/tmi.2017.2655486.
17. M. Alkadri, M. Turrin and S. Sariyildiz, A 27. E. Cariou et al., Diagnostic score for the detection of
 computational workflow to analyse material cardiac amyloidosis in patients with left ventricular
 properties and solar radiation of existing contexts hypertrophy and impact on prognosis, Amyloid, vol.
 from attribute information of point cloud 24, no. 2, pp. 101-109, 2017. Available:
 data, Building and Environment, vol. 155, pp. 268-282, 10.1080/13506129.2017.1333956
 2019. Available: 10.1016/j.buildenv.2019.03.057. 28. D. Zentner et al., A rapid scoring tool to assess
18. M. Khened, V. Kollerathu and G. Krishnamurthi, Fully mutation probability in patients with inherited
 convolutional multi-scale residual DenseNets for cardiac disorders, European Journal of Medical
 cardiac segmentation and automated cardiac Genetics, vol. 61, no. 2, pp. 61-67, 2018. Available:
 diagnosis using ensemble of classifiers, Medical 10.1016/j.ejmg.2017.10.020
 Image Analysis, vol. 51, pp. 21-45, 2019. Available: 29. V.P. Kamphuis, J.J.M. Westenberg, R.L. van der Palen,
 10.1016/j.media.2018.10.004. N.A.Blom, A.de Roos, R. van der Geest, M.S. Elbaz,
19. A. Kaur, S. Jain and S. Goel, Sandpiper optimization and A.A. Roest, Unravelling cardiovascular disease
 algorithm: a novel approach for solving real-life using four dimensional flow cardiovascular
 engineering problems, Applied Intelligence, vol. 50, magnetic resonance, The International Journal of
 no. 2, pp. 582-619, 2019. Available: 10.1007/s10489- Cardiovascular Imaging, vol. 33, no. 7, pp. 1069-1081,
 019-01507-3. 2016. Available: 10.1007/s10554-016-1031-9
20. W. Shaban, A. Rabie, A. Saleh and M. Abo-Elsoud, A 30. M. Modak, M. Frey, S. Yi, Y. Liu and E. Scott,
 new COVID-19 Patients Detection Strategy (CPDS) Employment of targeted nanoparticles for imaging

 Journal of Soft Computing and Engineering Applications, Vol. 1, No. 3, 2020
22 Received on Aug 2020

 of cellular processes in cardiovascular remodeling in patients with β-thalassemia major. An
 disease, Current Opinion in Biotechnology, vol. 66, pp. emerging differential diagnosis with left ventricle
 59-68, 2020. Available: 10.1016/j.copbio.2020.06.003 noncompaction disease, Clinical Imaging, vol. 45, pp.
31. E. Chiodi, M. Nardozza, M.R. Gamberini, A. Pepe, M. 58-64, 2017. Available:
 Lombardi, G.Benea, and D. Mele, Left ventricle 10.1016/j.clinimag.2017.05.010.

 Journal of Soft Computing and Engineering Applications, Vol. 1, No. 3, 2020
You can also read