Comorbid Chronic Diseases are Strongly Correlated with Disease Severity among COVID-19 Patients: A Systematic Review and Meta-Analysis
←
→
Page content transcription
If your browser does not render page correctly, please read the page content below
Volume 11, Number 3; 668-678, June 2020
                                                                            http://dx.doi.org/10.14336/AD.2020.0502

                                                             Review

Comorbid Chronic Diseases are Strongly Correlated with
Disease Severity among COVID-19 Patients: A Systematic
               Review and Meta-Analysis
                         Hong Liu1 , Shiyan Chen2 , Min Liu1 , Hao Nie3 , Hongyun Lu4*
1
  Department of Nutrition, the Third Xiangya Hospital of Central South University, Changsha, China. 2 Department
of Endocrinology & Metabolism, the Fifth Affiliated Hospital of Sun Yat-sen University, Zhuhai, China.
3
  Department of Geriatrics, the First Affiliated Hospital of Hunan Normal University, Changsha, China.
4
  Department of Endocrinology & Metabolism, Zhuhai Hospital Affiliated with Jinan University, Zhuhai People’s
Hospital, Zhuhai, China.
                                [Received April 16, 2020; Revised May 1, 2020; Accepted May 2, 2020]

    ABSTRACT: Coronavirus disease 2019 (COVID-19) has resulted in considerable morbidity and mortality
    worldwide since December 2019. In order to explore the effects of comorbid chronic diseases on clinical outcomes
    of COVID-19, a search was conducted in PubMed, Ovid MEDLINE, EMBASE, CDC, and NIH databases to
    April 25, 2020. A total of 24 peer-reviewed articles, including 10948 COVID-19 cases were selected. We found
    diabetes was present in 10.0%, coronary artery disease/cardiovascular disease (CAD/CVD) was in 8.0%, and
    hypertension was in 20.0%, which were much higher than that of chronic pulmonary disease (3.0%). Specifically,
    preexisting chronic conditions are strongly correlated with disease severity [Odds rati o (OR) 3.50, 95% CI 1.78
    to 6.90], and being admitted to intensive care unit (ICU) (OR 3.36, 95% CI 1.67 to 6.76); in addition, compared
    to COVID-19 patients with no preexisting chronic diseases, COVID-19 patients who present with either diabetes,
    hypertension, CAD/CVD, or chronic pulmonary disease have a higher risk of developing severe disease, with an
    OR of 2.61 (95% CI 1.93 to 3.52), 2.84 (95% CI 2.22 to 3.63), 4.18 (95% CI 2.87 to 6.09) and 3.83 (95% CI 2.15 to
    6.80), respectively. Surprisingly, we found no correlation between chronic conditions and increased risk of
    mortality (OR 2.09, 95% CI 0.26 to16.67). Taken together, cardio-metabolic diseases, such as diabetes,
    hypertension and CAD/CVD were more common than chronic pulmonary disease in COVID-19 patients,
    however, each comorbid disease was correlated with increased disease severity. After active treatment, increased
    risk of mortality in patients with preexisting chronic diseases may reduce.

Key words: coronavirus disease 2019 (COVID-19), diabetes, cardiovascular diseases, hypertension, chronic
pulmonary disease, meta-analysis

The recent outbreak of COVID-19 has been rapidly                     considerable morbidity and mortality in more than 200
spreading on a global scale[1]. On January 30, 2020, the             countries and regions worldwide. At present, the number
World Health Organization (WHO) declared that the                    of patients with COVID-19 is rapidly rising to nearly 3
epidemic of COVID-19 was a public health emergency of                million, and its harm to human beings has exceeded the
international concern (PHEIC). COVID-19 has resulted in              outbreak of severe acute respiratory syndrome (SARS) in
*Correspondence should be addressed to: Dr. Hongyun Lu, Department of Endocrinology & Metabolism, Zhuhai Hospital Affiliated
with Jinan University, Zhuhai People’s Hospital, Zhuhai 519000, Guangdong, China. E-mail: luhongy@mail.sysu.edu.cn
Copyright: © 2020 Liu H et al. This is an open-access article distributed under the terms of the Creative Commons Attribution License,
which permits unrestricted use, distribution, and reproduction in any medium, provided the original author and source are credited.

ISSN: 2152-5250                                                                                                                  668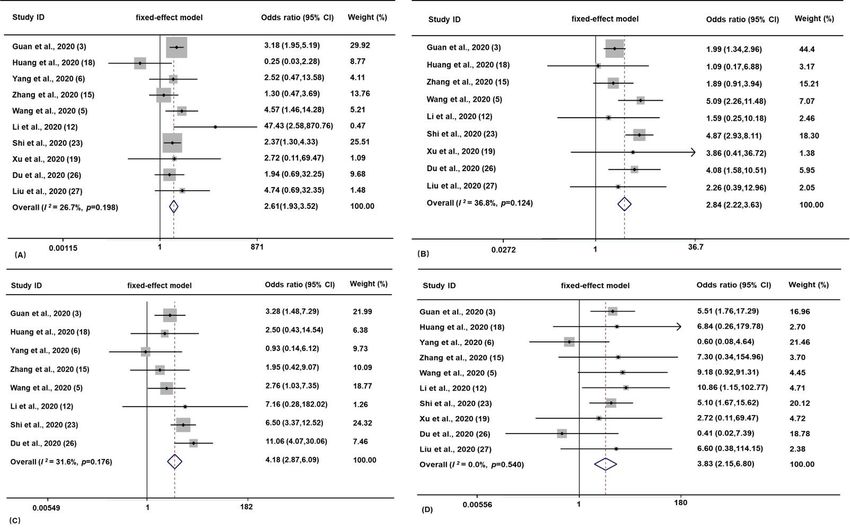
Liu H., et al                                                                                   Comorbidities predict COVID-19 severity

2002 and Middle East respiratory syndrome (MERS) in                               2019’’, ‘‘2019 novel coronavirus’’, ‘‘COVID-19’’,
2012 [2]. As of April 29, 2020, more than 200,000 people                          ‘‘2019-nCov’’, or ‘‘SARS Cov-2’’ AND ‘‘Diabetes”,
all over the world lost their life because of the infection of                    “Hypertension”, “Chronic pulmonary disease” or
SARS-CoV-2, with a crude death rate of 6.95%.                                     “Cardiovascular disease”. The search was limited to
     COVID-19 is general susceptibility [3-7] and is                              articles describing the epidemiological, demographic,
accompanied by a cluster of flu-like symptoms [6] and                             clinical features, outcomes and reporting the prevalence
life-threatening severe illnesses including acute                                 of chronic diseases in COVID-19 patients. Reports
respiratory distress syndrome (ARDS), acute kidney                                published as review articles, letters, case studies,
injury, myocarditis, and organ failure [6, 8]. It is believed                     editorials, conference abstracts, vaccination trials, family-
that middle-aged and elderly patients with chronic                                based studies, and articles without abstracts were
diseases, such as diabetes, cardiovascular diseases and                           excluded.
hypertension are susceptible to respiratory failure and                           The search identified 427 records; an additional eight
may have a poorer outcome [6, 8]. Evaluating the                                  reports were identified from a search of the bibliographies
prevalence of these chronic conditions is fundamental to                          of previously obtained articles and other sources such as
mitigate COVID-19 complications and mortality.                                    Google, Google Scholar, and the AMED (Allied and
However, this effort has been hindered by the limited                             Complementary Medicine) search engine, for a total of
number of cases in some studies, and the varying study                            435 records. Following screening for duplicate records,
designs [9-11].                                                                   the 435 records were all retained for abstract scanning
     This present study was aimed to provide a systematic                         against the above-mentioned inclusion/exclusion criteria.
evaluation and detailed estimate on the prevalence and                            The abstracts of the identified studies were reviewed
effects of preexisting chronic conditions in COVID-19                             independently by both authors. Differences were resolved
patients. This assessment may aid the public health sector                        through discussion, until a consensus was reached. The
while developing policies for surveillance, preparedness,                         abstract review resulted in the exclusion of 365 records.
and response to COVID-19 and its severe outcomes.                                 Full-text retrieval and review were conducted for the
                                                                                  remaining 70 articles. 46 studies were then eliminated
MATERIALS AND METHODS                                                             based upon the above selection criteria (Fig. 1). The
                                                                                  percentage agreement on the inclusion between the two
Search strategy and selection criteria                                            reviewers was 90%, with Cohen’s kappa statistic k = 0.80
                                                                                  [95% confidence interval (95% CI) 0.75 to 0.89]. A total
A search was conducted in PubMed, Ovid MEDLINE,                                   of 24 peer-reviewed articles were selected for the present
EMBASE, CDC, and NIH databases to 25 April, 2020                                  study (Table 1) [3-6, 8, 12-30].
using the search terms (MeSH) ‘‘Coronavirus disease

 Table 1. Characteristics of the included studies and meta -analysis of the clinical symptoms and comorbid chronic diseases
 in patients with COVID-19.

                                       n                                         Symptoms (%)                          Comorbidities(%)
                                                            Age
                          Dates                    Age      ≥50                        shortness
  Study[ref]     a                                                             fatigue                                                  chronic
                     NO (mm. yy)                 (years)   years                       of breath diarrhe               hypertensio CAD/
                      S          All   M    F                      fever cough    or       or       a       diabetes       n       CVD pulmonary
                                                            (%)                myalgia                                                   disease
                                                                                       dyspnea
 Guan et               12.19-
                     8 01.20     1099 640 459     47.0     44.0    88.7   67.8    38.1    18.7       3.8      7.4        15.0     2.5     1.1
 al.,2020 [3]
 Chen et               01.20-                                                                                              b
                     7 01.20     99    67   32    55.5     67.7    82.8   81.8    11.0    31.3       2.0     13.0                 40.0     1
 al.,2020 [4]
 Huang et              12.19-
                     6           41    30   11    49.0     48.8    98.0   76.0    44.0    55.0       3.0     20.0        15.0     15.0    2.0
 al.,2020 [18]         01.20
 Liu et                12.19-                                b
                     7           137   61   76    55.0             81.8   48.2    32.1    19.0       8.0     10.2         9.5     7.3     1.5
 al.,2020 [8]          01.20
 Shi et              6 12.19-    81    42   39    49.5     49.4    73.0   59.0     b
                                                                                          42.0       4.0     12.0        15.0     10.0    11
 al.,2020 [22]         01.20
 Song et               01.20-
                     6 01.20     51    25   26    49.0     47.1    96.0   47.0    31.0    14.0      10.0      6.0        10.0     2.0     2.0
 al.,2020 [20]
 Yang et               12.19-                                                                         b                    b
                     7           52    35   17    59.7     55.0    98.0   77.0    11.5    63.5               17.0                 10.0     8
 al.,2020 [6]          01.20
 Xu et                 01.20-                                b                              b                                      b
                     7           62    35   27    41.0             77.0   81.0    52.0               8.0      2.0         8.0             2.0
 al.,2020 [19]         01.20
 Zhang et            8 01.20-    140   71   69    57.0     70.0    78.6   64.3    64.3    31.4      12.9     12.1        30.0     5.0     2.8
 al.,2020 [15]         02.20

Aging and Disease • Volume 11, Number 3, April 2020                                                                                       669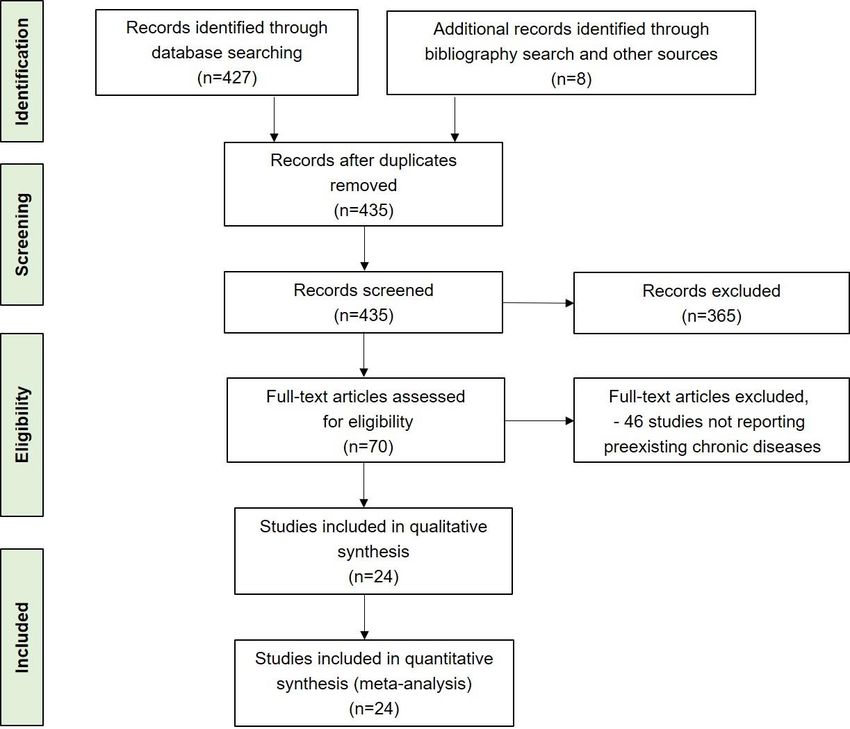
Liu H., et al                                                                                              Comorbidities predict COVID-19 severity

 Wu et           01.20-                                                                                                                     b
 al.,2020 [16] 7 02.20            80     39    41    46.0      35.0      78.8   63.8     22.5        37.5        1.3          6.3                         31.3    1.25
 Hu et           01.20-                                                                                b          b
               6                  24     8     16    32.5      37.5      20.8    8.3      8.3                                 8.3          8.3            4.2     0.0
 al.,2020 [14]   02.20
 Huang et        12.19-                                          b
               7                  34     14    20    56.2                94.1   50.0     64.7        14.7       14.7          11.8        23.5            17.6    8.8
 al.,2020 [17]   01.20
 Yang et         01.20-                                          b                                                                          b
               8 02.20           149     81    68    45.1                76.5   58.4      3.4         1.3        7.4          6.0                         18.8    0.7
 al.,2020 [13]
 Wang et         01.20-                                          b
               7                 138     75    63    56.0                98.6   59.4     69.6        31.2       10.1          10.1        31.2            14.5    2.9
 al.,2020 [5]    01.20
 Xu et           01.20-                                          b                                     b
               7                  90     39    51    50.0                78.0   63.0     28.0                    6.0          6.0         19.0            3.0     1.0
 al.,2020 [21]   02.20
 Li et al.,20207 01.20-           83     44    39    45.5        b
                                                                         86.7   78.3     18.1        10.8        8.4          7.8          6.0            1.2     6.0
 [12]
                 02.20
 Shi et          01.20-                                          b
               8                 416    205 211       64                 80.3   34.6     13.2        28.1        3.8          14.4        30.5            10.6    2.9
 al.,2020 [23]   02.10
 Bhatraju et     02.20-                                          b                         b                      b                         b              b
               6                  24     15    9      64                 50.0   88.0                 88.0                     58.0                                16.7
 al.,2020[24]    03.20
 Feng et         01.20-                                          b
               7                 476    271 205       53                 81.9   56.5     11.6        22.9       10.3          10.3        23.7            8.0     4.6
 al.,2020 [25]   02.20
 Du et
          [26] 8 12.19-          179     97    82    57.6      72.6      98.9   81.6     39.7        49.7       21.8          18.4        32.4            16.2    4.5
 al.,2020        02.20
 Liu et          12.19-                                          b                         b           b          b                                        b
               6 01.20            78     39    39     38                 73.1   43.6                                          6.4         10.3                    2.6
 al.,2020 [27]
 Grasselli et    02.20-                                                   b       b        b           b          b
               8                 1591 1304 287        63       87.2                                                           11.3        32.0            14.0    2.6
 al.,2020 [28]   03.20
 Richardson et   03.20-                                                           b        b                      b
               8                 5700 3437 2263       63       78.5      30.4                        17.3                     31.8        53.0            16.9    8.4
 al.,2020[29]    04.20
 Simonnet et     02.20-                                                   b       b        b           b          b                                        b        b
               7                 124     90    34     60       1.00                                                           22.6        48.4
 al.,2020[30]    04.20
                                                 52.4c
                     12.19-
 Total/Overall                  10948 6764 4184 (32.5-
                     04.20
                                                64.0) d
 Prevalencee                                                   59.0      79.0   61.0     32.0        31.0        7.0          10.0        20.0            8.0     3.0
                                                                         65.0- 54.0-                 25.0-
 95% CI                                                      49.0-68.0               21.0-43.0                 5.0-9.0      8.0-12.0    15.0-26.0 3.0-12.0       1.0-3.0
                                                                         92.0 69.0                   37.0
 I2 (%)                                                        98.5      99.7   95.1     98.5        97.4       81.1          73.0        94.2            98.0    94.5

 mm, month; yy, year; M, male; F, female; SE, standard error; CI, confidence interval, NOS, Newcastle-Ottawa Scale;
 a [3]- [8], [12]-[23], [25]-[27]
                                  Studies were from China; [24], [29] studies were from America; [28] study was from Italy; [30] study was from France.
 b
   Any empty cells represents the absence of data in the original text.
 c
   the median age [IQR].
 d
   Age range.
 e
   Meta-analysis for the prevalence was calculated from binary random-effects model analysis.
 f
   p < 0.001.

Data Extraction and Quality Assessment                                                   correlation between comorbid chronic diseases and
                                                                                         adverse outcomes [increased risk of disease severity,
We used Newcaltle-Ottawa scale (NOS) (Table 1) for                                       admittance to intensive care unit (ICU), and mortality].
evaluating the quality of the included studies and
Preferred Reporting Items for Systematic Reviews and                                     Statistical Analysis
Meta-Analyses (PRISMA) standards (Supplementary
Table 1) for abstracting data and assessing data quality                                 All analyses were performed using Stata/SE 16.0. Results
and validity. Independent extraction was conducted by                                    about the correlation between comorbid chronic diseases
two observers. NOS scores of at lease six were considered                                and adverse outcomes were expressed as pooled odds
high-quality literature.                                                                 ratios (OR), and 95% CI. OR values > 1 represent a direct
     The prevalence of preexisting chronic diseases                                      association and < 1 an inverse association. The size of the
including diabetes, hypertension, coronary artery                                        squares was correlated with the weight of the selected
disease/cardiovascular disease (CAD/CVD) and chronic                                     study [31].
pulmonary disease, together with clinical symptoms such                                       The results of the included studies were performed
as fever, cough, fatigue or myalgia and shortness of breath                              with fixed/random-effect models. We used the I2 statistics
or dyspnea were extracted from the identified studies. The                               to assess the magnitude of heterogeneity: 25%, 50%, and
primary outcome measure was the prevalence of                                            75% represented low, moderate, and high degrees of
comorbid chronic diseases in COVID-19 patients and the                                   heterogeneity, respectively. The chosen of the proper

Aging and Disease • Volume 11, Number 3, April 2020                                                                                                               670
Liu H., et al Comorbidities predict COVID-19 severity effect model was based on the analysis results: the fixed The potential for publication bias was addressed by effect model was used if I2 < 50% and the random effect drawing Begg funnel plots and Egger’s linear regression model was used if I2 ≥ 50% [31]. test plots; and p
Liu H., et al Comorbidities predict COVID-19 severity
Characteristics of the included studies grouped by Meta-analysis of the identified studies showed that
disease severity in patients with COVID-19 the incidence of fever, cough and fatigue or myalgia in
severe patients was higher than that in mild patients, but
Among the 10948 cases, 2699 cases were severe patients there was no significant difference (p was 0.28, 0.10 and
(Table 2). The sex ratio (male to female) in severe and 0.24, respectively). The incidence of shortness of breath
non-severe group has no statistical significance (the ratio or dyspnea in severe patients was significantly higher than
is 2.66 and 1.21, respectively, p=0.55), and the median that in mild patients (p=0.006). The incidence of diarrhea
age of the subjects in severe group was older than non- was the same in the two groups (p=0.18) (Table 2).
severe group [60.9 years (range 45.0 to 74.0 years) vs 43.8
years (range 37.0 to 60.0 years), p=0.003] (Table 2).
Table 2. Characteristics of the included studies grouped by severe and non -severe cases and meta -analysis of the clinical
symptoms and comorbid chronic diseases in patients with COVID-19.
n Symptoms( %) Comorbidities( %)
shortness
chronic
fatigue or of breath hypertensio CAD/CV
Study[ref]a non-severe severe fever cough diarrhea diabetes pulmonary
myalgia or n D
disease
dyspnea
sever sever sever sever sever mil sever mil sever
All M F age All M F age mild mild mild mild mild mild severe mild severe
e e e e e d e d e
Guan et
926 540 386 45.0 173 100 73 52.0 88.1 91.9 67.3 70.5 37.8 39.9 15.1 37.6 3.5 5.8 5.7 16.2 13.5 23.7 1.8 5.8 0.6 3.5
al.,2020 [3]
Huang et
28 19 9 49.0 13 11 2 49.0 96.0 100.0 71.0 85.0 39.0 54.0 37.0 92.0 4.0 0.0 25.0 8.0 14.0 15.0 11.0 23.0 0.0 8.0
al.,2020 [18]
Yang et b b b b
20 14 6 51.9 32 21 11 64.6 100.0 97.0 75.0 78.0 10.0 12.5 60.0 66.0 10.0 22.0 10.0 9.0 10.0 6.0
al.,2020 [6]
Xu
b b b b
et.al.,2020 29 16 13 39 33 19 14 45 83 73 79 82 45 58 0 9 0.0 3.0 3.0 12.0 0 3.0
[19]
Zhang et
82 38 44 51.5 58 33 25 64.0 72.0 87.9 54.9 77.6 62.2 67.2 24.4 41.4 11.0 15.5 11.0 13.8 24.4 37.9 3.7 6.9 0.0 3.4
al.,2020 [15]
Wang et
102 53 51 51.0 36 22 14 66.0 98.0 100.0 59.8 58.3 35.3 33.3 19.6 63.9 7.8 16.7 5.9 22.2 21.6 58.3 10.8 25.0 1.0 8.3
al.,2020 [5]
Li et
58 29 29 41.9 25 15 10 53.7 86.2 88.0 70.7 96.0 17.2 20.0 3.4 28.0 8.6 8.0 0.0 28.0 5.2 8.0 0.0 4.0 1.7 16.0
al.,2020 [12]
Shi et
334 161 173 60 82 44 38 74 81.1 76.8 34.7 34.1 12 18.3 27.2 31.7 4.5 1.2 12 24.4 23.4 59.8 6 29.3 1.8 8.5
al.,2020 [23]
Bhatraju b b b b b b b b b b b b b b b b b
24 15 9 64.0 50.0 88.0 88.0 58.0 16.7
etal.,2020 [24]
Feng et b b b b
476 271 205 b
0 85.9 0 59.4 0 12.6 0 24.4 0 11.0 0 10.3 0 23.7 0 8.0 0 4.6
al.,2020 [25]
Du et 158 87 71 56 21 10 11 70.2 98.7 100 83.5 66.7 36.7 61.9 44.9 85.7 19.6 38.1 17.1 28.6 28.5 61.9 10.8 57.1 5.1 0
al.,2020 [26]
Liu et 67 32 35 37 11 7 4 66 b b
44.8 46.4 b b b b b b
4.5 18.2 9 18.2 b b
1.5 9.1
al.,2020 [27]
Grasselli et b b b b 159 b b b b b b b b b b b b b b
1304 287 63 11.3 32 14 2.6
al.,2020 [28] 1
Simonnet et b b b b
124 90 34 60 b b b b b b b b b b b
22.6 b
48.4 b b b b
al.,2020 [30]
c
60.9
43.8 c (45.0
Total/Overal 184 269
989 817 (37.0- 1962 737 -
l 0 d 9
60.0) 74.0)
d
e
Prevalence 90.0 99.0 64.0 71.0 32.0 37.0 27.0 55.0 8.0 8.0
52.0 21.0 17.0
86.0- 98.0- 60.0- 24.0- 39.0- 4.0- 4.0-
95% CI - - -
95.0 100.0 81.0 50.0 71.0 11.0 13.0
75.0 44.0 36.0
Qf
I2 (%) 95.5 94.0 95.4 91.7 95.6 94.2 94.4 95.9 81.2 92.5
M, male; F, female; SE, standard error; CI, confidence interval.
a [3], [18], [6], [15], [5], [12], [19], [23], [25], [26], [27]
Studies were from China; [24] study was from America; [28] study was from Italy; [30] study was from France.
b
Any empty cells represents the absence of data in the original text.
Aging and Disease • Volume 11, Number 3, April 2020 672Liu H., et al Comorbidities predict COVID-19 severity
c
the median age [IQR].
d
Age range.
e
Meta-analysis for the prevalence was calculated from binary random-effects model analysis.
f
p < 0.001.
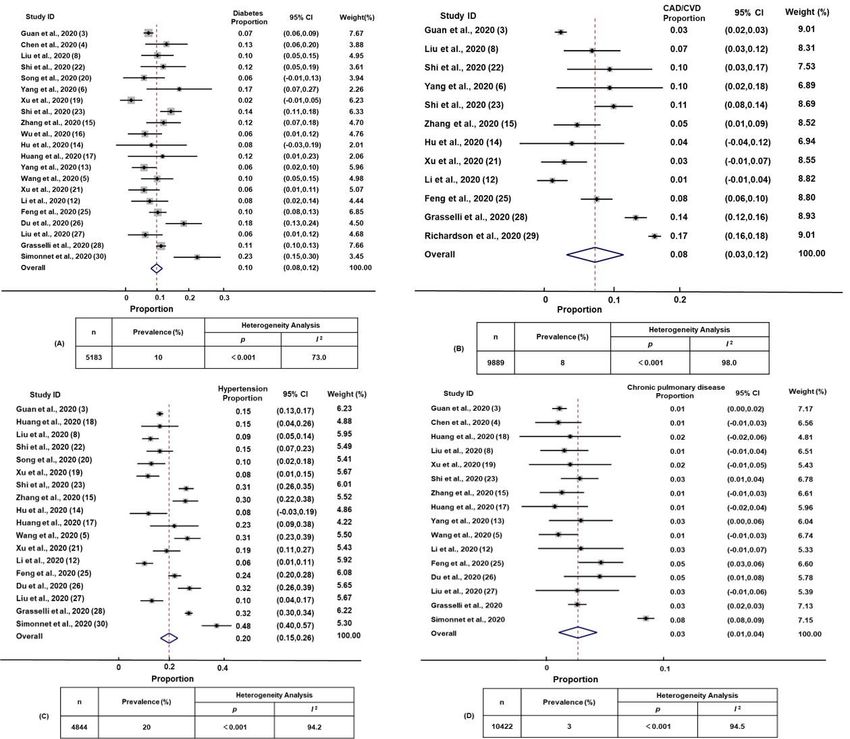
Figure 2. The proportions of comorbid chronic diseases in patients with COVID-19. Forest plot showing the proportion of
comorbid diabetes (A), coronary artery disease/cardiovascular disease (CAD/CVD) (B), hypertension (C), and chronic pulmonary
disease (D) in SARS-CoV-2-infected patients. Weights were calculated from random-effects model analyses. The size of the squares
reflects the relative weight of each study in the meta-analysis. Inserts within each panel show the total number of subjects analyzed
(n) and prevalence (%) of the comorbid diseases (%), together with heterogeneity analysis carried out using the Q test and the
among-studies variation (I2 index).
The incidence of comorbid chronic diseases in patients 1.0% to 4.0%) (Fig. 2, inserts C and D). The proportions
with COVID-19 of diabetes, hypertension, CAD/CVD and chronic
pulmonary disease varied by 11.5-, 8.0-, 17.0- and 8.0-
As shown in Fig. 2 (inserts A and B), diabetes was present fold, respectively, among the identified studies. This wide
in 10.0% (95% CI 8.0% to 12.0%) and CAD/CVD was among-studies variation in the proportion of comorbid
prevalent in 8.0% (95% CI 3.0% to 12.0%) of the patients. diseases may have resulted in the significant
Hypertension was present in 20.0% (95% CI 15.0% to heterogeneity (Cochran’s Q) observed for estimates of
26.0%) and chronic pulmonary disease in 3.0% (95% CI diabetes, hypertension, CAD/CVD and chronic
Aging and Disease • Volume 11, Number 3, April 2020 673Liu H., et al Comorbidities predict COVID-19 severity
pulmonary disease (p < 0.001), with an I2 index ranging admittance to ICU (OR 3.36, 95% CI 1.67 to 6.76), with
from 73.0% to 98.0% (Fig. 2). low heterogeneity (I2 =36.0%) (Supplementary Fig. 1,
inserts A and B). To our surprise, our analysis revealed
The effects of comorbid chronic diseases on the clinical that preexisting chronic diseases were not significantly
outcomes in patients with COVID-19 correlated with COVID-19 mortality (OR 2.09, 95% CI
0.26 to 16.67) (Supplementary Fig. 1, inserts C).
We screened out articles that included the numbers of Next, we found that both preexisting diabetes and
death, disease severity, or admittance to ICU, which hypertension are highly correlated with increased risk of
allowed us to pool their data into a further analysis. Next, disease severity (OR 2.61, 95% CI 1.93 to 3.52, I2 =26.7%;
we performed a meta-analysis in order to examine the and OR 2.84, 95% CI 2.22 to 3.63, I2 =36.8%,
association between preexisting chronic diseases and respectively); and that preexisting CAD/CVD and chronic
clinical outcomes (disease severity, admittance to ICU pulmonary disease are also correlated with disease
and mortality rate) in patients with COVID-19. We found severity (OR 4.18, 95% CI 2.87 to 6.09, I2 =31.6%; and
that preexisting chronic diseases were strongly correlated OR 3.83, 95% CI 2.15 to 6.80, I2 =0.0%, respectively)
with increased disease severity (OR 3.50, 95% CI 1.78 to (Fig. 3, inserts A-D).
6.90), with moderate heterogeneity (I2 =60.9%); increased
Figure 3. Correlation between comorbid chronic diseases and severe COVID-19 in SARS-CoV-2 infected patients. Forest
plot showing the effects of comorbid diabetes (A), hypertension (B), CAD/CVD (C), and chronic pulmonary disease (D) on the risk
of severe COVID-19 in SARS-CoV-2-infected patients. In this figures, the horizontal lines indicate the lower and upper limits of the
95% CI, and the size of the squares reflects the relative weight of each study in the meta-analysis. Weights were calculated from
fixed-effects model analyses. Heterogeneity analysis was carried out using Q test and among-studies variation (I2 index).
Publication bias DISCUSSION
Begg’s test (all Pr >0.05) and Egger’s regression test (all Recent studies had confirmed that SARS-CoV-2 infection
P>0.05) suggest no significant publication bias can bring human-to- human transmission and lead to a
(Supplementary Fig. 2, inserts A-H). serious of respiratory, enteric, hepatic, and neurologic
damage [32]. SARS-CoV-2 is one type of coronaviruses
Aging and Disease • Volume 11, Number 3, April 2020 674Liu H., et al Comorbidities predict COVID-19 severity
that belongs to the β‐coronavirus cluster. It causes the with asthma. However, another study [36] noted that,
third kind of zoonotic coronavirus disease after SARS and patients with chronic pulmonary disease were more likely
Middle East respiratory syndrome (MERS) [32]. Both to need for ICU treatment and ventilator support once they
MERS-CoV and SARS-CoV have much higher case infected pandemic influenza. Our meta-analysis also
fatality rates (40% and 10%, respectively). Though the found that chronic pulmonary disease was a risk factor for
current SARS-CoV-2 shares 79% of its genome with increased disease severity in SARS-CoV-2 infected
SARS-CoV, it appears to be much more transmissible patients. This suggests that the underlying lesions of the
[32-33]. lungs in chronic pulmonary disease patients make them
The COVID-19 caused a pandemic all over the world. more likely to develop into severe cases of influenza or
The sex ratio (male to female) was 1.62 observed in the COVID-19. Our finding is consistent with the conclusion
10948 cases examined in our study. It shows that male of a meta-analysis [37] published a few days ago which
was more susceptible to COVID-19. And both sexes included six literatures and found that chronic obstructive
exhibited clinical presentations similar in pulmonary disease (COPD) was associated with increased
symptomatology. These generally include fever, cough, disease severity in COVID-19 patients. The sample size
fatigue or myalgia, breathing difficulty, and diarrhea included in our present study was larger and the results
(Table 1). According to the results of meta‐analysis, the may be more convincing. Alaa Badawi et al. [38] reported
top four symptoms of patients with COVID-19 were that diabetes and hypertension were equally prevalent in
fever, cough, fatigue or myalgia, and shortness of breath approximately 50%, and CAD/CVD was present in 30%
or dyspnea. Diarrhea only occurred among a small of the severe MERS patients. We also found that the
number of patients (7.0%, 95% CI 5.0% to 9.0%). prevalence of diabetes in two studies [24, 29] (cases were
However, a recent study reported that diarrhoea was from America) was much higher than other 22 studies [3-
observed in 21% patients with COVID-19, and patients 6, 8, 12-23, 25-28, 30] (cases were from China, Italy, and
with diarrhoea were older and more likely to have France) included in our final meta-analysis. However,
comorbid chronic diseases than patients without diarrhoea these could be a reflection of the prevalence of chronic
[34]. It showed that diarrhoea may be a risk factor for diseases in different regions and races.
disease severity. Meta-analysis also suggests that people In our analysis, we also found that preexisting chronic
aged more than 50 years occurred 59.0 % (95% CI 49.0% diseases were strongly correlated with the increased
to 68.0 %) during patients with COVID-19 (Table 1). disease severity and increased admittance to ICU. To our
Another meta-analysis showed that elderly people had the surprise, our analysis revealed that preexisting chronic
highest risk of death during both seasonal and pandemic diseases were not significantly correlated with COVID-19
influenza seasons; in contrast, children and young people mortality. The possible reason may be the limited
aged less than 18 years had a significantly reduced risk of literatures. Though there were 24 articles included in our
death compared with non-elderly adults during pandemics final analysis, only 3 reported the death numbers in
[35]. COVID-19 patients based on whether there were
Meta-analysis of the data extracted from the included comorbid chronic diseases. Among the three studies, two
studies (Fig. 2) suggested that diabetes and CAD/CVD studies revealed that compared to COVID-19 patients
were prevalent in 10.0% and 8.0% of the patients, with no preexisting chronic diseases, COVID-19 patients
respectively. The proportion of hypertension (20.0%) was who present with chronic diseases have a higher rate for
much higher than that of chronic pulmonary disease mortality; another one study revealed that there was no
(3.0%) in COVID-19 patients. In April 2016, a study significant difference in mortality between the two
showed that about one-third (32.5%) of Chinese adults groups. Next, we need more high-quality literatures to
had hypertension [35]. The incidence of diabetes, confirm the conclusion. The significance of this result is
coronary artery disease, and chronic pulmonary disease in that SARS-CoV-2 infected patients who have preexisting
China was 10.4%, 1.02%, and 8.0% according to the latest chronic diseases should be hospitalized earlier and get
epidemiological data. In conclusion, because more medical intervention such as ICU admission and
hypertension has a much higher prevalence in the mechanical ventilation therapy.
population, the incidence of hypertension in patients with Another study [35] noted that severe pandemic
COVID-19 was also significantly higher than other influenza occurred significantly more often in those who
comorbid chronic diseases. However, the possible another were obese (OR 2.74, 95% CI 1.56 to 4.80) and in those
reason for the low incidence of chronic pulmonary disease who had cardiovascular disease (OR 2.92, 95% CI 1.76 to
in COVID-19 patients is that patients with chronic 4.86), hypertension (OR 1.49, 95% CI 1.10 to 2.01) and
pulmonary disease may pay more attention to themselves neuromuscular disease (OR 2.68, 95% CI 1.91 to 3.75).
or that virus deposition in the lung could be inhibited by The comorbid chronic diseases influencing the COVID-
the long-term use of inhaled hormones during patients 19 outcomes may have similar effects in severe MERS
Aging and Disease • Volume 11, Number 3, April 2020 675Liu H., et al Comorbidities predict COVID-19 severity
and other respiratory illnesses such as influenza H1N1 to the observed significant heterogeneity. Additional
[39-40]. Common chronic conditions during older people sources of heterogeneity may relate to the large variation
such as diabetes, hypertension, and CAD/CVD, together among studies in the sample size (24 to 5700 patients).
with their predisposing conditions, may be linked Second, most of the studies were from China. These
etiologically to the pathogenesis of COVID-19. Chronic factors may cause some limitations on the estimated
diseases share several common features with infectious contribution of comorbid chronic diseases to COVID-19
disorders and their complications, such as endothelial cases. Further investigations are needed to examine the
dysfunction, the pro-inflammatory state, and alterations in nature and extent of coexistence between COVID-19 and
the innate immune response [41-43]. For example, non-communicable diseases.
diabetes and hyperglycemia increase systemic oxidative Despite these limitations, our study also has notable
stress and vascular inflammation. Excessive vascular strengths. First, this analysis was obtained by pooling data
oxidative stress and vascular inflammation are central from a number of clinical studies which significantly
characteristics of phonotypical endothelial dysfunction. increased the statistical power of the analysis compared to
Chronic diseases associated vascular endothelial a single study. Second, the included studies originated
dysfunction relates to local vascular inflammation as well from different countries and included different ethnic
as to systemic inflammation. Research also delineate backgrounds, allowing for the generalization of our
novel roles for elements of both innate and adaptive results. In conclusion, patients with preexisting chronic
immune responses in regulating endothelial function diseases may have a higher risk for developing severe
under hypertensive conditions. Activation of innate COVID-19 and should be given close attention.
immunity’s complement pathway may negatively impact
vascular endothelial function in hypertension [44], Acknowledgments
whereas increased anti-inflammatory interleukin-10
expression from the adaptive immune response blunts the This study was supported by the National Natural Science
adverse effects on endothelial function of angiotensin II– Foundation of China (Grant 81670815), Guangdong
associated hypertension [45]. Basic and Applied Basic Research Foundation (Grant
Diabetes mellitus is closely related to the occurrence 2020A1515010124) and Special fund for innovation
of severe viral pneumonia and death. For example, in strategy of science and technology plan of Guangdong
2003, the mortality of SARS-infected patients who had province (2019A030317011). We acknowledge all
diabetes mellitus was 3.0-3.3 times higher than that of health-care workers involved in the diagnosis and
patients without diabetes mellitus [46, 47]. In 2009, the treatment of COVID-19 patients.
number of being admitted to ICU in H1N1-infected
patients who had diabetes was 4.29 times higher than that Conflict of Interest
of patients without diabetes [48]. Diabetes is also a high
risk factor for developing severe MERS in 2014 [48]. Due The authors declare no conflict of interest.
to abnormal immune functions such as decreased CD3 + T
cells, imbalance of CD4+/CD8+ T cells and decreased Supplementary Materials
natural killer T cell activity, the immune response ability
of the body is decreased [49]. Therefore, preexisting The Supplemenantry data can be found online at:
diabetes is a predictive factor for virus infection. On the www.aginganddisease.org/EN/10.14336/AD.2020.0502.
other hand, angiotensin converting enzyme 2 (ACE2), the
functional receptor of SARS-CoV, is also expressed in the References
islets of the pancreas, so the virus may destroy the islets
and aggravate diabetes during infection [50]. SARS-CoV- [1] The L (2020). Emerging understandings of 2019-nCoV.
2 virus can also bind to ACE2 on cells [51]. Virus Lancet, 395:311.
infection may interact with diabetes, causing SARS-CoV- [2] Lu H, Stratton CW, Tang YW (2020). Outbreak of
2 infected patients who had diabetes to be more pneumonia of unknown etiology in Wuhan, China: The
mystery and the miracle. J Med Virol, 92:401-402.
susceptible to developing severe cases and death. [3] Guan W-J, Ni Z-Y, Hu Y, Liang W-H, Ou C-Q, He J-X,
et al. (2020). Clinical Characteristics of Coronavirus
Strengths and Limitations of Study Disease 2019 in China. New Engl J Med, in press.
[4] Chen N, Zhou M, Dong X, Qu J, Gong F, Han Y, et al.
The present study has several limitations. First, the (2020). Epidemiological and clinical characteristics of
included studies showed a wide variance among studies in 99 cases of 2019 novel coronavirus pneumonia in Wuhan,
the proportion of diabetes, hypertension, CAD/CVD, and China: a descriptive study. Lancet, 395:507-513.
chronic pulmonary disease, which may have contributed [5] Wang D, Hu B, Hu C, Zhu F, Liu X, Zhang J, et al. (2020).
Aging and Disease • Volume 11, Number 3, April 2020 676Liu H., et al Comorbidities predict COVID-19 severity
Clinical Characteristics of 138 Hospitalized Patients infected with the 2019 novel coronavirus (SARS-Cov-2)
With 2019 Novel Coronavirus-Infected Pneumonia in outside of Wuhan, China: retrospective case series. BMJ,
Wuhan, China. JAMA, in press. 368:m606.
[6] Yang X, Yu Y, Xu J, Shu H, Xia Ja, Liu H, et al. (2020). [20] Song F, Shi N, Shan F, Zhang Z, Shen J, Lu H, et al.
Clinical course and outcomes of critically ill patients (2020). Emerging 2019 Novel Coronavirus (2019-nCoV)
with SARS-CoV-2 pneumonia in Wuhan, China: a Pneumonia. Radiol, 295:210-217.
single-centered, retrospective, observational study. [21] Xu X, Yu C, Qu J, Zhang L, Jiang S, Huang D, et al.
Lancet Resp Med, in press. (2020). Imaging and clinical features of patients with
[7] Tian S, Hu N, Lou J, Chen K, Kang X, Xiang Z, et al. 2019 novel coronavirus SARS-CoV-2. Eur J Nucl Med
(2020). Characteristics of COVID-19 infection in Mol Imaging. in press.
Beijing. J Infection, in press. [22] Shi H, Han X, Jiang N, Cao Y, Alwalid O, Gu J, et al.
[8] Liu K, Fang Y-Y, Deng Y, Liu W, Wang M-F, Ma J-P, et (2020). Radiological findings from 81 patients with
al. (2020). Clinical characteristics of novel coronavirus COVID-19 pneumonia in Wuhan, China: a descriptive
cases in tertiary hospitals in Hubei Province. Chin Med study. Lancet Infec Dis, in press.
J, in press. [23] Shi S, Qin M, Shen B, Cai Y, Liu T, Yang F, et al. (2020).
[9] Ren LL, Wang YM, Wu ZQ, Xiang ZC, Guo L, Xu T, et Association of Cardiac Injury With Mortality in
al. (2020). Identification of a novel coronavirus causing Hospitalized Patients With COVID-19 in Wuhan, China.
severe pneumonia in human: a descriptive study. Chin JAMA Cardiol, in press.
Med J (Engl), in press. [24] Bhatraju PK, Ghassemieh BJ, Nichols M, Kim R, Jerome
[10] Chen H, Guo J, Wang C, Luo F, Yu X, Zhang W, et al. KR, Nalla AK, et al. (2020). Covid-19 in Critically Ill
(2020). Clinical characteristics and intrauterine vertical Patients in the Seattle Region - Case Series. New Engl J
transmission potential of COVID-19 infection in nine Med, in press.
pregnant women: a retrospective review of medical [25] Feng Y, Ling Y, Bai T, Xie YS, Huang J, Li J, et al. (2020).
records. Lancet, in press. COVID-19 with different severity: A multi-center study
[11] Liu Y, Yang Y, Zhang C, Huang F, Wang F, Yuan J, et al. of clinical features. American Thoracic Society, in press.
(2020). Clinical and biochemical indexes from 2019- [26] Du RH, Liang LR, Yang CQ, Wang W, Cao TZ, Li M, et
nCoV infected patients linked to viral loads and lung al. (2020). Predictors of mortality for patients with
injury. Sci China Life Sci, in press. COVID-19 pneumonia caused by SARS-CoV-2: a
[12] Li K, Wu J, Wu F, Guo D, Chen L, Fang Z, et al. (2020). prospective cohort study. Eur Respir J, in press.
The Clinical and Chest CT Features Associated with [27] Liu W, Tao ZW, Wang L, Yuan ML, Liu K, Zhou L, et al.
Severe and Critical COVID-19 Pneumonia. Invest (2020). Analysis of factors associated with disease
Radiol, in press. outcomes in hospitalized patients with 2019 novel
[13] Yang W, Cao Q, Qin L, Wang X, Cheng Z, Pan A, et al. coronavirus disease. Chinese Med J, in press.
(2020). Clinical characteristics and imaging [28] Grasselli Giacomo, Zangrillo Alberto, Zanella Alberto,
manifestations of the 2019 novel coronavirus disease Antonelli Massimo, Cabrini Luca, Castelli Antonio, et al.
(COVID-19): A multi-center study in Wenzhou city, (2020). Baseline Characteristics and Outcomes of 1591
Zhejiang, China. J Infection, in press. Patients Infected With SARS-CoV-2 Admitted to ICUs
[14] Hu Z, Song C, Xu C, Jin G, Chen Y, Xu X, et al. (2020). of the Lombardy Region, Italy. JAMA, in press.
Clinical characteristics of 24 asymptomatic infections [29] Richardson Safiya, Hisch Jamie, Narasimhan Mangala,
with COVID-19 screened among close contacts in Crawford James, McGinn Thomas, Davidson Karina, et
Nanjing, China. Sci China Life Sci, in press. al. (2020). Presenting Characteristics, Comorbidities,
[15] Zhang J-J, Dong X, Cao Y-Y, Yuan Y-D, Yang Y-B, Yan and Outcomes Among 5700 Patients Hospitalized With
Y-Q, et al. (2020). Clinical characteristics of 140 patients COVID-19 in the New York City Area. JAMA, in press.
infected with SARS-CoV-2 in Wuhan, China. Allergy, in [30] Simonnet Arthur, Chetboun Mikael, Poissy Julien,
press. Raverdy Violeta, Noulette Jerome, Duhamel Alain, et al.
[16] Wu J, Liu J, Zhao X, Liu C, Wang W, Wang D, et al. (2020). High prevalence of obesity in severe acute
(2020). Clinical Characteristics of Imported Cases of respiratory syndrome coronavirus-2 (SARS-CoV2)
COVID-19 in Jiangsu Province: A Multicenter requiring invasive mechanical ventilation. Obesity
Descriptive Study. Clin Infec Dis, in press. (Silver Spring), in press.
[17] Huang Y, Tu M, Wang S, Chen S, Zhou W, Chen D, et al. [31] Melsen WG, Bootsma MCJ, Rovers MM, Bonten MJM
(2020). Clinical characteristics of laboratory confirmed (2014). The effects of clinical and statistical
positive cases of SARS-CoV-2 infection in Wuhan, heterogeneity on the predictive values of results from
China: A retrospective single center analysis. Travel Med meta-analyses. Clin Microbiolo Infec, 20:123-129.
Infect Dis, 27:101606. [32] Jiang F, Deng L, Zhang L, Cai Y, Cheung CW, Xia Z
[18] Huang C, Wang Y, Li X, Ren L, Zhao J, Hu Y, et al. (2020). Review of the Clinical Characteristics of
(2020). Clinical features of patients infected with 2019 Coronavirus Disease 2019 (COVID-19). J Gen Intern
novel coronavirus in Wuhan, China. Lancet (London, Med, in press.
England), 395:497-506. [33] de Wit E, van Doremalen N, Falzarano D, Munster VJ
[19] Xu XW, Wu XX, Jiang XG, Xu KJ, Ying LJ, Ma CL, et (2016). SARS and MERS: recent insights into emerging
al. (2020). Clinical findings in a group of patients coronaviruses. Nat Rev Microbiol, 14:523-534.
Aging and Disease • Volume 11, Number 3, April 2020 677Liu H., et al Comorbidities predict COVID-19 severity
[34] Wan Y, Li J, Shen L, Zou Y, Hou L, Zhu L, et al. (2020). [42] Limonta D, Torres G, Capó V, Guzmán MG (2008).
Enteric involvement in hospitalised patients with Apoptosis, vascular leakage and increased risk of severe
COVID-19 outside Wuhan. Lancet Gastroenterol dengue in a type 2 diabetes mellitus patient. Diab Vasc
Hepatol, in press. Dis Res, 5:213-214.
[35] Mertz D, Kim TH, Johnstone J, Lam P-P, Science M, [43] Dharmashankar K, Widlansky ME (2010). Vascular
Kuster SP, et al. (2013). Populations at risk for severe or endothelial function and hypertension: insights and
complicated influenza illness: systematic review and directions. Curr Hypertens Rep, 12:448-455.
meta-analysis. BMJ, 347: f5061. [44] Magen E, Feldman A, Cohen Z, Alon DB, Linov L,
[36] Lewington S, Lacey B, Clarke R, Guo Y, Kong XL, Yang Mishal J, et al. (2010). Potential link between C3a, C3b
L, et al. (2016). The burden of hypertension and and endothelial progenitor cells in resistant hypertension.
association risk for cardiovascular mortality in China. Ame J Med Sci, 339:415-419.
JAMA Intern Med. 176:524-532. [45] Didion SP, Kinzenbaw DA, Schrader LI, Chu Y, Faraci
[37] Wang B, Li RB, Lu Z, Huang Y (2020). Does FM (2009). Endogenous interleukin-10 inhibits
comorbidity increase the risk of patients with COVID- angiotensin II-induced vascular dysfunction.
19: evidence from meta-analysis. Aging, in press. Hypertension, 54:619-624.
[38] Badawi A, Ryoo SG (2016). Prevalence of comorbidities [46] Booth CM, Matukas LM, Tomlinson GA, Rachlis AR,
in the Middle East respiratory syndrome coronavirus Rose DB, Dwosh HA, et al. (2003). Clinical features and
(MERS-CoV): a systematic review and meta-analysis. short-term outcomes of 144 patients with SARS in the
Int J Infect Dis, 49:129-133. greater Toronto area. JAMA, 289:2801-2809.
[39] Suryaprasad A, Redd JT, Hancock K, Branch A, [47] Yang JK, Feng Y, Yuan MY, Yuan SY, Fu HJ, Wu BY, et
Steward-Clark E, Katz JM, et al. (2013). Severe acute al. (2006). Plasma glucose levels and diabetes are
respiratory infections caused by 2009 pandemic independent predictors for mortality and morbidity in
influenza A (H1N1) among American Indians-- patients with SARS. Diabet Med, 23:623-628.
southwestern United States, May 1-July 21, 2009. [48] Allard R, Leclerc P, Tremblay C, Tannenbaum T-N
Influenza Other Respi Viruses, 7:1361-1369. (2010). Diabetes and the severity of pandemic influenza
[40] Kusznierz G, Uboldi A, Sosa G, Torales S, Colombo J, A (H1N1) infection. Diabetes Care, 33:1491-1493.
Moyano C, et al. (2013). Clinical features of the [49] van den Brand JM, Smits SL, Haagmans BL (2015).
hospitalized patients with 2009 pandemic influenza A Pathogenesis of Middle East respiratory syndrome
(H1N1) in Santa Fe, Argentina. Influenza Other Respi coronavirus. J Pathol, 235:175-184.
Viruses, 7:410-417. [50] Yang J-K, Lin S-S, Ji X-J, Guo L-M (2010). Binding of
[41] Htun NSN, Odermatt P, Eze IC, Boillat-Blanco N, SARS coronavirus to its receptor damages islets and
D'Acremont V, Probst-Hensch N (2015). Is diabetes a causes acute diabetes. Acta Diabetol, 47:193-199.
risk factor for a severe clinical presentation of dengue?-- [51] Wu F, Zhao S, Yu B, Chen Y-M, Wang W, Song Z-G, et
review and meta-analysis. PLoS Negl Trop Dis, al. (2020). A new coronavirus associated with human
9:e0003741. respiratory disease in China. Nature, 579:265-269.
Aging and Disease • Volume 11, Number 3, April 2020 678You can also read