Quantification of hand muscle volume and composition in patients with rheumatoid arthritis, psoriatic arthritis and psoriasis
←
→
Page content transcription
If your browser does not render page correctly, please read the page content below
Friedberger et al. BMC Musculoskeletal Disorders            (2020) 21:203
https://doi.org/10.1186/s12891-020-03194-5

 RESEARCH ARTICLE                                                                                                                                   Open Access

Quantification of hand muscle volume and
composition in patients with rheumatoid
arthritis, psoriatic arthritis and psoriasis
Andreas Friedberger1*, Camille Figueiredo2, Alexandra Grimm1, Isabelle d’Oliveira2, Tobias Bäuerle3, Jürgen Rech2,
Arnd Kleyer2, David Simon2, Michael Uder3, Georg Schett2 and Klaus Engelke2

  Abstract
  Background: Psoriasis (Pso), psoriatic arthritis (PsA) and rheumatoid arthritis (RA) are inflammatory diseases. PsA
  and RA are characterized by bone and muscle loss. In RA, bone loss has been extensively characterized, but muscle
  loss has, to the best of our knowledge, not been quantified to date.
  Methods: A random forest based segmentation method was used to analyze hand muscle volume in T1 weighted
  MRI images of 330 patients suffering from Pso, PsA or RA. In addition, fat volume was quantified using MRI Dixon
  sequences in a small subset (n = 32).
  Results: Males had a higher relative muscle volume than females (14% for Pso, 11% for PsA, n.s. for RA). Between
  40 and 80 years male Pso patients lost 13%, male PsA patients 16%, male RA patients 23% and female PsA patients
  30% of their relative muscle volume. After adjustment for age, relative muscle volume in males RA patients was
  16% and in female RA patients 9% lower than in Pso patients. In male RA patients relative muscle volume was 13%
  lower in than in male PsA patients. There was no difference in females. A significant negative correlation (R2 = 0.18)
  between relative intramuscular fat content relative hand muscle volume was observed.
  Conclusion: These preliminary data showed that relative hand muscle volume significantly decreased with age in
  male and female patients with Pso, PsA and RA patients. Independent of age, relative hand muscle volume was
  significantly smaller in patients with RA compared to the patients with Pso and the difference was twice as large in
  males compared to females. Also in male but not in female RA patients relative hand muscle volume was significantly
  smaller than in PsA patients.
  Keywords: Psoriasis, Psoriatic arthritis, Rheumatoid arthritis, Magnetic resonance imaging, Random forest based
  segmentation, Hand muscle, Fat

* Correspondence: andreas.friedberger@imp.uni-erlangen.de
1
 Institute of Medical Physics, University of Erlangen-Nuremberg, Henkestraße
91, 91052 Erlangen, Germany
Full list of author information is available at the end of the article

                                        © The Author(s). 2020 Open Access This article is licensed under a Creative Commons Attribution 4.0 International License,
                                        which permits use, sharing, adaptation, distribution and reproduction in any medium or format, as long as you give
                                        appropriate credit to the original author(s) and the source, provide a link to the Creative Commons licence, and indicate if
                                        changes were made. The images or other third party material in this article are included in the article's Creative Commons
                                        licence, unless indicated otherwise in a credit line to the material. If material is not included in the article's Creative Commons
                                        licence and your intended use is not permitted by statutory regulation or exceeds the permitted use, you will need to obtain
                                        permission directly from the copyright holder. To view a copy of this licence, visit http://creativecommons.org/licenses/by/4.0/.
                                        The Creative Commons Public Domain Dedication waiver (http://creativecommons.org/publicdomain/zero/1.0/) applies to the
                                        data made available in this article, unless otherwise stated in a credit line to the data.
Friedberger et al. BMC Musculoskeletal Disorders   (2020) 21:203                                                   Page 2 of 11

Background                                                         disease there were no additional inclusion or exclusion
Rheumatoid arthritis (RA) is a chronic inflammatory dis-           criteria. BMI data was available from 206 patients. This
ease, which is associated with bone and cartilage loss [1].        subset will be denoted as SBMI.
About two thirds of RA patients also suffer from rheuma-
toid cachexia (RC) [1], an accelerated involuntary loss of
fat-free skeletal muscle mass, which is larger than the de-        MR imaging
crease related to ‘normal’ aging (sarcopenia). The term RC         Routine MRI Scans were performed with a 1.5-Tesla
has already been coined in 1992 [2], but etiology and              MRI system (MAGNETOM Aera, Siemens Healthcare
pathophysiology of RC are still not well understood. RC is         GmbH, Erlangen, Germany). Subjects were positioned in
underdiagnosed and undertreated [3–5].                             prone position with head first. For signal reception, a
   Structural bone damage of RA has been assessed using            hand/wrist radiofrequency 16-channel coil was used.
radiographs, magnetic resonance imaging (MRI) and                  The standard clinical MR protocol included several se-
more recently high resolution peripheral quantitative              quences from which a fat suppressed T1w TSE was se-
computed tomography (HR-pQCT). In contrast, tech-                  lected for analysis. More recently, a T2w Dixon TSE
niques to quantify muscle properties are still under de-           sequence has been added to the clinical protocol. The
velopment. For the diagnosis of RC, advanced muscle                specifications of the two sequences used for this study
and fat imaging is required. 85% of RA subjects have               are summarized in Table 1.
normal BMI [6] because the muscle loss is often com-
pensated by fatty infiltration, resulting in normal body
weight. Thus, the sole use of BMI for the diagnosis of             Image processing
RC is misleading.                                                  The image processing consisted of pre-processing of the
   It has been suggested [7, 8] that the increased fatty infil-    T1 scans, segmentation using the T1 scans and trans-
tration may be one factor to explain the discrepancy of            formation of the segmentation results to the Dixon fat
age related decreases between muscle mass and volume in            fraction scans.
healthy subjects [9]. In addition, adipose tissue is a source         The T1 weighted MR scans were pre-processed with
of pro-inflammatory cytokines, which triggers inflamma-            the N4ITK algorithm [16, 17] to remove artificial inten-
tory responses [10, 11], an important observation with po-         sity modulations caused by inhomogeneous magnetic
tentially high clinical relevance not only in RA but also in       fields (Fig. 1). The segmentation of the hand and of hand
psoriatic arthritis (PsA) and psoriasis (Pso). Similar to RA,      muscles was performed in these homogenized images.
PsA is also characterized by inflammation of the synovial          This step required knowledge of the hand cross sectional
tissue, which ultimately results in bone, cartilage and            area (CSA), which was obtained as a series of 2D con-
muscle damage. However, the production and secretion of            tours determined for each slice by thresholding and
pro-inflammatory cytokines is lower than in RA [12, 13],           other basic image processing steps.
which may explain why PsA is usually less destructive. Pso            The core of the muscle segmentation was a random
mainly affects the skin, but subclinical joint inflammation        forest classifier. Random forest is a well-known ensem-
has also been reported [14, 15]. Nevertheless, to the best         ble learning method from machine learning [18], which
of our knowledge, no major impact of Pso on muscle has             is widely used for image segmentation [19]. The random
been reported so far.                                              forest classifies each voxel into muscle or background
   This study specifically addresses the assessment of             based on image features in the voxel neighborhood. The
hand muscle volume and composition in patients with                combination of all voxels classified as muscle constitutes
rheumatoid, psoriatic arthritis and psoriasis using stand-         the muscle volume of interest (VOI). The classifier has
ard clinical and Dixon MRI sequences. The primary                  to be trained beforehand using manually segmented
study aim was to compare hand muscle volume among                  hand scans. The final segmentation step was a Gaussian
the three diseases, independent of age and BMI. Add-               fit of the histogram of the muscle VOI. Voxels outside
itionally, preliminary results of a hand fat volume assess-        the range of the mean ± 2 standard deviations were re-
ment were included. For the purpose of this study,                 moved. This removed erroneously included hypointense
psoriasis patients were used as controls.                          ligaments and tendons or hyperintense vessels. The re-
                                                                   sults were manually edited by the operator, if necessary.
Methods                                                            The top panel in Fig. 2 shows a typical segmentation
Patient details                                                    result.
In this study we used existing MRI scans of the domin-                For the quantification of muscle fat content, a 2 pt-
ant hand of 330 ambulatory care patients diagnosed with            Dixon technique was used [20]. This sequence produces
RA, PsA or Pso, from the Department of Medicine 3 of               a water Iwater and a fat image Ifat, from which a quantita-
the University of Erlangen-Nuremberg. Apart from the               tive fat fraction image Iff can be calculated: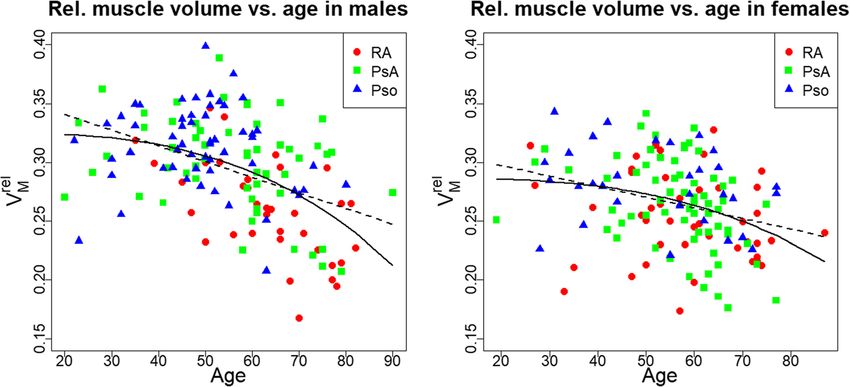
Friedberger et al. BMC Musculoskeletal Disorders     (2020) 21:203                                                                     Page 3 of 11

Table 1 Specifications of the T1 and the Dixon sequences as used in this study. TSE stands for turbo spin echo, TR for the repetition
time, TE for the echo time and TD for the time difference between spin and gradient echo formation
Sequence                 In-plane matrix                                Slices                                   TR             TE             TD
                                                            2                                                    (ms)           (ms)           (ms)
                         Voxel count         Resolution(mm )            Count             Thickness(mm)
T1w TSE                  320 × 320           0.5 × 0.5                  64                3.0                    760            13             0
T2w Dixon TSE            320 × 320           0.5 × 0.5                  30                3.0                    3040           78             0

                   I fat                                                     accumulated volumes of all voxels participating in the
    I ff ¼                   1000:                                          hand resp. muscle segmentation. From these two param-
             I water þ I fat
                                                                             eters the relative muscle volume (VMrel = VM / VH) was
  Iff assigns a percentage of fat (Fig. 2 bottom) to each                    calculated. Output parameters from Iff were absolute fat
voxel. In Iff, grey values range from 0 (meaning the voxel                   volume (VF) and relative fat content (Vfrel = VF / VM)
consists of 0% fat) to 1000 (meaning the voxel consists                      within the muscle VOI. VF was the accumulated volume
of 100% fat), i.e. 1 grey value equals 0.1% fat. In order to                 of all voxels participating in the hand muscle segmenta-
restrict the fat analysis to muscle, the muscle VOI deter-                   tion times their individual fat fraction values Iff.
mined in the T1 dataset was transferred to Iff. For this                       The segmentation reliability was obtained as reanalysis
purpose, the hand surface was registered from the T1                         precision errors. Three operators analyzed 14 randomly
dataset to Iff via rigid multimodal image registration.                      chosen data sets once (inter-operator) and one operator
The resulting transformation was then applied to the                         analyzed these 14 data sets three times (intra-operator).
muscle VOI (Fig. 2 bottom).                                                  Reanalysis precision errors were calculated as root mean
                                                                             square average of standard deviation and coefficient of
Output parameters                                                            variation of individual data sets [21].
Direct output parameters calculated from the T1 images
were hand (VH) and muscle volume (VM), derived be-                           Statistics
tween user defined proximal and distal ends of the meta-                     In order to evaluate the dependence of hand and relative
carpal bone III (MCP; Fig. 3). These were the                                muscle volume on age and BMI, a linear regression with

 Fig. 1 Top: Axial slice of a T1 weighted fat suppressed MRI hand scan in the metacarpal region. Notice the inhomogeneous intensity distribution
 of the grey values caused by a bias field, especially in the thenar region (lower left). Bottom: Same slice but with removed bias field by non-
 uniform intensity normalization (N4ITK)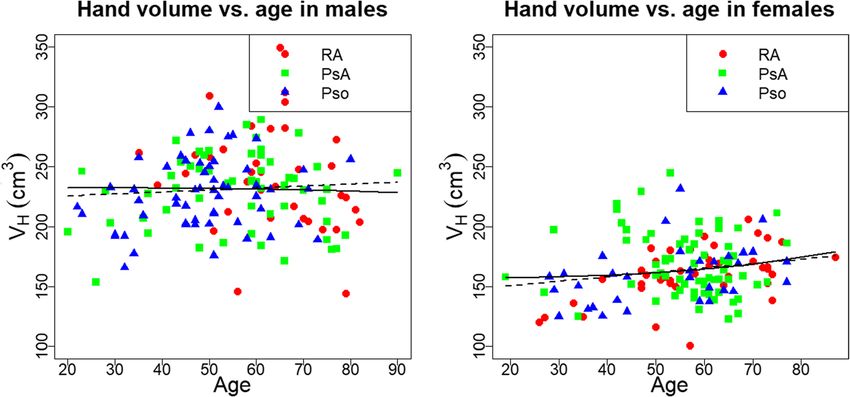
Friedberger et al. BMC Musculoskeletal Disorders     (2020) 21:203                                                                    Page 4 of 11

 Fig. 2 Top: Axial slice with segmented cross sectional area (yellow) and muscle (purple). Bottom: The green CSA and the red muscle
 segmentation were imported from the processed T1 image via multimodal image registration

age and BMI as independent variables was used. For the                    Results
assessment of differences of VH and VMrel among the                       Patient age is summarized in Table 2. Dixon imaging
three groups corresponding to patients with RA, PsA or                    based fat fraction measurements were available from 32
Pso, the factor disease was added as independent cat-                     patients, since just recently added to the clinical proto-
egorical variable to the particular linear model. Group                   col. This subset will be denoted as Sdixon. Inter- and
differences, denoted as Δ, were the average difference                    intra-reanalysis precision was excellent (Table 3).
over the specified age intervals. Since some studies
showed an association between hand grip strength and                      Assessment of hand volume
age3 [22], age was substituted by age3 in a separate linear               Males had a higher hand volume (37% for Pso, 34% for
regression model, under the assumption that hand                          PsA, 48% for RA) than females. The dependence of VH
muscle volume is correlated to hand grip strength.                        on age is displayed in Fig. 4. In males, VH was correlated
   For a more age-sensitive group difference assessment,                  positively with age in the Pso (p = 0.02) and negatively in
the relative muscle volume was partitioned into 10 year                   the RA group (p = 0.05). In females, a positive correl-
intervals from the 5th to the 8th decade. For each dec-                   ation between VH and age was found for Pso (p = 0.01)
ade, group differences were tested using 1-way Anova                      and RA (p < 0.001) patients. For PsA patients there was
and post-hoc Tuskey HSD. Further, linear regressions                      no significant correlation between VH and age, neither
with independent variables age, BMI and hand and rela-                    for men nor for women. Between 20 and 80 years, hand
tive muscle volume were performed for VF and VFrel.                       volume of males decreased by 17% in RA patients, in-
Since the number of patients, for which fat data were                     creased by 9% in Pso patients and did not change in PsA
available, was small (n = 32), the fat analysis was not                   patients. In females hand volume increased by 24% in
stratified for sex or disease.                                            RA and Pso patients and did not change in PsA patients.
   p values below 0.05 were considered significant. All                   After adjustment for age alone or for age and BMI, most
statistics were performed with the statistics software R                  group differences in VH were not significant. These re-
(version 3.2.5, [23]).                                                    sults are listed in Table 4, with Δ as the VH difference
                                                                          between the two groups, on average in age between 20
Friedberger et al. BMC Musculoskeletal Disorders (2020) 21:203 Page 5 of 11
Fig. 3 Coronal slice of a hand MR with segmented CSA (yellow). MCP II to MCP IV are clearly visible. Proximal and distal boundaries of MCP III are
marked in red, the analysis is limited to the region in between
and 80. Adjustment for age3 instead of age did not sig- differences between independent variables age or age3
nificantly change the results. were not observed when comparing the age dependence
of VMrel among groups. Therefore group differences in
Assessment of relative muscle volume VMrel will only be reported using models linear in age.
Males had a higher relative muscle volume than females Between 20 and 80 years, negative correlations of rela-
(14% for Pso, 11% for PsA, n.s. for RA). The dependence tive hand muscle volume with age were observed for
of VMrel on age is shown in Fig. 5. The models using male PsA (p = 0.01) and RA patients (p < 0.001) and for
age3 instead of age better described the age-dependence female PsA patients (p < 0.001). Correlations for the
of VMrel. When combining data of all three groups, in other groups were not significant. Male PsA patients lost
males the model using age3 explained 24% of the vari- 16%, male RA patients 27% and female PsA patients 30%
ance of VMrel, compared to 19% for the model linear in of their relative muscle volume. When restricting the
age. In females the model using age3 explained 11% and analysis to the range between 40 and 80 years, a negative
the linear one 9% of the variance of VMrel. However, correlation of relative hand volume with age was also
observed for male Pso patients (p = 0.01). Between 40
and 80 years male Pso patients lost 13%, male PsA pa-
Table 2 Age, sex and diagnosis distribution of the cohort tients 16%, male RA patients 23% and female PsA pa-
Pso (n = 101) PsA (n = 137) RA (n = 92) tients 30% of their relative muscle volume.
male female male female male female Group differences after adjustment for age alone or for
n 63 38 61 76 41 51
age and BMI are shown in Table 5. The Δ stands for the
VMrel difference between the two groups, on average in
Age (y) 48 ± 12 54 ± 15 56 ± 14 56 ± 11 62 ± 12 60 ± 14
the denoted age intervals. Between 20 and 80 years,Friedberger et al. BMC Musculoskeletal Disorders (2020) 21:203 Page 6 of 11
Table 3 Reanalysis precision of hand and muscle volume (measured in the T1 image) and of muscle fat content and ratio
(measured in the Dixon images) Precision are shown as root mean square average of the standard deviation displayed in the unit of
the variable and of the coefficient of variation displayed in %
Hand volume Muscle volume Fat content Fat fraction
Interoperator 5.0 mm3 0.19% 1.5 mm3 0.24% 364.4 mm3 0.60% 0.09% 0.07%
3 3 3
Intraoperator 3.4 mm 0.13% 0.35 mm 0.05% 41.6 mm 0.10% 0.006% 0.04%
relative muscle volume in males RA patients was 16% Assessment of muscle fat
lower and in females 9% lower than in Pso patients. In Absolute intramuscular fat volume (VF) was positively
males but not in females there was also a significant dif- correlated with hand volume VH (R2 = 0.74, p < 0.0001).
ference between RA and PsA patients, relative muscle Age, disease and BMI did not significantly impact the
volume was 13% lower in RA patients. correlation.
BMI alone did not show significant correlations with Relative intramuscular fat content (VFrel) showed no
VMrel in either sex. However, after additional adjustment significant correlation with hand volume but a signifi-
for BMI, in females the difference VMrel between RA and cant negative correlation with VMrel (R2 = 0.18, p = 0.004)
Pso patients was no longer significant, while in males (Fig. 8).
the difference between PsA and Pso patients became sig-
nificant (p = 0.05).
Results were similar in the age group 40–80 years Discussion
but in males there was no significant difference, be- In this study we compared hand muscle volume in pa-
tween PsA and Pso patients even after adjustment for tients with Pso, PsA and RA. For the purpose of this
BMI, while the difference became significant in study subjects with Pso were regarded as control group
females. as Pso patients show only little to no inflammation in
Results of VMrel by age decade are shown in Fig. 6 the hand joints.
for males and Fig. 7 for females. For males, there was We applied a combination of T1-weighted and 2 pt-
a consistent pattern of numerically lower relative Dixon imaging sequences and a random forest based
hand muscle volume in RA patients for all decades. segmentation method to analyze muscle volume. Hand
Significant differences of VMrel among groups in muscle fat infiltration could only be obtained in a small
males were observed for the 5th decade (RA-Pso, p = subset so far. The excellent precision of MR 2 pt-Dixon
0.04, mean difference = − 0.046), 6th decade (RA-Pso, for fat quantification had been demonstrated earlier [24].
p = 0.04, mean difference = − 0.039) and 7th decade In the same study a high correlation of fat content be-
(RA-PsA, p = 0.04, mean difference = − 0.03) but not tween 2 pt-Dixon measurements of phantoms and MR
for the 8th decade. In females, group differences were spectroscopy, the standard method for fat quantification
not significant for any decade. was reported.
Fig. 4 Age dependency of hand volume for males (left) and females (right). Additionally displayed are the regression line of the model linear
(solid black line) and cubic in age (dashed black line) for the union of the three groupsFriedberger et al. BMC Musculoskeletal Disorders (2020) 21:203 Page 7 of 11
Table 4 Differences in hand volume between RA, Pso and PsA inverse relation between relative fat and relative
patients after adjustment for age (left column) and age and BMI muscle volume support this hypothesis.
(right column) as independent covariates A detailed investigation of age related changes per
VH / males age age & BMI disease group and age decade showed that in the
(SBMI)
male control group decreases in relative muscle vol-
RA – Pso p = 0.08 n.s. ume started in the sixth decade, indicating progressive
Δ = + 14
sarcopenia. There were no significant difference be-
PsA – Pso n.s. n.s. tween the control group and PsA patients for either
RA – PsA n.s. p = 0.003 Δ = + 25 decade. In males with RA, VMrel was lower than for
VH / females the two other groups for all age decades and the de-
RA – Pso n.s. n.s. cline of VMrel was larger, in particular in the 8th dec-
PsA – Pso n.s. p = 0.05 Δ = − 0.13
ade. This decrease in VMrel is further amplified by the
age related decrease in hand volume showing the
RA – PsA p = 0.07 Δ = − 8.5 n.s.
strong association between muscle deterioration and
Δ denotes the VH difference (measured in cm3) between two groups, averaged
over age. Data after age and BMI adjustment were only obtained in
RA in male subjects. Differences in relative muscle
subgroup SBMI volume among Pso, PsA and RA female patients were
numerically smaller and not significant for most age
decades.
The results shown in Figs. 6 and 7 were confirmed
The central findings of this study showed that the age after age adjustment in the pooled age groups (Table 5).
related decrease of relative hand muscle volume in males In males and females, differences in VMrel were signifi-
was larger than in females (Table 5 and Figs. 6 and 7) cant between RA and Pso patients but age adjusted dif-
and that in males but not in females relative muscle vol- ferences were about twice as high in males. It is
ume was lower in RA than in PsA or Pso patients, inde- speculative but perhaps this larger difference in VMrel
pendent of age. Results did not significantly change between male RA patients and controls could explain
when substituting age with age3. why in males but not in females the difference between
Not surprisingly, males had a higher hand volume RA and PsA groups was also significant. In other words,
than females. Gender differences of relative muscle the main difference in VMrel between males and females
volume were smaller but with the exception of sub- is observed in the RA group. Whether this can be ex-
jects with RA, males also had higher relative muscle plained by the degree of inflammation, by differential
volume than females. In the control (Pso) group, age therapeutic interventions, differences in the efficacy of
related decreases were larger for relative muscle than an intervention or the way the hands are used in daily
for hand volume, which can be explained by increas- life is an interesting questions that warrants further in-
ing muscle fat infiltration with age. Our very prelim- vestigation. Unfortunately the power of our data was in-
inary and still limited results, which showed an sufficient to further explore the differential contribution
Fig. 5 Age dependency of relative muscle volume for males (left) and females (right). Additionally displayed are the regression line of the model
linear (solid black line) and cubic in age (dashed black line) for the union of the three groupsFriedberger et al. BMC Musculoskeletal Disorders (2020) 21:203 Page 8 of 11
Table 5 Differences in relative muscle volume between RA, Pso and PsA patients after adjustment for age and age and BMI as
independent covariates
Age 20–80 years Age 40–80 years
VMrel / males age age & BMI age age & BMI
(SBMI) (SBMI)
RA – Pso p < 0.0001 Δ = − 0.040 p < 0.001 Δ = − 0.045 p < 0.0001 Δ = − 0.041 p < 0.0001 Δ = − 0.039
PsA – Pso n.s. p = 0.05Δ = − 0.021 n.s. n.s.
RA – PsA p < 0.0001 Δ = − 0.033 p = 0.02 Δ = − 0.023 p < 0.0001 Δ = − 0.045 p = 0.02 Δ = − 0.024
VMrel / females
RA – Pso p = 0.01 Δ = − 0.023 p = 0.09 Δ = + 0.020 p = 0.03 Δ = − 0.022 p = 0.03 Δ = − 0.020
PsA – Pso n.s. n.s. n.s. p = 0.05 Δ = − 0.019
RA – PsA n.s. n.s. n.s. n.s.
Δ denotes the VMrel difference between two groups, on average in the denoted age interval. VMrel ranges between 0 and 1, thus Δ*100 stands for the percentage
point difference of relative muscle volume. Data after age and BMI adjustment were only obtained in subgroup SBMI. The calculations are repeated for the age
group 40–80 years (two most-right columns)
Fig. 6 Relative muscle volume displayed for the four decades between 40 and 80 years for females. The number of patients (n) per box are displayed above/
below them. The blue bars below each panel are the significance level of the corresponding group differences, with * (p < 0.05), ** (p < 0.001) and *** (p < 0.0001)Friedberger et al. BMC Musculoskeletal Disorders (2020) 21:203 Page 9 of 11 Fig. 7 Relative muscle volume displayed for the four decades between 40 and 80 years for males. For the description of the numbers and blue bars see Fig. 6 of intramuscular adipose tissue in male and female RA demonstrate differences between patients with Pso, patients. PsA and RA. There are a number of limitations that As already indicated in the background section, most should be addressed in future investigations: RA patients have a normal BMI. This fact was indirectly First, the use of Pso patients as controls could be confirmed in this study. No or only very small, mostly criticized as recently subclinical inflammation has non-significant effects of BMI were observed on VH, been reported in Pso patients [15]. Thus a control VMrel and VFrel. Probably the hand, which was the focus group of healthy subjects should also be investigated. of this study is too small in order to show a significant Second, functional measurements such as grip impact on BMI, which is a whole body parameter. How- strength, data on pharmaceutical interventions and ever, BMI also did not reflect changes in fat content other diagnostic scores should be added as covariates caused by fatty infiltration in paraspinal [25], or gluteus to the analysis. Third, fat measurements should be muscles [26]. generated in a larger number of subjects. Fourth, this This study was a pilot study to demonstrate that was a cross-sectional study, correlations with age need MRI can be used to assess hand and hand muscle cautious interpretations. Longitudinal data still have volume and intramuscular adipose tissue and to to be collected.
Friedberger et al. BMC Musculoskeletal Disorders           (2020) 21:203                                                                              Page 10 of 11

                                                                                  Funding
                                                                                  This project has been funded by the German Federal Ministry of Education
                                                                                  and Research, METARTHROS, BMBF 01EC1407A. The funding was used for
                                                                                  software development and data analysis.

                                                                                  Availability of data and materials
                                                                                  The datasets generated and/or analysed during the current study are not
                                                                                  publicly available since the consent does not include an agreement to put
                                                                                  the patient images in public domain, but are available from the
                                                                                  corresponding author on reasonable request.

                                                                                  Ethics approval and consent to participate
                                                                                  The patient consent form included an agreement to also use the data for
                                                                                  research purposes (Ethics approval 52_14B of the Medical Faculty of FAU
                                                                                  Erlangen-Nuremberg).

                                                                                  Consent for publication
                                                                                  Not applicable.

                                                                                  Competing interests
                                                                                  The authors declare that they have no competing interests.

                                                                                  Author details
                                                                                  1
                                                                                   Institute of Medical Physics, University of Erlangen-Nuremberg, Henkestraße
                                                                                  91, 91052 Erlangen, Germany. 2FAU Erlangen-Nuremberg, Department of
  Fig. 8 Fat ratio plotted against relative muscle volume for all groups          Internal Medicine 3, and Universitätsklinikum, Erlangen, Germany. 3FAU
  and both sex                                                                    Erlangen-Nuremberg, Radiological Institute, and Universitätsklinikum,
                                                                                  Erlangen, Germany.

Conclusions                                                                       Received: 13 January 2019 Accepted: 9 March 2020
These preliminary data showed that relative hand
muscle volume decreased with age in male and female
                                                                                  References
patients with Pso, PsA and RA patients. Independent of                            1. Challal S, Minichiello E, Boissier MC, Semerano L. Cachexia and adiposity in
age, relative hand muscle volume was smaller in patients                              rheumatoid arthritis. Relevance for disease management and clinical
with RA compared to the patients with Pso and the dif-                                outcomes. Joint Bone Spine. 2016;83(2):127–33.
                                                                                  2. Roubenoff R, Roubenoff RA, Ward LM, Holland SM, Hellmann DB.
ference was twice as large in males compared to females.                              Rheumatoid cachexia: depletion of lean body mass in rheumatoid arthritis.
Also in male but not in female RA patients relative hand                              Possible association with tumor necrosis factor. J Rheumatol. 1992;19(10):
muscle volume was smaller than in PsA patients. Prelim-                               1505–10.
                                                                                  3. Lemmey AB. Rheumatoid cachexia: the undiagnosed, untreated key to
inary results further indicate that the decrease in relative                          restoring physical function in rheumatoid arthritis patients? Rheumatology.
hand muscle volume is associated with an increase of                                  2016;55(7):1149–50.
relative fat content.                                                             4. Roubenoff R. Rheumatoid cachexia: a complication of rheumatoid arthritis
                                                                                      moves into the 21st century. Arthritis Res Ther. 2009;11(2):108.
                                                                                  5. Masuko K. Rheumatoid cachexia revisited: a metabolic co-morbidity in
Abbreviations
                                                                                      rheumatoid arthritis. Front Nutr. 2014;1:20.
BMI: Body mass index; CSA: Cross sectional area; Ifat: Dixon fat image;
                                                                                  6. Summers GD, Deighton CM, Rennie MJ, Booth AH. Rheumatoid cachexia: a
Iff: Dixon fat fraction image; Iwater: Dixon water image; MCP: Metacarpal bone;
                                                                                      clinical perspective. Rheumatology. 2008;47(8):1124–31.
MRI: Magnetic resonance imaging; PsA: Psoriatic arthritis; Pso: Psoriasis;
                                                                                  7. Marcus RL, Addison O, Kidde JP, Dibble LE, Lastayo PC. Skeletal muscle fat
RA: Rheumatoid arthritis; RC: Rheumatoid cachexia; SBMI: Subgroup of
                                                                                      infiltration: impact of age, inactivity, and exercise. J Nutr Health Aging. 2010;
patients with available BMI data; Sdixon: Subgroup of patients with available
                                                                                      14(5):362–6.
MR dixon images; TSE: Turbo spin echo; VF: Fat volume; VFrel: Relative fat
                                                                                  8. Visser M, Kritchevsky SB, Goodpaster BH, Newman AB, Nevitt M, Stamm E,
volume; VH: Hand volume; VM: Muscle volume; VMrel: Relative muscle volume
                                                                                      Harris TB. Leg muscle mass and composition in relation to lower extremity
(= VM / VH); VOI: Volume of interest
                                                                                      performance in men and women aged 70 to 79: the health, aging and
                                                                                      body composition study. J Am Geriatr Soc. 2002;50(5):897–904.
Acknowledgements                                                                  9. Frontera WR, Hughes VA, Fielding RA, Fiatarone MA, Evans WJ, Roubenoff R.
The present work was performed in partial fulfilment of the requirements for          Aging of skeletal muscle: a 12-yr longitudinal study. J Appl Physiol. 2000;
obtaining the PhD degree Dr. rer. Biol. hum. at the University of Erlangen-           88(4):1321–6.
Nuremberg.                                                                        10. Arner E, Ryden M, Arner P. Tumor necrosis factor alpha and regulation of
                                                                                      adipose tissue. N Engl J Med. 2010;362(12):1151–3.
Authors’ contributions                                                            11. Hotamisligil GS, Shargill NS, Spiegelman BM. Adipose expression of tumor
AF developed the software, analysed the datasets, performed the statistical           necrosis factor-alpha: direct role in obesity-linked insulin resistance. Science.
analysis and created the original draft. CF, IdO, AK and DS collected data and        1993;259(5091):87–91.
reviewed and edited the original draft. AG implemented and tested the             12. Veale D, Yanni G, Rogers S, Barnes L, Bresnihan B, Fitzgerald O. Reduced
clinical hand MR Dixon protocol. TB, JR, MU and GS contributed to study               synovial membrane macrophage numbers, ELAM-1 expression, and lining
design and patient investigations, provided data interpretation and reviewed          layer hyperplasia in psoriatic arthritis as compared with rheumatoid arthritis.
and edited the original draft. GS furthermore contributed to the analysis and         Arthritis Rheum. 1993;36(7):893–900.
made major contribution in writing the manuscript. KE as senior author had        13. Foell D, Kane D, Bresnihan B, Vogl T, Nacken W, Sorg C, Fitzgerald O, Roth J.
designed the study, supervised the project and contributed to the                     Expression of the pro-inflammatory protein S100A12 (EN-RAGE) in
manuscript. All authors read and approved the final manuscript.                       rheumatoid and psoriatic arthritis. Rheumatology. 2003;42(11):1383–9.
Friedberger et al. BMC Musculoskeletal Disorders (2020) 21:203 Page 11 of 11
14. Naredo E, Moller I, de Miguel E, Batlle-Gualda E, Acebes C, Brito E,
Mayordomo L, Moragues C, Uson J, de Agustin JJ et. al. High prevalence of
ultrasonographic synovitis and enthesopathy in patients with psoriasis
without psoriatic arthritis: a prospective case-control study. Rheumatology.
2011;50(10):1838–1848.
15. Faustini F, Simon D, Oliveira I, Kleyer A, Haschka J, Englbrecht M, Cavalcante
AR, Kraus S, Tabosa TP, Figueiredo C et. al. Subclinical joint inflammation in
patients with psoriasis without concomitant psoriatic arthritis: a cross-
sectional and longitudinal analysis. Ann Rheum Dis 2016;75(12):2068–2074.
16. Tustison NJ, Avants BB, Cook PA, Zheng Y, Egan A, Yushkevich PA, Gee JC.
N4ITK: improved N3 bias correction. IEEE Trans Med Imaging. 2010;29(6):
1310–20.
17. Sled JG, Zijdenbos AP, Evans AC. A nonparametric method for automatic
correction of intensity nonuniformity in MRI data. IEEE Trans Med Imaging.
1998;17(1):87–97.
18. Criminisi A, Shotton J, Konukoglu E. Decision forests: A unified framework
for classification, regression, density estimation, manifold learning and semi-
supervised learning. Foundations and Trends® in Computer Graphics and
Vision. 2012;7(2–3):81–227.
19. Cuingnet R, Prevost R, Lesage D, Cohen LD, Mory B, Ardon R. Automatic
detection and segmentation of kidneys in 3D CT images using random
forests. In: International Conference on Medical Image Computing and
Computer-Assisted Intervention: 2012. Springer; 2012;66–74.
20. Ma J. Dixon techniques for water and fat imaging. J Magn Reson Imaging.
2008;28(3):543–58.
21. Glüer C-C, Blake G, Lu Y, Blunt B, Jergas M, Genant H. Accurate assessment
of precision errors: how to measure the reproducibility of bone
densitometry techniques. Osteoporos Int. 1995;5(4):262–70.
22. Gunther CM, Burger A, Rickert M, Crispin A, Schulz CU. Grip strength in
healthy caucasian adults: reference values. J Hand Surg Am. 2008;33(4):558–65.
23. The R Project for Statistical Computing. https://www.r-project.org/.
24. Fischer MA, Pfirrmann CW, Espinosa N, Raptis DA, Buck FM. Dixon-based
MRI for assessment of muscle-fat content in phantoms, healthy volunteers
and patients with achillodynia: comparison to visual assessment of calf
muscle quality. Eur Radiol. 2014;24(6):1366–75.
25. Crawford RJ, Filli L, Elliott JM, Nanz D, Fischer MA, Marcon M, Ulbrich EJ.
Age- and level-dependence of fatty infiltration in lumbar paravertebral
muscles of healthy volunteers. AJNR Am J Neuroradiol. 2016;37(4):742–8.
26. Marcon M, Berger N, Manoliu A, Fischer MA, Nanz D, Andreisek G, Ulbrich
EJ. Normative values for volume and fat content of the hip abductor
muscles and their dependence on side, age and gender in a healthy
population. Skelet Radiol. 2016;45(4):465–74.
Publisher’s Note
Springer Nature remains neutral with regard to jurisdictional claims in
published maps and institutional affiliations.You can also read