COVID-19 Severity Is Tripled in the Diabetes Community: A Prospective Analysis of the Pandemic's Impact in Type 1 and Type 2 Diabetes
←
→
Page content transcription
If your browser does not render page correctly, please read the page content below
526                                                                                                 Diabetes Care Volume 44, February 2021

                                                                                                                               Justin M. Gregory,1 James C. Slaughter,2
                                      COVID-19 Severity Is Tripled in                                                          Sara H. Duffus,1 T. Jordan Smith,1
                                                                                                                               Lauren M. LeStourgeon,3 Sarah S. Jaser,1
                                      the Diabetes Community: A                                                                Allison B. McCoy,4 James M. Luther,5
                                                                                                                               Erin R. Giovannetti,6 Schafer Boeder,6
                                      Prospective Analysis of the                                                              Jeremy H. Pettus,6 and Daniel J. Moore1

                                      Pandemic’s Impact in Type 1 and
                                      Type 2 Diabetes
                                      Diabetes Care 2021;44:526–532 | https://doi.org/10.2337/dc20-2260

                                      OBJECTIVE
                                      To quantify and contextualize the risk for coronavirus disease 2019 (COVID-19)–
                                      related hospitalization and illness severity in type 1 diabetes.

                                      RESEARCH DESIGN AND METHODS
                                      We conducted a prospective cohort study to identify case subjects with COVID-19
                                      across a regional health care network of 137 service locations. Using an electronic
                                      health record query, chart review, and patient contact, we identified clinical factors
                                      influencing illness severity.
PATHOPHYSIOLOGY/COMPLICATIONS

                                                                                                                               1
                                      RESULTS                                                                                   Ian M. Burr Division of Pediatric Endocrinology
                                                                                                                               and Diabetes, Vanderbilt University School of
                                      We identified COVID-19 in 6,138, 40, and 273 patients without diabetes and with           Medicine, Nashville, TN
                                      type 1 and type 2 diabetes, respectively. Compared with not having diabetes, people      2
                                                                                                                                Department of Biostatistics, Vanderbilt Univer-
                                      with type 1 diabetes had adjusted odds ratios of 3.90 (95% CI 1.75–8.69) for             sity Medical Center, Nashville, TN
                                                                                                                               3
                                      hospitalization and 3.35 (95% CI 1.53–7.33) for greater illness severity, which was       Division of General Internal Medicine and Public
                                                                                                                               Health, Department of Medicine, Vanderbilt Uni-
                                      similar to risk in type 2 diabetes. Among patients with type 1 diabetes, glycosylated    versity School of Medicine, Nashville, TN
                                      hemoglobin (HbA1c), hypertension, race, recent diabetic ketoacidosis, health             4
                                                                                                                                Department of Biomedical Informatics, Vander-
                                      insurance status, and less diabetes technology use were significantly associated          bilt University School of Medicine, Nashville, TN
                                                                                                                               5
                                      with illness severity.                                                                    Division of Clinical Pharmacology, Vanderbilt
                                                                                                                               University School of Medicine, Nashville, TN
                                                                                                                               6
                                      CONCLUSIONS                                                                               Division of Endocrinology and Metabolism, De-
                                                                                                                               partment of Medicine, University of California,
                                      Diabetes status, both type 1 and type 2, independently increases the adverse             San Diego, La Jolla, CA
                                      impacts of COVID-19. Potentially modifiable factors (e.g., HbA1c) had significant but      Corresponding author: Justin M. Gregory, justin
                                      modest impact compared with comparatively static factors (e.g., race and in-             .m.gregory.1@vumc.org
                                      surance) in type 1 diabetes, indicating an urgent and continued need to mitigate         Received 9 September 2020 and accepted 10
                                      severe acute respiratory syndrome coronavirus 2 infection risk in this community.        November 2020
                                                                                                                               This article contains supplementary material online
                                                                                                                               at https://doi.org/10.2337/figshare.13235066.
                                      The medical community currently lacks sufficient data to adequately mitigate the impact   This article is part of a special article collection
                                      of the novel coronavirus disease 2019 (COVID-19) in the type 1 diabetes community.       available at https://care.diabetesjournals.org/
                                      At present, our knowledge is largely extrapolated from recent retrospective analyses     collection/diabetes-and-COVID19.
                                      of hospitalized patients (1–5), which have strongly suggested “diabetes” increases       © 2020 by the American Diabetes Association.
                                      risk for COVID-19 morbidity and mortality. These studies did not, however, distinguish   Readers may use this article as long as the work is
                                                                                                                               properly cited, the use is educational and not for
                                      between type 1 diabetes and type 2 diabetesdtwo pathophysiologically distinct            profit, and the work is not altered. More infor-
                                      conditions. Although reports of COVID-19 in type 1 diabetes are emerging, the scope      mation is available at https://www.diabetesjournals
                                      of these investigations to date has been limited by including only hospitalized          .org/content/license.
care.diabetesjournals.org Gregory and Associates 527
patients (6,7), patients referred to a reg- diagnostic panel, with probes and primers c No hospitalization
istry (8), or an analysis of mortality as the provided by Integrated DNA Technologies c Hospitalization for any reason without
sole outcome without directly verifying (Coralville, IA). We then categorized these any respiratory support
patient-specific factors (9,10). Thus, there case subjects by diabetes category, as c Hospitalization for any reason with
remains a need to ascertain a wider range shown in the flowchart in Supplementary lower acuity respiratory support (e.g.,
of clinical outcomes across a broader Fig. 1, according to problem list diagno- oxygen by nasal canula, nonrebreather
spectrum of patients with type 1 diabetes ses. If a patient’s problem list included mask, or continuous or bilevel positive
infected with severe acute respiratory both type 1 diabetes and type 2 diabetes, airway pressure)
syndrome coronavirus 2 (SARS-CoV-2). the primary investigator (J.M.G.) adjudi- c Intensive care unit (ICU) admission for
Although clinical outcome data for the cated which diagnosis was more likely. any reason
SARS-CoV-2 virus in type 1 diabetes are Type 1 diabetes was assigned if the c Endotracheal intubation and mechan-
lacking, some evidence suggests people patient had a history of having autoanti- ical ventilation for any reason
with type 1 diabetes are prone to worse bodies associated with type 1 diabetes c Death for any reason
outcomes when infected with other re- or required multiple daily injections.
spiratory viruses (11). Both type 1 diabetes– Type 2 diabetes was assigned if the Hospitalization was analyzed as a bi-
related factors, such as dysglycemia, type 1 patient required multiple oral antihy- nary outcome using logistic regression.
diabetes duration, BMI, and vascular dis- perglycemic medications. We retrieved Disease severity was analyzed using the
ease, and demographic factors, such as prespecified clinical outcomes related proportional odds ordinal logistic regres-
age, race/ethnicity, and social determi- to COVID-19 and covariates thought to sion model. In all models, we included
nants of health, may modify these risks. potentially affect illness severity (listed diabetes status and adjusted for a set of
To address these critical gaps in our in Supplementary Appendix Tables 1–3), prespecified covariates that could poten-
knowledge, we aimed to answer two as documented in the EHR. Beginning tially confound the association between
questions. First, among patients with with the first case subject with COVID-19 in diabetes status and illness severity. These
COVID-19, to what extent does a diagnosis March 2020, we prospectively repeated covariates included age, sex, BMI, diabetes
of type 1 diabetes increase risk for hos- the query every 2 weeks to identify case category, smoking history, race, and a
pitalization, greater severity of illness, and subjects, outcomes, and covariates. We history of hypertension. Results are pre-
death compared with patients without also accessed publicly available data sented as odds ratios (ORs) with corre-
diabetes or those with type 2 diabetes? sets from the Tennessee Department of sponding 95% CIs. Forall analyses, multiple
Second, which covariates increase risk Health to determine thenumber ofpositive imputation (10 imputed data sets) for
for a more severe outcome among people and total COVID-19 tests that were con- missing covariates was performed using
with type 1 diabetes? To answer these ducted in the local community around the “aregImpute” function available in the
questions, we conducted a prospective VUMC (i.e., Davidson County and its six rms package for R version 3.6.3 (13).
cohort study to identify case subjects with surrounding counties, accessed on https:// After detailed chart review and patient
COVID-19 using the electronic health re- www.tn.gov/content/tn/health/cedep/ surveys, we further analyzed the risk fac-
cord (EHR), categorizing each patient by ncov/data.html). tors listed in Supplementary Appendix
diabetes category: no diabetes, type 1 To further characterize factors that Table 3 for worsening illness severity
diabetes, or type 2 diabetes. modulate risk for COVID-19 severity, we among the patients with type 1 diabetes.
conducted a detailed chart review on all To quantify the effect size of each in-
RESEARCH DESIGN AND METHODS case subjects in patients with type 1 di- dependent variable on the ordinal vari-
Data Collection abetes and attempted to contact them able for illness severity, we determined
We retrieved data by querying the Epic by telephone. After we obtained written, the unadjusted OR for worse illness
Clarity data warehouse at Vanderbilt Uni- informed consent via electronic document, severity for each independent variable
versity Medical Center (VUMC). This data patients completed a survey over the using univariate ordinal regression.
warehouse encompasses the entire EHR phone, including questions about their
at VUMC, a network of 137 primary care, medical history and social determinants RESULTS
urgent care, and hospital facilities that of health (as listed in Supplementary Demographic and Clinical
manages .2 million ambulatory and in- Appendix Tables 1–3). Characteristics of Patients With
patient visits annually. During the pro- The research team managed study data COVID-19 Identified by EHR Query
spective study period between 17 March using secure Research Electronic Data Cap- During the prospective study period be-
and 7 August 2020, VUMC tested all pa- ture (REDCap) electronic data tools (12). tween 17 March and 7 August 2020,
tients admitted to the hospital for any The Institutional Review Board of Vander- VUMC obtained 83,437 SARS-CoV-2 PCR
reason and all patients prior to any surgical bilt University approved the study protocol. results for 69,701 unique individuals at
procedure. Additionally, tests were con- VUMC, 6,451 of whom tested positive for
ducted on patients presenting to VUMC Calculations and Data Analysis COVID-19 (7.7% positive). By compari-
primary care, after-hours, urgent care, and To quantify the magnitude of COVID-19 son, 45,456 of 372,779 SARS-CoV-2 PCR
minor medical clinics. Using our EHR query, severity, we defined an ordinal outcome tests (12.2%) were positive in Davidson
we identified all individuals with a positive variable for illness severity with six mu- County, TN, and its six surrounding coun-
COVID-19 test at VUMC, as determined tually exclusive levels that had to occur ties over the same interval. Of the COVID-
by a positive Centers for Disease Control within 14 days of a positive PCR test for 19–positive individuals at VUMC, 6,138
and Prevention SARS-CoV-2 real-time PCR SARS-CoV-2: had no diabetes, 40 had type 1 diabetes,528 Excess Severity of COVID-19 in Type 1 Diabetes Diabetes Care Volume 44, February 2021
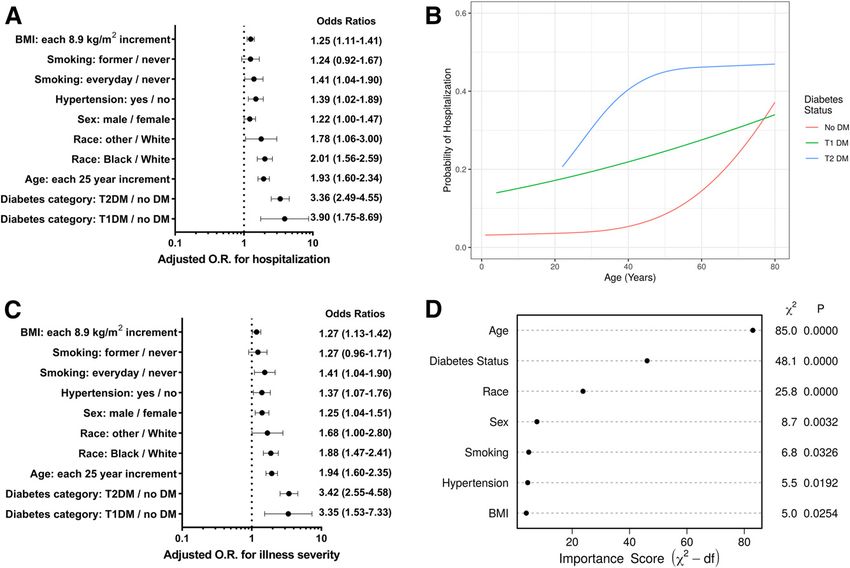
and 273 had type 2 diabetes. Table 1 by diabetes status. Whereas hospitaliza- age, race, sex, hypertension, smoking, and
summarizes demographic and clinical char- tion was three times more likely to occur in BMI. Figure 1 summarizes adjusted ORs
acteristics of these patients. The median patients with type 1 diabetes than patients for hospitalization rates and illness sever-
age and BMI of patients with type 1 di- without diabetes (22.5% vs. 7.1%; P , ity. After statistical adjustment, groups
abetes were similar to the group without 0.001), hospitalization in the group with with both type 1 and type 2 diabetes had
diabetes, while patients with type 2 di- type 2 diabetes occurred two times more similarly increased odds of hospitalization
abetes were two decades older and had often than in the group with type 1 di- and worsening illness severity relative to
a BMI ;20% higher than the other two abetes (44.3% vs. 22.5%; P 5 0.009), which individuals without diabetes (Fig. 1A and
groups. Pediatric patients (i.e., aged ,18 was two decades younger. No deaths C). In type 1 diabetes, the adjusted ORs
years) comprised 9.4%, 20.0%, and 0% of occurred in the group with type 1 diabetes, were 3.90 (95% CI 1.75–8.69) for hospi-
the groups with no diabetes, type 1 di- but deaths occurred in 0.5% of patients talization and 3.35 (95% CI 1.53–7.33) for
abetes, and type 2 diabetes, respectively. without diabetes (P 5 0.67 vs. type 1 worsening illness severity. For type 2 di-
The type 1 diabetes cohort had a higher diabetes) and 4.8% of patients with type 2 abetes, the adjusted ORs were 3.36 (95%
percentage for White race and a lower diabetes (P 5 0.368 vs. type 1 diabetes and CI 2.49–4.55) for hospitalization, 3.42
percentage for Hispanic ethnicity. The per- P , 0.001 vs. no diabetes). Unadjusted for (95% CI 2.55–4.58) for worsening illness
centage of individuals taking medications other covariates, illness severity in pa- severity, and 3.21 (95% CI 1.54–6.70) for
to treat hypertension or who had a di- tients with type 1 diabetes was worse than death. Across all ages, patients with type 1
agnosis of hypertension or asthma was in those without diabetes (P , 0.001), but diabetes had a higher probability of hos-
lowest for those without diabetes, inter- less severe than in those with type 2 di- pitalization than patients without diabe-
mediate for those with type 1 diabetes, and abetes (P , 0.001). tes (Fig. 1B). Next to age, the presence of
highest for those with type 2 diabetes. diabetes was the most important factor in
Adjusted Outcome Data for Patients the multivariable ordinal regression model
Unadjusted Outcome Data for Patients With COVID-19 Identified by EHR for illness severity (Fig. 1D).
With COVID-19 Identified by EHR Query
Query Because of key differences in baseline risk Clinical Factors Associated With Worse
Supplementary Table 1 summarizes un- factors between the groups (e.g., older COVID-19 Outcomes in Type 1 Diabetes
adjusted COVID-19 hospitalization rates age in the group with type 2 diabetes), we Because an EHR query is limited in its
and illness severity for patients categorized used multivariable regression to adjust for ability to capture some risk factors for a
Table 1—Baseline characteristics of patients with COVID-19 grouped by diabetes status (no diabetes, type 1 diabetes, and type 2
diabetes)
Baseline characteristic No diabetes (n 5 6,138) T1DM (n 5 40) T2DM (n 5 273) Percent missing
Age, years, median (interquartile range, total range) 33 (23–48, ,1 day–97 years) 37 (21–51, 4–80) 58 (49–97, 22–91) 0
Male sex, % (n) 46.8 (2,871) 42.5 (17) 56.0 (153) 0
BMI, kg/m2 26.6 (22.8–31.5) 25.0 (21.5–28.6) 32.6 (28.1–37.6) 28
Weight, kg 77.1 (62.9–93.0) 74.0 (62.5–81.7) 97.1 (81.7–114.8) 23
Most recent HbA1c within past year, % 5.3 (5.1–5.6) 8.0 (7.1–9.1) 7.5 (6.5–8.8) 89*
Most recent HbA1c within past year, mmol/mol 34 (32–38) 64 (54–76) 58 (48–73) 89*
Diagnosis of hypertension, % (n) 9 (568) 33 (13) 71 (194) 0
Diagnosis of asthma, % (n) 6 (345) 5 (2) 10 (28) 0
Smoking status, % (n)
Never smoker 81 (3,590) 82 (31) 67 (171)
Former smoker 10 (430) 18 (7) 23 (59) 27
Some days smoker 0 (0) 0 (0) 0 (0)
Every day smoker 10 (424) 0 (0) 11 (27)
Taking ACE-I, % (n) 3 (207) 32 (13) 28 (75) 0
Taking ARB, % (n) 4 (212) 12 (5) 22 (59) 0
Taking any antihypertensive medication other
than ACE-I or ARB, % (n) 9 (542) 18 (7) 50 (135) 0
Race, % (n)
White 67 (3,106) 79 (30) 53 (141)
Black 15 (676) 18 (7) 34 (91)
Asian 3 (117) 0 (0) 3 (8) 24
American Indian/Alaska Native 0 (13) 0 (0) 1 (2)
Unknown 15 (684) 3 (1) 8 (22)
Native Hawaiian/Pacific Islander 0 (6) 0 (0) 0 (1)
Hispanic ethnicity, % (n) 10 (559) 3 (1) 11 (29) 12
Continuous variables are summarized as medians (interquartile range). Categorical and ordinal variables are expressed as percentages (counts). ACE-I,
ACE inhibitor; ARB, angiotensin receptor blocker; T1DM, type 1 diabetes mellitus; T1DM, type 2 diabetes mellitus. *HbA1c was missing for 92% of
patients without diabetes, 17% of patients with T1DM, and 39% of patients with T2DM.care.diabetesjournals.org Gregory and Associates 529 Figure 1—A: OR plot displaying adjusted ORs and 95% CIs for independent variables associated with hospitalization with COVID-19 within 14 days of a positive test. B: Probability of COVID-19–positive hospitalization by age, categorized by diabetes type, adjusted to a BMI of 26 kg/m2. C: OR plot displaying adjusted ORs and 95% CIs for independent variables associated with worsening illness severity with COVID-19 within 14 days of a positive test. D: ANOVA plot depicting the importance of clinical factors in the multivariable ordinal regression model for illness severity. DM, diabetes mellitus; T1DM, type 1 diabetes mellitus; T2DM, type 2 diabetes mellitus. worse outcome in type 1 diabetes, we diabetes. Clinical factors significantly as- identified race as White were hospital- conducted a detailed chart review on sociated with greater COVID-19 illness ized, and the unadjusted OR for greater 37 out of 40 patients with type 1 diabetes severity (P , 0.05) included having a illness severity was 0.091 for White race infected with SARS-CoV-2. Fifteen of these previous diagnosis of hypertension, versus not White race (P 5 0.007). patients consented to participate in a tele- higher glycosylated hemoglobin (HbA1c), Seventy-one percent of patients who phone survey to further characterize clin- taking any antihypertensive medication identified as Black or African American ical factors that might worsen sequelae other than an ACE inhibitor or angiotensin were hospitalized, and the unadjusted OR from COVID-19. Of the 37 chart-reviewed receptor blocker, having at least one DKA for worse illness severity was 10.4 for case subjects, 76% required no hospitali- admission in the past year, and not using a Black race versus not Black race (P 5 zation, 14% were hospitalized without continuous glucose monitor (CGM). There 0.009). While 8% of patients with private need for respiratory support or ICU ad- was insufficient evidence to determine insurance were hospitalized, 60% of pa- mission, 3% were hospitalized and required whether patients with a past medical tients with public insurance only were low-acuity respiratory support, 5% re- history of microvascular disease tended hospitalized and 67% of patients with no quired ICU admission, and 3% required to have worsening illness severity. insurance were hospitalized. The unad- endotracheal intubation and mechanical Of the 11 patients previously diagnosed justed OR for increased illness severity ventilation. No deaths occurred within with hypertension, 55% were hospital- was 30.7 for public or no insurance versus 14 days of positive SARS-CoV-2 testing. ized. By comparison, only 12% of the private insurance (P 5 0.001). Although None of the patients were diagnosed with 25 patients not diagnosed with hyperten- the survey included questions about in- myocarditis, acute cardiac injury, or arryth- sion were hospitalized. The unadjusted OR come category and highest level of edu- mia. Only one patient was hospitalized with for greater illness severity was 7.06 in the cation, we found patients who were diabetic ketoacidosis (DKA) within 14 days hypertensive patients versus patients hospitalized were less likely to take phone of positive SARS-CoV-2 testing. without hypertension (P 5 0.020). calls or report this information. Table 2 lists summary statistics and Social determinants of health were Similarly, patients using higher levels ORs for the association of clinical factors also significantly related to severity out- of technology to manage their diabetes with COVID-19 illness severity in type 1 come. Eleven percent of patients who were less likely to have worse outcomes.
530   Excess Severity of COVID-19 in Type 1 Diabetes                                                               Diabetes Care Volume 44, February 2021

         Table 2—Clinical characteristics, unadjusted ORs for more severe illness, and P values for key variables correlating with
         COVID-19 severity among 37 patients with type 1 diabetes whose charts were reviewed
         Variable                                                   Value             Percent missing         OR           P value
         Age, years                                                            32 (21–48)                     0                   1.23*            0.317
         Male sex, % (n)                                                       40.5 (15)                      0                   1.04             0.754
         BMI, kg/m2                                                         24.8 (21.5–28.6)                  3                   0.133            0.465
         Weight, kg                                                         73.9 (62.5–80.2)                  0                   1.06†            0.574
         Most recent HbA1c within past year, %                                8.0 (7.1–9.5)                  14                   1.52             0.045
         Most recent HbA1c within past year, mmol/mol                          64 (54–80)                    14                    d               0.045
         Type 1 diabetes duration, years                                        18 (9–29)                    11                   0.98             0.631
         Number of DKA admissions within past year, % (n)
           Zero                                                                 91   (29)
           One                                                                   3   (1)                     14                  18.26‡             0.21
           Two                                                                   3   (1)
           Three                                                                 3   (1)
         Primary glucose monitoring device, % (n)
            Blood glucose meter                                                 41 (15)                       0                   8.70             0.016
            Continuous glucose meter                                            58 (22)
         Primary insulin delivery method, % (n)
            $3 injections daily                                                 53 (18)                       8                   7.07             0.085
            Insulin pump                                                        47 (16)
         Has seen an endocrinologist within the past year, % (n)                94 (30)                      14                   0.10             0.101
         Any nephropathy, % (n)                                                  17 (6)                       5                   5.21             0.071
         Any retinopathy, % (n)                                                  11 (4)                       5                   6.49             0.070
         Any neuropathy, % (n)                                                   11 (4)                       3                   6.07             0.080
         Smoking status, % (n)
           Never smoker                                                         80 (30)
           Former smoker                                                        20 (6)                        3                   4.45             0.104
           Some days smoker                                                      0 (0)
           Every day smoker                                                      0 (0)
         Had flu immunization in past year, % (n)                                74 (23)                      16                   0.35             0.349
         Taking ACE-I, % (n)                                                    32 (12)                       0                   2.16             0.321
         Taking ARB, % (n)                                                       11 (4)                       0                   3.04             0.288
         Taking any antihypertensive medication other than
           ACE-I or ARB, % (n)                                                  14 (5)                        0                   14.60            0.007
         Diagnosis of hypertension, % (n)                                       31 (11)                       3                   7.06             0.020
         Previous diagnosis of asthma, % (n)                                      6 (2)                       6                   2.34             0.561
         Race, % (n)
           White                                                                78 (28)
           Black                                                                19 (7)
           Asian                                                                 0 (0)                        3                  10.94§            0.007
           American Indian/Alaska Native                                         0 (0)
           Unknown                                                               3 (1)
           Native Hawaiian/Pacific Islander                                       0 (0)
         Health insurance type, % (n)
           No insurance                                                         16 (16)
           Public insurance only                                                14 (5)                        0                  30.72|            0.001
           Private insurance only                                               68 (25)
           Both private and public insurance                                     3 (1)
         Percent missing indicates that chart review could determine the variable of interest and values are reported for nonmissing data only. Continuous
         variables are summarized as medians (interquartile range). Categorical and ordinal variables are expressed as percentages (counts). ACE-I, ACE
         inhibitor; ARB, angiotensin receptor blocker. *OR is for each 10-year increase in age. †OR is for each 10-kg increase in weight. ‡OR is for any DKA
         admissions in the past year vs. none. §OR is for non-White race vs. White race. |OR is for public or no insurance vs. private insurance.

       Whereas only 9% of patients using a CGM as         monitor versus CGM (P 5 0.016). While               CONCLUSIONS
       the primary means of glucose monitoring            only 6% of patients using an insulin pump           Two principal themes emerge from these
       were hospitalized, 47% of patients using a         were hospitalized, 33% of patients using            data regarding the severity of COVID-19
       blood glucose monitor as the primary               multiple daily injections were hospitalized.        in type 1 diabetes. First, after adjustment
       means of glucose monitoring were hospi-            The unadjusted OR for greater illness               for age, race, and other risk factors, the
       talized. The unadjusted OR for worse illness       severity was 7.07 for multiple daily injec-         odds of a COVID-19–related hospitalization
       severity was 8.70 for a blood glucose              tions versus insulin pump use (P 5 0.085).          and greater illness severity for patients
care.diabetesjournals.org Gregory and Associates 531
with type 1 diabetes are three- to four- people with type 1 diabetes. For this that clinicians and patients were more
fold higher than for patients without reason, our detailed chart review of likely to refer more severe case subjects
diabetes. This increased risk is approxi- 37 out of the 40 COVID-19–positive to the T1D Exchange multicenter registry.
mately the same for patients with type 2 patients with type 1 diabetes enhanced Similarly, physicians participating in the
diabetes (Fig. 1A and C). Second, COVID- our ability to analyze associations be- registry may have been unaware of less
19 outcome severity in type 1 diabetes is tween potential clinical covariates and severe case subjects in the community.
associated with glycemic, vascular, and outcome severity. Our analysis suggests This tendency for referral bias may have
socioeconomic risk factors. chronic hyperglycemia and vascular dis- been particularly true during the early
Before adjustment for baseline charac- ease, social determinants of health, and weeks of the unfolding pandemic when
teristics that differed between groups, decreased use of diabetes technology the preliminary report was published.
patients with type 1 diabetes appeared correlate significantly with outcome se- Strengths of our study include the ability
tohavea riskfor hospitalization and greater verity; these factors represent common of the EHR query to broadly and prospec-
illness severity that was intermediate be- characteristics between type 1 and type tively identify case subjects with COVID-19
tween the group with no diabetes and the 2 diabetes and suggest that addressing across our entire EHR in an unbiased
group with type 2 diabetes. Importantly, modifiable factors will reduce risk in fashion. Further, testing at Vanderbilt cap-
however, once our analysis adjusted the all patients with diabetes. These relation- tures a wide cross-section of illness sever-
odds of hospitalization and greater illness ships are not surprising given the linkage ity. In contrast with two recent studies
severity for other known COVID-19 risk between these risk factors and worse characterizing clinical characteristics of pa-
factors, especially age, both groups with illness with COVID-19 reported in pre- tients with type 1 diabetes hospitalized
diabetes had similar odds of worsening vious studies that did not focus on type 1 with COVID-19 (6,7), our analysis included
morbidity compared with the group with- diabetes. For example, the heightened not only every hospitalized patient, but also
out diabetes. The three- to fourfold ad- risk of poor outcomes for patients with numerous patients in outpatient primary
justed OR for hospitalization and greater type 1 diabetes with hypertension re- care, minor medical, and urgent care clinics
illness severity seen in this investigation is ported in this study is consistent with (i.e., many patients withmilder symptoms).
comparable to the adjusted OR for mor- findings from previous meta-analyses of Additionally, our hospital tests all patients
tality recently reported by the National the broader Chinese population (15,16). immediately prior to an elective surgical
Health Service (NHS) in England. In this Whereas previous reports have indicated procedure (i.e., many entirely asymptom-
large population study, the adjusted ORs proportionally higher rates of hospital- atic patients). Because this approach does
for in-hospital death with COVID-19 were izations from COVID-19 among Black not rely on clinics to report case subjects
3.5 for people with type 1 diabetes and 2.0 patients and those with public insurance with COVID-19 in type 1 diabetes, it is less
for people with type 2 diabetes (both (17), this study is the first to show a similar prone to referral bias than other current
relative to people without diabetes) (9). finding in the population with type 1 approaches (8). Furthermore, our approach
Whereas our data agree with an in- diabetes. Although our investigation iden- determined the presence of COVID-19
creasing body of evidence suggesting tified an inverse correlation between di- in a straightforward, standardized fash-
hospitalization rates are low in individuals abetes technology use and illness severity, ion across the EHR: to have COVID-19 for
without diabetes and rise considerably we found that patients with worse illness our study, the patient simply had to
after 40 years of age (14), our analysis severity answered questions about socio- have a positive SARS-CoV-2 PCR test.
additionally suggests the probability of economic status at a lower rate. Thus, our In addition, our phone survey allowed
hospitalization is substantially higher for analysis cannot exclude the possibility us to collect more detailed information
patients with type 1 diabetes than pa- that greater amounts of diabetes tech- about social determinants of health.
tients without diabetes until nearly the nology use are a surrogate for higher Thus, our approach complements that
eighth decade of age (Fig. 1B). Although socioeconomic status. Somewhat surpris- of our colleagues who are also working to
the NHS investigators reported low abso- ingly, we did not observe a significant characterize COVID-19 in type 1 diabetes.
lute risk for mortality for patients with correlation between type 1 diabetes du- Three significant limitations of this study
type 1 diabetes ,40 years of age, when ration and COVID-19 severity. Moreover, warrant consideration. First, data were
we examine the more common outcome we did not find statistically significant accrued from a single academic health
of hospitalization, we find the probability associations between the illness severity system largely serving urban and suburban
ranges between ;15% and ;22% for and age and sex within the type 1 diabetes populations. Although the VUMC system
patients ,40 years of age, after adjust- cohort. We suspect these relationships includes many outpatient testing locations
ment for BMI. This probability is consid- would have been stronger had the sample throughout the local community (e.g.,
erably greater than the ;5% risk seen size been larger, since these correlations primary care, minor medical, and urgent
over that age range in individuals with- were robust in the larger EHR cohort. care clinics), we were unable to access
out diabetes. Thus, the increased risk Interestingly, only 1 out of 40 patients detailed information about case subjects
for COVID-19–related hospitalization with type 1 diabetes diagnosed with with COVID-19 identified outside the
remains markedly higher for people COVID-19 was also hospitalized for DKA. VUMC system. Second, although all hos-
with type 1 diabetes until the seventh This finding contrasts with a preliminary pitalized and presurgical patients at VUMC
decade of life. report from the T1D Exchange Collabora- received COVID-19 testing during the pro-
An EHR query is limited in its ability to tion, which found 46% of 33 COVID-19– spective study period, our study cannot
accurately capture many risk factors for positive patients had DKA (8). One possible exclude the possibility that clinicians in the
COVID-19 morbidity, particularly among reason for this significant discrepancy is outpatient setting were more likely to532 Excess Severity of COVID-19 in Type 1 Diabetes Diabetes Care Volume 44, February 2021
test patients with diabetes than without our colleagues to emphasize the impor- 5. Richardson S, Hirsch JS, Narasimhan M, et al.;
diabetes because of the perception that tance of social distancing measures and the Northwell COVID-19 Research Consortium.
Presenting characteristics, comorbidities, and
patients with diabetes were at greater risk. hand hygiene, with particular emphasis on outcomes among 5700 patients hospitalized
Third, although we extensively character- patients with diabetes, including those in with COVID-19 in the New York City area [pub-
ized risk factors and outcomes for patients the most vulnerable communities who lished correction appears in JAMA 2020;323:
with COVID-19 in this study, the sample size our study affirms will face the most severe 2098]. JAMA 2020;323:2052–2059
remains relatively small compared with 6. Wargny M, Gourdy P, Ludwig L, et al.; CO-
impact. RONADO investigators. Type 1 diabetes in people
whole-population studies. This smaller sam-
hospitalized for COVID-19: new insights from the
ple size prevented us from conducting CORONADO study. Diabetes Care 2020;43:e174–
some multivariate regression analyses Acknowledgments. The authors thank Alexan- e177
within the group with type 1 diabetes dria DuBois, Vanderbilt University Medical Cen- 7. Vamvini M, Lioutas V-A, Middelbeek RJW.
and from better characterizing COVID-19 ter (Nashville, TN), for administrative support Characteristics and diabetes control in adults
outcomes in Hispanic patients with type 1 throughout the study. with type 1 diabetes admitted with COVID-19
Funding. Research supported in this publication infection. Diabetes Care 2020;43:e120–e122
diabetes. Additionally, more rare outcomes, was supported by the National Institute of Di- 8. Ebekozien OA, Noor N, Gallagher MP, Alonso
such as death, are difficult to adequately abetes and Digestive and Kidney Diseases of the GT. Type 1 diabetes and COVID-19: preliminary
characterize. This is likely the reason for the National Institutes of Health under award number findings from a multicenter surveillance study in
striking difference seen in the death rate in K23DK123392 (to J.M.G.) and T32DK007061 (to the U.S. Diabetes Care 2020;43:e83–e85
our study (0 out of 40 COVID-19–positive S.H.D.). J.M.G was supported by a JDRF Career 9. Barron E, Bakhai C, Kar P, et al. Associations
Development Award (5-ECR-2020-950-A-N) and by of type 1 and type 2 diabetes with COVID-19-
patients with type 1 diabetes) and that of the Appleby Foundation. related mortality in England: a whole-population
the whole-population study done by NHS The content is solely the responsibility of the study. Lancet Diabetes Endocrinol 2020;8:813–
England (9,10), which focused on mortality authors and does not necessarily represent the 822
as the outcome of interest. Because the official views of the National Institutes of Health, 10. Holman N, Knighton P, Kar P, et al. Risk
JDRF, or the Appleby Foundation. factors for COVID-19-related mortality in people
present investigation involved a compara-
Duality of Interest. No potential conflicts of with type 1 and type 2 diabetes in England:
tively smaller sample size, it can neither interest relevant to this article were reported. a population-based cohort study. Lancet Diabe-
support nor refute the NHS study’s finding Author Contributions. J.M.G. designed the tes Endocrinol 2020;8:823–833
of high mortality in COVID-19–positive pa- study, conducted chart review, contacted partic- 11. Carey IM, Critchley JA, DeWilde S, Harris T,
tients with type 1 diabetes. Instead, our ipants, analyzed data, and wrote the manuscript. Hosking FJ, Cook DG. Risk of infection in type 1
S.H.D. and T.J.S. conducted chart review and
analysis complements the NHS study by and type 2 diabetes compared with the general
contacted participants. A.B.M. created the EHR
showingtheadjustedoddsofhospitalization population: a matched cohort study. Diabetes
search query and performed data downloads. L.M.L.
and the severity of illness with COVID-19 are Care 2018;41:513–521
created the REDCap database and performed
12. Harris PA, Taylor R, Thielke R, Payne J,
three- to fourfold higher in type 1 diabetes data downloads. J.M.L. collected epidemiologic
Gonzalez N, Conde JG. Research electronic data
versus a comparable population of individ- data. S.S.J., E.R.G., S.B., J.H.P., and D.J.M. helped
capture (REDCap)–a metadata-driven methodol-
design the study, analyze the data, and write the
uals who do not have diabetes. manuscript. J.C.S. assisted with the study design, ogy and workflow process for providing trans-
Our data have important implications conducted statistical analysis, and wrote the man- lational research informatics support. J Biomed
for the community with diabetes as colder uscript. All authors critically reviewed the manu- Inform 2009;42:377–381
script. J.M.G. is the guarantor of this work and, as 13. R Core Team. R: A Language and Environ-
temperatures emerge in the Northern
such, had full access to all of the data in the study ment for Statistical Computing. Vienna, Austria, R
hemisphere. As social activities move in- Foundation for Stastical Computing, 2019
and takes responsibility for the integrity of the data
side, humidity decreases, and the will to and the accuracy of the data analysis. 14. Centers for Disease Control and Prevention.
maintain social distancing practices wanes, COVID-19 hospitalization and death by age, 2020.
experts have expressed considerable con- Accessed 8 September, 2020. Available from https://
References
www.cdc.gov/coronavirus/2019-ncov/covid-data/
cern that SARS-CoV-2 transmission will 1. Yang X, Yu Y, Xu J, et al. Clinical course and
investigations-discovery/hospitalization-death-by-
increase sizably (18). Our investigation outcomes of critically ill patients with SARS-CoV- age.html
suggests that as COVID-19 hospitalizations 2 pneumonia in Wuhan, China: a single-centered, 15. Zheng Z, Peng F, Xu B, et al. Risk factors of
rise, patients with both type 1 and 2 di- retrospective, observational study. Lancet Respir critical & mortal COVID-19 cases: a systematic
Med 2020;8:475–481 literature review and meta-analysis. J Infect
abetes will comprise a disproportionally
2. Guan WJ, Ni ZY, Hu Y, et al.; China Medical 2020;81:e16–e25
higher number of those admissions and, Treatment Expert Group for Covid-19. Clinical 16. Yang J, Zheng Y, Gou X, et al. Prevalence of
once hospitalized, demonstrate a greater characteristics of coronavirus disease 2019 in comorbidities and its effects in patients infected
degree of illness severity. Thus, unless the China. N Engl J Med 2020;382:1708–1720 with SARS-CoV-2: a systematic review and meta-
type 1 diabetes community reamplifies 3. Grasselli G, Zangrillo A, Zanella A, et al.; COVID- analysis. Int J Infect Dis 2020;94:91–95
its efforts to mitigate the spread of SARS- 19 Lombardy ICU Network.. Baseline character- 17. Price-Haywood EG, Burton J, Fort D, Seoane
CoV-2 in the coming months, physicians istics and outcomes of 1591 patients infected with L. Hospitalization and mortality among black
SARS-CoV-2 admitted to ICUs of the Lombardy patients and white patients with covid-19. N
should anticipate an imminent escalation
region, Italy. JAMA 2020;323:1574–1581 Engl J Med 2020;382:2534–2543
in the number of these patients with 4. Bhatraju PK, Ghassemieh BJ, Nichols M, et al. 18. Scudellari M. How the pandemic might play
severe illness, including both adults and Covid-19 in critically ill patients in the seattle region - out in 2021 and beyond. Nature 2020;584:22–
children. In light of these data, we call on case series. N Engl J Med 2020;382:2012–2022 25You can also read