Beating the news using Social Media: the case study of American Idol
←
→
Page content transcription
If your browser does not render page correctly, please read the page content below
Beating the news using Social Media: the case study of American Idol∗
Fabio Ciulla,1 Delia Mocanu,1 Andrea Baronchelli,1 Bruno Gonçalves,1 Nicola Perra,1 and Alessandro Vespignani1, 2, 3
                                  1
                                    Department of Physics, College of Computer and Information Sciences,
                             Department of Health Sciences, Northeastern University, Boston MA 02115 USA
                                     2
                                       Institute for Scientific Interchange Foundation, Turin 10133, Italy
                         3
                           Institute for Quantitative Social Sciences, Harvard University, Cambridge, MA, 02138
                                                              (Dated: May 23, 2012)
                  We present a contribution to the debate on the predictability of social events using big data ana-
               lytics. We focus on the elimination of contestants in the American Idol TV shows as an example of a
               well defined electoral phenomenon that each week draws millions of votes in the USA. We provide
               evidence that Twitter activity during the time span defined by the TV show airing and the voting
               period following it, correlates with the contestants ranking and allows the anticipation of the voting
               outcome. Twitter data from the show and the voting period of the season finale have been analyzed
               to attempt the winner prediction at 10.00 am of May the 23rd ahead of the airing of the official result.
               Furthermore, the fraction of Tweets that contain geolocation information allows us to map the fanbase
               of each contestant, both within the US and abroad, showing that strong regional polarizations occur.
               Although American Idol voting is just a minimal and simplified version of complex societal phenom-
               ena such as political elections, this work shows that the volume of information available in online
               systems permits the real time gathering of quantitative indicators anticipating the future unfolding of
               opinion formation events.

   The recent global surge in the use of technologies such             frequency (every week) over an extended period (an en-
as Social Media, smart phones and GPS devices has                      tire TV Season) provides a close to ideal test ground for
changed the way in which we live our lives in a fun-                   the study of electoral outcomes as many of the assump-
damental way. Our use of such technologies is also hav-                tions implicitly used in the analysis of social phenomena
ing a much less visible, but not less significant, conse-              are more easily arguable, if not trivially true, in the case
quence: the collection on a massive scale of extremely                 of the American idol competition. In particular, we as-
detailed data on social behavior is providing a unique                 sume that:
and unprecedented opportunity to observe and study
social phenomena in a completely unobtrusive way. The                     • The demographics of users tweeting about Amer-
public availability of such data, although limited, has                     ican Idol are representative of the voting pool.
already ignited a flurry of research into the develop-
ment of indicators that can act as distributed proxies                    • The self-selection bias, according to which the peo-
for what is occurring around the world in real time. In                     ple discussing about politics on Twitter are likely
particular, search engine queries or posts on microblog-                    to be activists scarcely representative of the aver-
ging systems such as Twitter have been used to fore-                        age voter, seems to become almost a positive dis-
cast epidemics spreading [1], stock market behavior [2]                     crimination factor in the case of a TV show where
and election outcomes[3–6] with varying degrees of suc-                     the voters are by definition self-selected.
cess. However, as many authors have pointed out, there
are several challenges one must face when dealing with                    • Voting fans are the most motivated subset of the
data of this nature: intrinsic biases, uneven sampling                      audience (the population we are trying to probe)
across location of interest etc. [7–10].                                    that are willing to make an extra effort for no per-
                                                                            sonal reward, and, crucially, they are allowed to
   In this paper we intend to assess the usefulness of                      vote multiple times.
open source data by analyzing in depth the microblog-
ging activity surrounding the voting behavior on the                      • Users are not malicious, and engage only in con-
contestants in American Idol, one of the most viewed                        versations he or she has a particular interest in
American TV Shows. In this program, the audience is
asked to choose which contestant goes forward in the                      • The influence incumbency, which strongly affects
competition by voting for their favorites. The well de-                     the outcome of political elections, is not a factor
lineated time frame (a period of just a few hours) and                      determining the outcome of American Idol.

                                                                         For the above reasons we can consider TV show com-
∗ This
                                                                       petitions as a case study for the use of open source in-
      is an updated version of the paper where data gathered during
the show and voting time of May 22 have been processed. The only       dicators to achieve predictive power, or simply beating
changes to the manuscript are in Section 5 where we discuss the real   the news, about social phenomena. It is thus not surpris-
time predictions concerning the season 11 finale.                      ing that other attempts to use open source indicators in
2
this context have been proposed in the past. Here how- Contestant U.S.A. World Philippines
ever we benefit from the the constant growth of Twit- Jessica 45 ± 4 64.2 ± 2.2 92.8 ± 1.9
ter that makes it easier to collect significative statisti- Joshua 15 ± 3 9.8 ± 1.3 1.4 ± 0.9
cal sample of the population. Furthermore, TV shows
Phillip 40 ± 4 26 ± 2.0 5.8 ± 1.7
are now leveraging on Twitter and other social platform
which are becoming in all respects a mainstream part of TABLE I: Popularity basins. Data concerns the entire Ameri-
the show. This amplifies the importance of the indica- can Idol season up to the morning of May 17 (before the two
tors one can possibly extract from these media in moni- finalists were announced), and refers to the percentage (%) of
toring the competition. popularity within U.S., the whole World and the Philippines.
The geo-localized database for the three candidates contains
3251 data points. Errors represent the normal confidence in-
I. RULES AND VOTING SYSTEM terval with a confidence level of 99%.
The first episode of the 11th season of American Idol
for tweets containing one or more of the keywords we
was aired on January 18, 2012 with a total of 42 con-
identified as related to American Idol. The search API
testants. After an initial series of eliminations made by
data cover the period since May 16, giving us a more
the judges, a final set of 13 participants was selected.
detailed view of the last elimination before the season’s
All further eliminations were decided by the audience
finale.
through a simple voting system. During this final phase
of the competition, two episodes are aired each week:
On Wednesday the participants perform on stage and
the public is invited to vote for two hours after the show III. A CARTOGRAPHY OF THE FANBASE
ends. Voting can take one of three forms: toll-free phone
calls, texting and online voting. The rules of the compe- Tweets in our dataset often contain georeferenced lo-
tition only allow for votes casted by the residents of the cation information that allows us to analyze the spatial
U.S., Puerto Rico and U.S. Virgin Islands. There is no patterns in voting behavior. Figure 1 shows a strong
limit to the number of messages or calls each person can geographical polarization in the U.S. towards different
make, while the online votes are limited to 50 per com- candidates. In the weeks preceding the Top 3 show
puter as identified by its unique IP address. Every week, [panels (B) and (C)], for example, Phillip Phillips gathers
hundreds of millions of votes are counted and the con- most of the attention in the Midwest and South, while
testant that gathers the least number is eliminated. The Jessica Sanchez appears to be popular particularly on
show airs at 8.00 PM local time on each coast. As a result the West Coast as well as in the large metropolitan ar-
of the time zone difference of three hours between the eas across all of the country, and Joshua Ledet is strong
East and West coast, the total voting window between in Louisiana. The Top 3 week analysis [panel (A)] shows
the first and last possible vote is 10.00PM-3.00AM EST. a disturbance from the previous geographical distribu-
During the season’s final performance episode the vot- tion, perhaps due to the performance of the candidates.
ing window is extended to four hours after the show As expected, the audience reacts to the events occur-
airs, resulting in an extended voting window between ring on Wednesday night. On the other hand, and per-
10.00PM-5.00AM EST. haps not surprisingly, the attention basins of each of
the three participants always include their origin city
(Phillips was born and raised in Georgia, Sanchez is
II. DATA from Chula Vista, California, and Ledet from the Lake
Charles metropolitan area in Louisiana)[12].
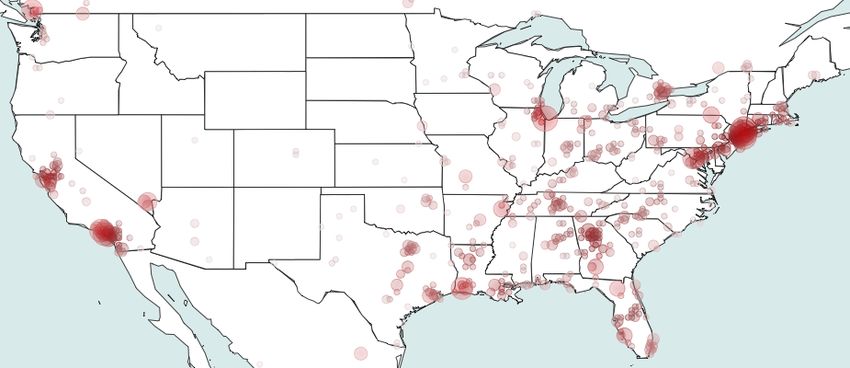
Our fundamental assumption is that the attention re- The geolocalized data also allows for a unique view
ceived by each contestant in Twitter is a proxy of the of the attention devoted to American Idol in the rest of
general preference of the audience. To validate this the world. Although one might naively expect interest
assumption, we collected tweets containing a list of to be limited to the US, Figure 2 shows that the show
51 #tags, usernames and strings related to the show. is also popular in several foreign countries and particu-
The main dataset was obtained by extracting matching larly in the Philippines. This can be understood by not-
tweets from the raw Twitter feed used by Truthy [11] ing that one of the contestants is of Filipino origin. Jes-
for the entire duration of the current season of Ameri- sica Sanchez’s mother is originally Filipino, having been
can Idol. The feed is a sample of about 10% of the en- born in the Bataan province [13]. Participation in Amer-
tire number of tweets that provides a, statistically sig- ican Idol has made Sanchez so popular in her moth-
nificant, real time view of the topics discussed within ers native country that on May 16 the Philippine Presi-
the Twitter ecosystem. This allowed us to make a post- dent Benigno Aquino III congratulated the singer for her
event analysis of the last 9 eliminations. This dataset performance and stated, “Hopefully she really reaches
was further complemented by the results of automati- the top.” [14]. Table I quantifies this intuition. Jessica
cally querying the Twitter search API every 10 minutes Sanchez related Tweets are 45% of the total if only U.S.3
(A)
(B)
(C)
FIG. 2: Local and global attention towards American Idol. Top:
U.S. data show that the highest Twitter activity is concentrated
in the large metropolitan areas, as expected. Bottom: The
Jessica Phillip Philippines are distinctly more active than any other foreign
Country. It is worth noting also that a remarkable signal is
Joshua Hollie produced in Indonesia, too, which is very active country with
Skylar CC respect to Twitter activity in general.
FIG. 1: Geographical polarization of the tweets for the Top 3
(A), Top 4 (B) and Top 5 (C) episodes. The area of each State is IV. POST-EVENT ANALYSIS
proportional to the number of geolocalized tweets generated
there, while the color represents the contestant with the major- Our fundamental, and somehow naive, assumption is
ity of the vote. The grey represent states we could not assign that the number of votes each contestant receives is pro-
to a single contestant within the statistical errors (CC).
portional to the number of tweets that mention her. In
other words, the larger the number of tweets referred to
a contestant - the twitter volume - the larger the num-
ber of votes she will get. This gives a natural measure to
rank each contestant. It is important to note that this is
a very simple measure, and that we deliberately choose
not to take into account many of the factors that in prin-
is considered, while it rises to 64% if the whole World ciple might affect the results, such as the presence of
is considered. Officially, Sanchez’s popularity abroad negative or neutral tweets, or attempts to directly affect
should not have any impact on voting, since, as men- the counts by spamming the system with automatically
tioned above, only the U.S. based audience is allowed generated tweets. In fact, one of the goals of this paper
to take part into the election procedure. However, it is is to test whether or not a minimal set of measures ap-
interesting to note that the Filipino-restricted Twitter ac- plied to Twitter data can be good indicators of the actual
tivity concerning Jessica is strongly peaked in the two voting outcome. Past attempts have met with ambiva-
voting sessions of American Idol for the East and West lent results and we are interested in testing the limits of
timezones, and that numerous websites explicitly ad- this naive approach by building an unsophisticated pre-
dress the issue of ”voting tunnels”: “How to Vote for diction system assembled in less than one week.
Jessica Sanchez from the Philippines and Other Non-US While our dataset spans the entire duration of the cur-
Countries” [15]. Although we have no proof of any ir- rent season, we focus only on the top-ten phase of the
regular voting activity, tweets analysis clearly points out show, when just 10 contestants remained and test the
to a possible anomaly that may be a concern. predictive power of the Twitter proxy against the last 94
250
200
Top 3
Jessica
200 100
Jessica
# tweets
150 8 PM 9 PM 10 PM Phillip
Phillip
Joshua
100
Joshua
50
Top 4
Jessica
8 PM 9 PM 10 PM 11 PM 12 PM 1 AM 2 AM 3 AM
Phillip
FIG. 3: Live popularity of the participants to the Top 3 night.
The number of tweets related to each one of the Top 3 contes- Joshua
tants is plotted as a function of time, from the start of the show
(8 PM EST) and the closing of the voting in the West Coast (3 Hollie
AM EST), on Wednesday May 16, 2012. The data is plotted
with the granularity of the minute. The inset magnifies the Top 5
two hours of the first airing of the show on the East Coast. Jessica
Phillip
Day Eliminated Cont. Data Indicators Bottom 3
Joshua
May 17 Joshua X N/A
May 10 Hollie X N/A Hollie
May 3 Skylar X X Skylar
April 26 Elise CC X 0 10 20 30 40 50 60 70
April 19 Colton × X % of Tweets
April 12 Jessica (saved) × (2/3)
FIG. 4: For the last three eliminations we plot the ranking of
April 05 DeAndre CC X
each contestant measured as the percentage of tweets in the
March 29 Heejun CC (2/3) time window 8.00PM -3.00AM EST of the last three Wednes-
March 22 Erika CC (1/3) days. We plot the 99% confidence intervals. In red we mark
the contestant that was eliminated the next day. It is clear that
TABLE II: We consider the last nine eliminations. In the ta- even considering the errors, the ranking done considering the
ble we report the date of the elimination, the contestant elim- volume of tweets related to a specific contestant, is sufficient
inated, whether the data indicators correctly single out the to identify the least preferred.
elimination (X), it is wrong (×) or provide a to close to call
(CC). In the last column we compare the data indications for
the bottom three (two) contestants announced during the first
seven eliminations. We report when within error bars the sig- on May 16. Interestingly the number of tweets associ-
nal identifies the bottom three contestants (X), two out of three ated to the eliminated contestant (Joshua) is practically
(2/3) or one out of three (1/3) contestants. always the smallest. The inset provided a detailed view
of the live show time period. At this resolution the se-
quence of peaks of each contestant correlates with time
eliminations. For 7 of those, the ”bottom-three” contes- and sequence of their performances that night.
tants, the least three voted contestants (2 in the elimina- For each of the last 9 weeks, we have integrated
tion of May 3rd ) were revealed during the iconic part of the number of tweets related to each user in the
the show: elimination day. We consider not just the suc- show+voting time window. We then ranked the con-
cess in predicting the contestant that will be eliminated testants in decreasing order. The last 3 count as the
but also the three that received the least votes. bottom three and the last contestant is the most likely
In order to minimize the noise that might be introduced to be eliminated. We confront our prediction with the
by discussions after the voting time and especially af- real outcomes. To account for errors induced by sam-
ter the elimination, we considered the number of tweets pling of the real number of tweets we evaluated the
generated on a specific time window: 8.00 PM - 3.00 AM 99% confidence intervals assuming a homogenous and
EST each Wednesday. The show airs at 8 PM EST. The fair sampling and report the results in Table II . Twit-
votes can be submitted until midnight in the West coast ter data serves as a correct indicator for the last three
which translates to 3.00 AM in the east. In Figure 3 we eliminations and identifies correctly most of the bottom
show the number of tweets related to each of the top three/two contestants.
three contestants for every minute of the voting window Twitter signal indications were wrong two times, and5
we have other four cases in which the confidence inter-
World
vals in the ranking could not allow to make a predic-
tion (too close too call). In Figure 4 it is possible to no- Jessica
tice that, as expected, when the number of contestants
reduces and the fan base solidifies, the differences be-
tween ranks become much clearer and separated.
Phillip
V. AND THE WINNER IS...
The analysis of the season finale is based on the data U.S.
collected between the beginning of the show in the East
at 8.00 P.M. EST and the end of the voting period in the Phillip
west, at 4.00 A.M. EST. The histogram of Figure 5 has a
twofold interpretation. If we consider the whole of our
dataset, as we have done in the previous analysis, Jessica
turns out to have been the most popular in Twitter in our Jessica
time window. Henceforth, the analysis analysis used for
the elimination shows lead us to predict that Jessica will
be the winner of the show. 0 10 20 30 40 50 60 70 80
However, there is an important caveat. As we pointed % of Tweets
out before, Jessica is the only contestant that has a strong
Twitter signal originating from outside of the U.S. (and FIG. 5: Finale ranking. The ranking of the two contestants of
in particular from the Philippines), with an increasing season finale, measured as the percentage of tweets in the time
trend after the show on April 19. Given that the voting window 8.00PM-4.00AM EST, is plotted. The top histogram
is restricted to the U.S. only, it is helpful to have a closer takes in to account the whole dataset (World), while the bot-
look at the data, and consider the subset of Tweets that tom one only considers the set of tweets geolocalized in the
come with geographical metadata. Although the geolo- United States (U.S.). We report the 99% confidence intervals.
calized data are a much smaller subset of the total signal,
this dataset allows us to provide the contestants’ stand-
ing restricted to the USA Twitter population. In the US,
Phillip appears to have the largest fanbase of the two
contestants (see also the cartogram of Figure 6). If the
possibility of votes coming from abroad is discarded, us-
ing the available data, we could then claim that Phillip
is going to be the winner of the 11th edition of Ameri-
can Idol. However, the data show that the advantage of
Phillip in the U.S. is remarkably smaller than the one of
Jessica in the aggregated dataset, and the voting coming
from abroad might have a crucial role in determining
the outcome of the finale. Jessica Phillip CC
FIG. 6: Geographical polarization of the tweets for the Top
VI. CONCLUSION 2 contestants. The area of each State is proportional to the
number of geolocalized tweets generated there, while the color
We have shown that the open source data available represents the contestant with the majority of the vote. The
on the web can be used to make educated guesses on grey represent states we could not assign to a single contes-
the outcome of societal events. Specifically, we have tant within the statistical errors (CC).
shown that extremely simple measures quantifying the
popularity of the American Idol participants on Twitter
strongly correlate with their performances in terms of what it is possible to deduce by Social Media. As such,
votes. A post-event analysis shows that the less voted we purposefully do not consider a number of refine-
competitors can be identified with reasonable accuracy ments and techniques that could improve the accuracy
(Table II) looking at the Twitter data collected during of our predictions. Distortions due to overactive users
the airing of the show and in the immediately follow- can be controlled by evaluating the number of unique
ing hours. users tweeting on each contestant. The text of the tweets
It is worth noting that our analysis aims to be ex- could be scrutinized by using sentiment analysis tech-
tremely simple in order to establish a valid baseline on niques to select and compare only specific positive or6
negative tweets as a proxy for success/failure. Cor- web. Given the large economic interests that lay behind
rections to the demographic representations of Twitter such programs, such as the revenues of betting agencies
users could be considered. All these techniques have and the major contracts of the show participants, it is
been or are being developed in the analysis of a wealth obvious that this situation can lead to a number of un-
of social phenomena and could be tested in a very clear desirable outcomes. For example, the audience could be
and simple setting such as those of American Idol or induced to alter their behavior in function of the situa-
similar shows. tion they observe, and the job of betting agencies could
Furthermore, we have illustrated that open source be dramatically simplified. On a more general basis, our
data can provide a deeper insight into the composition results highlight that the aggregate preferences and be-
of the audience, with the eventual possibility of point- haviors of large numbers of people can nowadays be
ing out possible sources of anomalous behaviors. A ge- observed in real time, or even forecasted, through open
ographical projection of the data reveals a non-uniform source data freely available in the web. The task of keep-
distribution of the basins of fans, and likely of voters, ing them private, even for a short time, has therefore be-
for the different participants. Interestingly, the same in- come extremely hard (if not impossible), and this trend
spection highlights also that a strong activity concerning is likely to become more and more evident in the future
some of the candidates may come from non-U.S. coun- years.
tries, whose audience are officially forbidden to vote.
Finally, our work casts a word of warning on the pos-
sible feedback between competitive TV shows and so-
cial media. Indeed, while the former rely more and more
Acknowledgements
on the online voting of the audience, and the votes are
kept secret and revealed only at the end of the show,
all of the data necessary to monitor and even forecast The authors would like to thank Duygu Balcan for
the outcome of these shows is publicly available on the generating the cartograms used in this manuscript.
[1] A. Culotta, in Proceedings of the First Workshop on Social [9] A. Mislove, S. Lehmann, Y. Ahn, J. Onnela, and J. Rosen-
Media Analytics (ACM, 2010), pp. 115–122. quist, in Fifth International AAAI Conference on Weblogs and
[2] J. Bollen, H. Mao, and X. Zeng, Journal of Computational Social Media (2011).
Science 2, 1 (2011). [10] D. Gayo-Avello, Arxiv preprint arXiv:1204.6441 (2012).
[3] A. Tumasjan, T. Sprenger, P. Sandner, and I. Welpe, in Pro- [11] J. Ratkiewicz, M. Conover, M. Meiss, B. Gonçalves,
ceedings of the Fourth International AAAI Conference on We- S. Patil, A. Flammini, and F. Menczer, Twentieth Interna-
blogs and Social Media (2010), pp. 178–185. tional World Wide Web Conference 249 (2011).
[4] A. Livne, M. Simmons, E. Adar, and L. Adamic, in Fifth [12] http://www.americanidol.com/contestants/season 11
International AAAI Conference on Weblogs and Social Media [13] http://newsinfo.inquirer.net/183767/jessica-sanchez-
(2011). makes-it-to-idols-top-5-rocker-elise-testone-out
[5] M. Skoric, N. Poor, P. Achananuparp, E. Lim, and J. Jiang, [14] http://www.washingtonpost.com/entertainment/tv/
in 2012 45th Hawaii International Conference on System Sci- philippine-president-aquino-roots-for-
ences (IEEE, 2012), pp. 2583–2591. jessica-sanchez-to-win-american-idol-next-
[6] E. Sang and J. Bos, EACL 2012 p. 53 (2012). week/2012/05/16/gIQAwsWzSU story.html
[7] J. Ratkiewicz, M. Conover, M. Meiss, B. Gonçalves, [15] http://www.starmometer.com/2012/04/19/how-
A. Flammini, and F. Menczer, in Fifth International AAAI to-vote-for-jessica-sanchez-from-the-
Conference on Weblogs and Social Media (2011), p. 297. philippines-and-other-non-us-countries/,
[8] P. Metaxas, E. Mustafaraj, and D. Gayo-Avello, in Privacy, http://www.gmanetwork.com/news/story/258482/
Security, Risk and Trust (PASSAT), 2011 IEEE Third Interna- pinoyabroad/pinoyachievers/pinoys-worldwide-can-
tional Conference on and 2011 IEEE Third International Con- vote-for-jessica-sanchez-through-facebook
fernece on Social Computing (SocialCom) (IEEE, 2011), pp.
165–171.You can also read