LAND SUBSIDENCE HAZARD IN IRAN REVEALED BY COUNTRY-SCALE ANALYSIS OF SENTINEL-1 INSAR
←
→
Page content transcription
If your browser does not render page correctly, please read the page content below
The International Archives of the Photogrammetry, Remote Sensing and Spatial Information Sciences, Volume XLIII-B3-2021
                                                    XXIV ISPRS Congress (2021 edition)

 LAND SUBSIDENCE HAZARD IN IRAN REVEALED BY COUNTRY-SCALE ANALYSIS
                        OF SENTINEL-1 INSAR

                                               M. Haghshenas Haghighi1 ∗, M. Motagh1,2
     1
         Institute of Photogrammetry and GeoInformation, Leibniz University Hannover, Germany - mahmud@ipi.uni-hannover.de
                      2
                        GFZ German Research Centre for Geosciences, Potsdam, Germany – motagh@gfz-potsdam.de

KEY WORDS: Land subsidence, InSAR, Time series analysis, Hazard, Big data.

ABSTRACT:

Many areas across Iran are subject to land subsidence, a sign of exceeding stress due to the over-extraction of groundwater during
the past decades. This paper uses a huge dataset of Sentinel-1, acquired since 2014 in 66 image frames of 250×250 km, to identify
and monitor land subsidence across Iran. Using a two-step time series analysis, we first identify subsidence zones at a medium
scale of 100 m across the country. For the first time, our results provide a comprehensive nationwide map of subsidence in Iran and
recognize its spatial distribution and magnitude. Then, in the second step of analysis, we quantify the deformation time series at
the highest possible resolution to study its impact on civil infrastructure. The results spots the hazard posed by land subsidence to
different infrastructure. Examples of road and railways affected by land subsidence hazard in Tehran and Mashhad, two of the most
populated cities in Iran, are presented in this study.

                       1. INTRODUCTION                                 Although land subsidence is a significant concern, from the wa-
                                                                       ter management and hazard control aspects, a complete data-
The scarcity of water resources in many areas of the world             base of affected areas and their dynamics in response to regional
has made communities dependent on groundwater pumping for              changes in groundwater depletion is not available yet. Previous
municipal, industrial, and agricultural purposes. As a result,         studies indicated land subsidence in some of the most critical
many aquifers around the globe are subject to exceeding stress         areas of the country. For example, Tehran, Iran’s capital, and
(Wada et al., 2011, Ashraf et al., 2017, Alley et al., 2018).          Rafsanjan, Iran’s center of Pistachio plantation, have been ex-
Global freshwater modeling and satellite gravity measurements          periencing land subsidence of up to 25 cm/yr (Motagh et al.,
of GRACE confirm that this is a worldwide issue (Alcamo                2008, Motagh et al., 2017, Haghshenas Haghighi and Motagh,
et al., 2003, Richey et al., 2015). However, at national or            2019). The previous studies on land subsidence in Iran were
basins scales, quantifying groundwater stress is more challen-         conducted in relatively small areas, i.e., at local to regional
ging mainly because groundwater is not directly accessible.            scales (Mousavi et al., 2001, Motagh et al., 2007, Dehghani et
                                                                       al., 2009, Babaee et al., 2020).
Land subsidence associated with groundwater extraction is a
sign of water stress. It can be measured, without direct access        The launch of the Sentinel-1 mission in 2014 provided an ava-
to groundwater, by using different geodetic techniques such as         lanche of publicly available SAR data suitable for InSAR ana-
leveling or Global Navigation Satellite System (GNSS) meas-            lysis of surface deformation. This mission acquires data reg-
urements (Mousavi et al., 2001, Wang and Soler, 2015). In              ularly from the same orbit every 6 or 12 days. Overland, it
recent decades, Interferometric Synthetic Aperture Radar (In-          covers an extensive swath of 250 km and acquires SAR images
SAR) has been widely used to map land subsidence at many               with 20×5 m resolution in azimuth and range directions, re-
aquifers around the world (Amelung et al., 1999, Chaussard et          spectively. Using two SAR images from the same orbit, it is
al., 2014, Castellazzi et al., 2016). Measurement of land sub-         possible to generate an interferogram and measure a snapshot
sidence not only indicates regional stress on the aquifer systems      of surface deformation e.g., caused by land subsidence.
due to groundwater extraction, but it also provides information
to assess present and the future hazard posed to the infrastruc-       Using more images, it is possible to analyze the time series of
tures and properties (Galloway and Burbey, 2011, Cigna et al.,         deformation. In the past two decades, several advanced meth-
2012).                                                                 ods including SqueeSAR (Ferretti et al., 2011) Persistent Scat-
                                                                       terer (PS) (Hooper et al., 2007) and Small BAseline Subset
Located in an arid to semi-arid region, Iran is one of the highest
                                                                       (SBAS) (Hooper, 2008) have been developed for InSAR time
affected areas by groundwater stress (Madani et al., 2016). All
                                                                       series analysis. All these methods follow a few general steps.
sectors in Iran are dependent on groundwater, but agriculture
                                                                       First, they generate a stack of interferograms from the SAR im-
alone is responsible for approximately 90% of groundwater
                                                                       ages. They, they identify pixels that preserve quality in the stack
consumption. The country is only second to India in groundwa-
                                                                       of interferograms. In the next step, they connect the interfero-
ter depletion embedded in food production (Dalin et al., 2017).
                                                                       metric phase of interferograms in the time domain to produce a
Land subsidence attributed to the over-extraction of groundwa-
                                                                       time series. Finally, they estimate and reduce the errors, such
ter is a widespread problem in many developed basins across
                                                                       as atmospheric phase delay, to produce the displacement time
Iran. It has affected agricultural and urban areas and threatened
                                                                       series.
civil infrastructures such as roads, bridges, and railways in
many parts.                                                            In this study, we perform InSAR measurements on a large stack
∗   Corresponding author                                               of SAR data acquired by Copernicus Sentinel-1 mission to de-

                                                  This contribution has been peer-reviewed.
                   https://doi.org/10.5194/isprs-archives-XLIII-B3-2021-155-2021 | © Author(s) 2021. CC BY 4.0 License.               155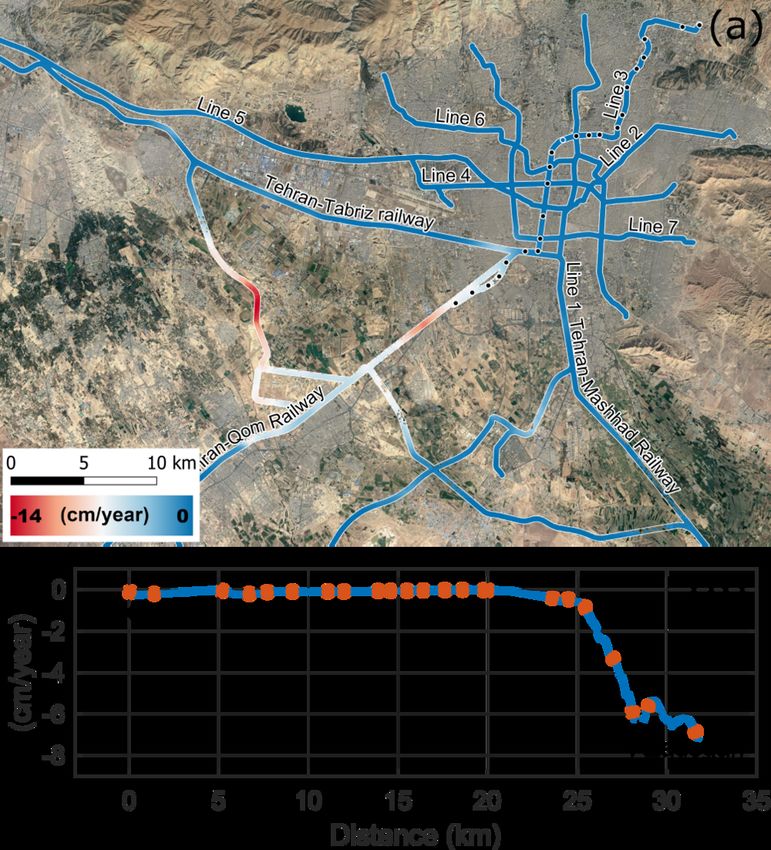
The International Archives of the Photogrammetry, Remote Sensing and Spatial Information Sciences, Volume XLIII-B3-2021
XXIV ISPRS Congress (2021 edition)
tect and monitor, for the first time, the magnitude of land sub-
sidence and the exact extent of affected areas across Iran. We
perform Interferometric analysis at two different scales: first,
we identify the subsidence areas at a medium resolution of 100
m. Then, we analyze the time series of subsidence at the spe-
cified locations at the highest possible resolution.
In the next section, we introduce the dataset and methods used
to investigate land subsidence in Iran. In the results, we first
introduce the nationwide subsidence map of Iran and discuss
its highlights. Then, we show two examples of InSAR time
series analysis at high resolution for infrastructure monitoring
in Tehran and Mashhad, the two most populated cities in Iran.
2. DATA AND METHOD
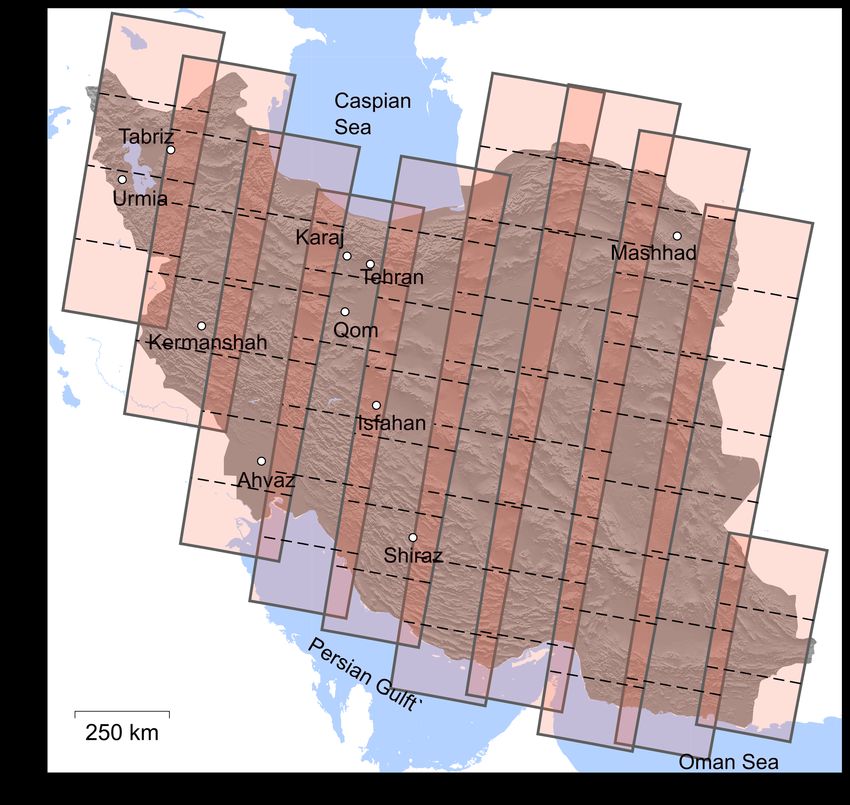
We use 66 image frames, each covering a 250×250-km area,
in 11 descending tracks acquired by Sentinel-1 mission. Al-
though land subsidence is a dynamic phenomenon, the nation-
wide picture of land subsidence is not expected to change over
a few years. Therefore, we employ more than 3500 SAR im-
ages acquired throughout three years between 2014 and 2017
to identify subsidence areas. Then, we use the entire archive Figure 2. Flowchart of our multi-scale approach to detect and
of Sentinel-1 data to perform monitoring of subsidence for the monitor land subsidence using large stacks of Sentinel-1 data.
identified areas. Figure 1 shows the frames of Sentinel-1 cov-
ering the whole country of Iran, which is as large as approxim-
stage, we concatenate all SAR data along each acquisition track.
ately 1.6 million km2 . Using this large dataset, we can identify
In each track, after selecting one image as a reference, we core-
the subsidence hotspots across the country and analyze their
gister and resample all other images. The coregistration should
time series of displacement.
be performed accurately to prevent any jump between Sentinel-
Analyzing such a large SAR dataset using advanced time series 1 TOPS bursts (Yagüe-Martı́nez et al., 2016). After producing a
methods at the highest possible resolution needs a high compu- pool of resampled images, ready for interferogram generation,
tational resource. Such resources can be provided, for example, we split the processing chain into two main steps. During this
by cloud processing environments or High Performance Com- two steps, we first identify the subsidence zones using a limited
puting (HPC) systems. Despite that, our study aims at reducing amount of data, and then monitor them using the full archive of
the computational barrier and therefore, we implement a multi- data at highest possible resolution.
scale approach illustrated in Figure 2.
In the first step of our processing chain, we detect subsidence
In this approach, we implement a pre-processing followed by areas by analyzing the data at a large spatial extent but a me-
the identification and monitoring steps. In the pre-processing dium spatial resolution. To do so, we process each track of data
individually using Small Baseline Subset (SBAS) time series
analysis (Berardino et al., 2002). Here, we use a spatial resol-
ution of approximately 100 m which corresponds to interfero-
gram multi-looking of 25×5 in range and azimuth, respectively.
The tropospheric phase is removed from the interferograms us-
ing SRTM 3 arc-sec DEM (Farr and Kobrick, 2000). The at-
mospheric artifact is corrected using external data from Gen-
eric Atmospheric Correction Online Service for InSAR (GA-
COS) (Yu et al., 2018). The corrected interferograms are then
unwrapped in two dimensions in space. We use a coherence
threshold of 0.2 in 75% of the interferograms to drop pixels
with a low signal-to-noise ratio. For the pixels with higher co-
herence, we estimate the deformation rate and time series of
displacement. Using the average rate of displacement obtained
from SBAS analysis, we identify subsidence zones across the
country.
After detecting the subsidence zones, for each area of interest,
the data is down-scaled by cropping, and a precise time series
analysis is performed at the highest possible resolution as de-
scribed in (Hooper, 2008). In this way, a high-resolution sub-
sidence map and a precise time series of displacement are es-
Figure 1. Coverage of Sentinel-1 frames in descending path in timated for every specific area. Assuming the deformation is
Iran overlaid on a shaded-relief map. Small circles indicate ten mainly driven by land subsidence, we neglect the horizontal
most populous cities of the country. components of displacement and convert the line of sight de-
formation (ulos ) into vertical (uv ) by uv = ulos /cos(θ) where
This contribution has been peer-reviewed.
https://doi.org/10.5194/isprs-archives-XLIII-B3-2021-155-2021 | © Author(s) 2021. CC BY 4.0 License. 156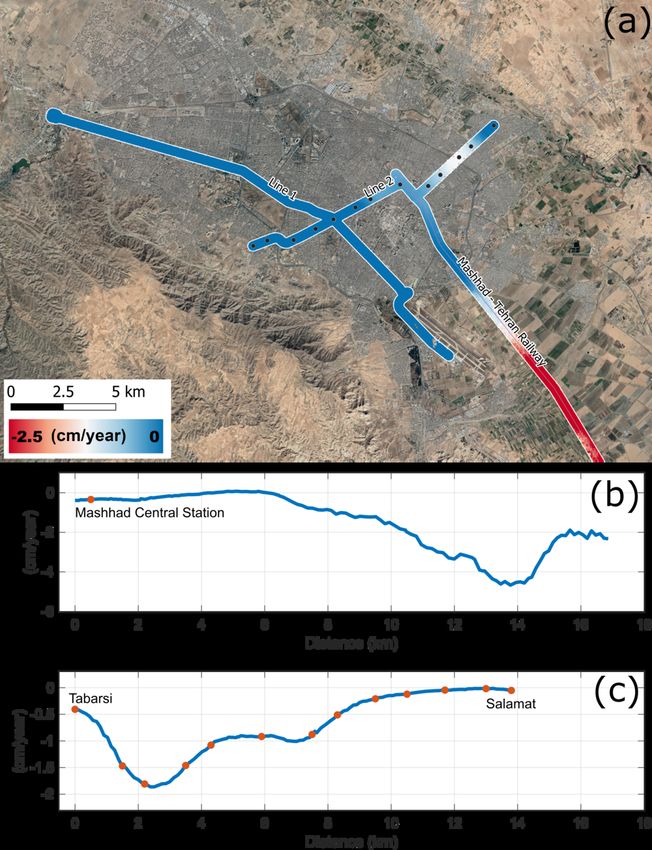
The International Archives of the Photogrammetry, Remote Sensing and Spatial Information Sciences, Volume XLIII-B3-2021
                                                 XXIV ISPRS Congress (2021 edition)

θ is the incidence angle of each pixel.

                        3. RESULTS

In this section, we discuss the results of the InSAR analysis of
land subsidence in Iran. First, we show the nationwide subsid-
ence map of Iran, using which we identify subsidence zones.
Then, we offer examples of high-resolution InSAR time series
analysis in two subsidence zones.

3.1   Nation-wide identification of subsidence zones

Figure 3 shows the linear rate of displacement across Iran estim-
ated from InSAR time series analysis of Sentinel-1 data down
scaled to 100×100 m. Except for two narrow bands in the north
and west of the country, where Alborz and Zagros mountain
ranges are located, and two desert areas in the country’s central
and eastern parts, land subsidence affects most of Iran’s pop-
ulated areas. We identified more than 100 subsidence zones          Figure 4. close up views of subsidence areas indicated by dashed
with subsidence rates greater than 2 cm/year across the coun-                               lines in Figure 3
try. In general, land subsidence in different regions is strongly
co-located with farming areas. It confirms that, to a large ex-
tent, pumping water for irrigation is responsible for groundwa-     irrigated area (Figure 4-b). Mashhad, the second most popu-
ter stress.                                                         lated city of Iran, is experiencing a subsidence rate larger than
                                                                    17 cm/year.
The subsidence map indicates that land subsidence is wide-
spread across the country, with several hotspots in different re-   The third hotspot of subsidence is in the northwest of Iran (Fig-
gions, four of which are illustrated in Figure 4. One of the most   ure 4-c). Several agricultural areas in this region show signs
prominent hotspots is located to the southern feet of the Alborz    of groundwater stress. In this area, Lake Urmia, once one of
mountains, where more than a quarter of the countries popula-       the largest salt lakes globally, has been shrinking in the past
tion lives. The maximum rate of subsidence in this area reaches     decades. Parlay because of lowering of groundwater and partly
approximately 30 cm/year to the west of Karaj. In the subsid-       because of damming the rivers that used to flow into the lake,
ence zone to the southwest of Tehran, the subsidence exceeds        shrinkage of the Lake Urmia is another indicator of water stress
16 cm/year.                                                         in the region (Nikraftar et al., 2021).

The second subsidence hotspot is located in the northeastern        The last hotspot of subsidence (Figure 4-d) is located in the
province of Khorasan-Razavi, which is second in the country’s       southeast of the country where Rafsanjan, Iran’s center of Pista-
                                                                    chio plantation, is located. Land subsidence in this area exceeds
                                                                    20 cm/year at several locations. In various regions near Rafsan-
                                                                    jan, signs of inelastic deformation, such as cracks and earth fis-
                                                                    sures, have been reported in recent years (Motagh et al., 2017).

                                                                    3.2   High-resolution analysis of subsidence in Tehran and
                                                                          Mashhad

                                                                    After identifying subsidence zones, we monitor them at the
                                                                    highest possible resolution to accurately estimate land sub-
                                                                    sidence’s spatial and temporal behavior at civil infrastructure.
                                                                    Here, we show examples of linear infrastructure affected by sur-
                                                                    face deformation in Tehran and Mashhad. We first analyze the
                                                                    InSAR time series for six years between 2014 and 2020. Then,
                                                                    we extract the results in a 250-m buffer distance around rail-
                                                                    ways and major roads and highways to analyze the subsidence
                                                                    affecting them.

                                                                    Figure 5-a illustrates the average subsidence rate affecting na-
                                                                    tional railways and commuter metro lines in Greater Tehran.
                                                                    Several sections of railways in Tehran are affected by land sub-
                                                                    sidence, namely the Maleki-Aprin section of the national rail-
                                                                    way with a subsidence rate higher than 15 cm/year and a section
 Figure 3. The linear rate of displacement across Iran obtained     of Tehran-Qom railway with approximately 12 cm/year of sub-
from Sentinel-1 time series analysis at a medium resolution of      sidence. Figure 5-b shows a profile of subsidence rate along
  100 m. The color scale is saturated between ±7 to highlight       Line 3, which is is the most severely affected metro line of
small subsidence areas. Four subsidence hot spots indicated by      Tehran. The subsidence rate increases towards the southwest
         dashed lines are shown in details in figure 4.             of this line and reaches approximately 7 cm/year at its peak at
                                                                    Azadegan station.

                                               This contribution has been peer-reviewed.
                https://doi.org/10.5194/isprs-archives-XLIII-B3-2021-155-2021 | © Author(s) 2021. CC BY 4.0 License.              157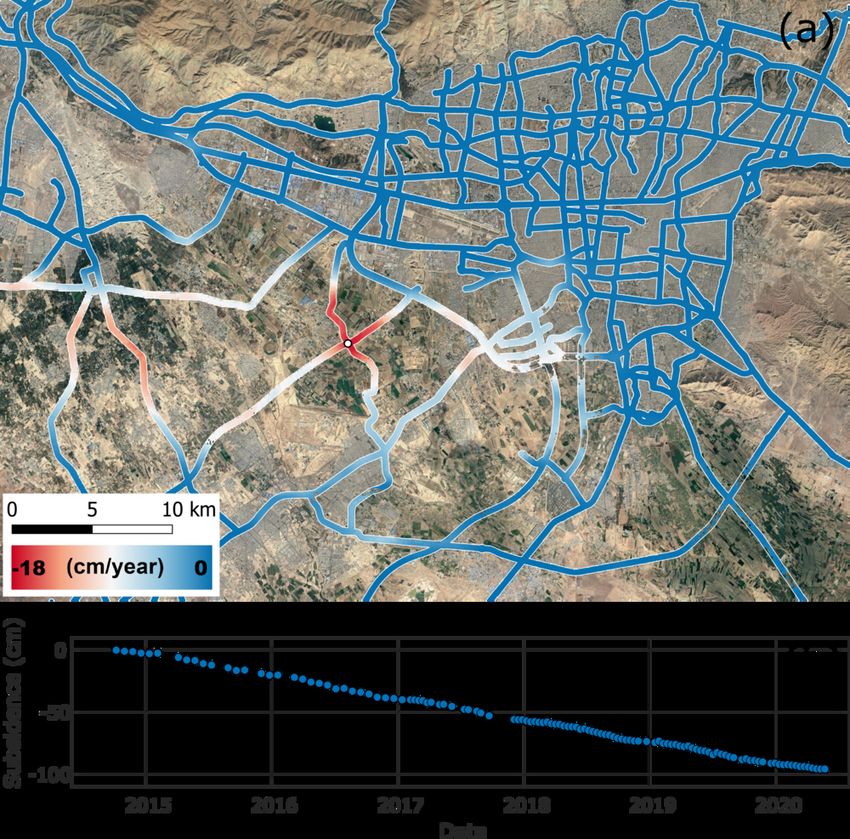
The International Archives of the Photogrammetry, Remote Sensing and Spatial Information Sciences, Volume XLIII-B3-2021
                                                XXIV ISPRS Congress (2021 edition)

                                                                     Figure 6. High-resolution analysis of subsidence for monitoring
                                                                      roads and highways in Tehran. (a) average rate of subsidence
                                                                     along major roads and highways. (b) Time series of subsidence
Figure 5. High-resolution analysis of subsidence for monitoring
                                                                       for a point, at the intersection of Tehran-Saveh freeway and
     railways and metro lines in Tehran. (a) average rate of
                                                                        Ahmadabad-Mostofi road, indicated by white circle in (a).
   subsidence along railways and metro lines. Black circles
                                                                     Background imagery for (a) Google Earth Landsat/Copernicus,
indicate stations along metro line 3. (b) profile of displacement
                                                                                               Map data ©2021
 rate along metro line 3 from Qaem station in the northeast to
   Azadegan station in the southwest. Circles indicate metro
       stations. Background imagery for (a) Google Earth             individual interferograms (Haghshenas Haghighi and Motagh,
              Landsat/Copernicus, Map data ©2021                     2017). Although we employ GACOS correction on the inter-
                                                                     ferograms, there are remaining of atmospheric phase delay vis-
Figure 6-a shows the subsidence rate along highways and major        ible in the average velocity. This effect is particularly evident
roads in Tehran. Several roads located in the agricultural area      between neighboring tracks of InSAR. Nevertheless, it is pos-
to the southwest of Tehran are affected by land subsidence. The      sible to identify localized subsidence zones in the velocity map.
highest rate (approximately 18 cm/year) is near the intersection     More advanced tropospheric correction methods can improve
of Tehran-Saveh freeway and Ahmadabad-Mostofi. Figure 6-             the identification of subsidence areas (Bekaert et al., 2015).
b illustrates an example time series of subsidence for a point
at this intersection. The time series indicates an ongoing long-     To validate our subsidence results, we compare our results with
term subsidence without significant change in the trend during       those of several subsidence areas identified by previous studies
the past six years.                                                  in different parts of Iran (Motagh et al., 2007, Dehghani et al.,
                                                                     2009, Motagh et al., 2008, Haghshenas Haghighi and Motagh,
Figure 7 exhibits the subsidence rate along railways and metro       2019, Babaee et al., 2020). The extent and magnitude of sub-
lines in Mashhad. Parts of the Mashhad-Tehran railway un-            sidence are to a high degree in agreement. This, on the one
dergo land subsidence as large as 5 cm/year. Figure 7-b shows        hand, confirms the quality of our results. On the other hand,
a profile along this railway. Mashhad Metro Line 2 is also af-       it indicates that, in different basins, groundwater remedial ac-
fected by land subsidence as significant as 2 cm/year. The dis-      tions either have not been implemented or were not successful
placement along this Metro Line is shown in figure 7-c.              in reducing the groundwater stress.
Figure 8 shows how freeways and major roads in Mashhad are           Our country-wide analysis of Sentinel-1 data allowed us to
affected by land subsidence. Several parts of the roads in the       identify more than 100 subsidence zones across Iran with sub-
agricultural area to the northwest of Mashhad are located in         sidence rates higher than 2 cm/year . This shows that land sub-
subsidence areas with a peak exceeding 15 cm/year. An ex-            sidence is a widespread problem across Iran. In general, subsid-
ample time series at the intersection of Mashhad-Quchan road         ence zones are highly correlated with agricultural areas where
and the northern beltway road is shown in figure 8-b. The time       a large portion of extracted groundwater is consumed, but it
series exhibits a clear declining trend during the past six years.   is not limited to farming lands. Many urban areas and infra-
                                                                     structure are also affected by land subsidence. For example,
          4. DISCUSSION AND CONCLUSION                               approximately 10% of Tehran’s urban area is undergoing land
                                                                     subsidence.
Using an enormous dataset of Sentinel-1, we performed a large-
scale InSAR analysis to quantify land subsidence areas across        To address groundwater sustainability, effective water manage-
Iran. One of the main challenges in large-scale InSAR is at-         ment is required (Vaux, 2011, Elshall et al., 2020). A nation-
mospheric phase delay that can reach several centimeters in          wide medium resolution (100 m) map of subsidence can help

                                                This contribution has been peer-reviewed.
                 https://doi.org/10.5194/isprs-archives-XLIII-B3-2021-155-2021 | © Author(s) 2021. CC BY 4.0 License.             158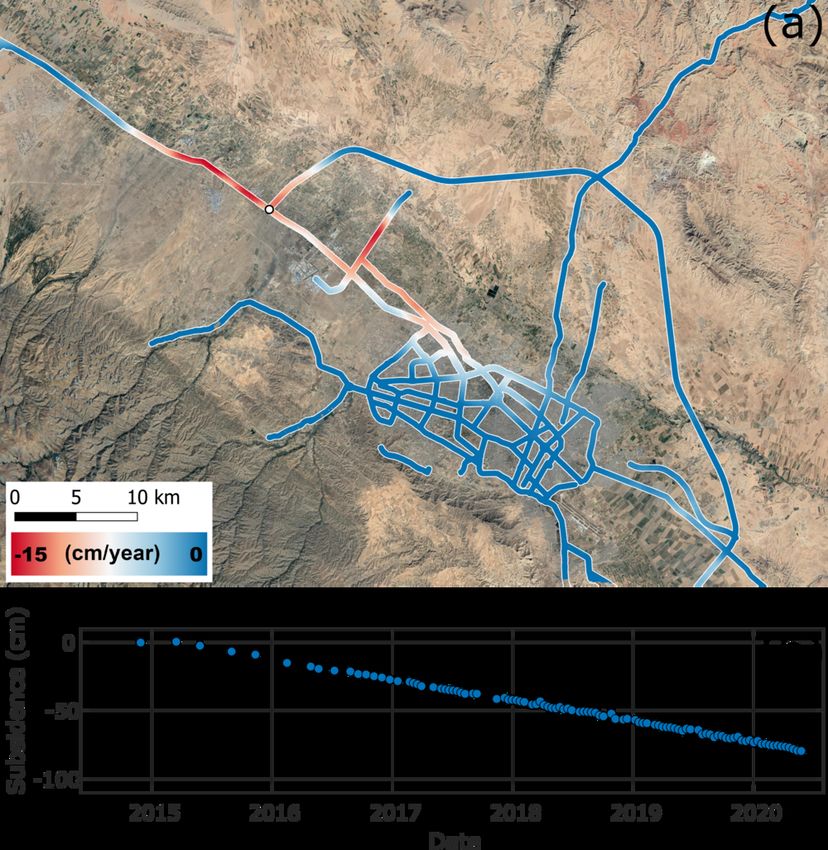
The International Archives of the Photogrammetry, Remote Sensing and Spatial Information Sciences, Volume XLIII-B3-2021
                                                XXIV ISPRS Congress (2021 edition)

                                                                    Figure 8. High-resolution analysis of subsidence for monitoring
                                                                    roads and highways in Mashhad. (a) average rate of subsidence
                                                                    along major roads and highways. (b) Time series of subsidence
                                                                    for a point, at the intersection of Mashhad northern freeway and
                                                                       Quchan road, indicated by white circle in (a). Background
                                                                      imagery for (a) Google Earth Landsat/Copernicus, Map data
Figure 7. High-resolution analysis of subsidence for monitoring                                    ©2021
    railways and metro lines in Mashhad. (a) average rate of
    subsidence along railways and metro lines. Black circles
indicate stations along metro line 2. (b) profile of displacement   A 6 to 12 day acquisition interval of new Sentinel-1 data al-
 rate along metro line 2 from Tabarsi station in the northeast to   lows near real-time monitoring of infrastructure. The results
Salamat station in the southwest. Circles indicate metro stations   also spot zones of infrastructural deformation that might need
      along this line. (c) profile of displacement rate along       to be further investigated. Such zones can be carefully mon-
Mashhad-Tehran Railway. The circle indicates Mashhad Central        itored by field equipment or high-resolution SAR sensors such
       Station. Background imagery for (a) Google Earth             as TerraSAR-X and COSMO-SkyMed.
              Landsat/Copernicus, Map data ©2021
                                                                                      ACKNOWLEDGEMENTS
decision-makers develop and implement such effective ground-
water policies (Madani, 2014, AghaKouchak et al., 2015, Na-         Original SAR data used in this study are Copernicus Sentinel
deri et al., 2021). A 20-year lifetime of Sentinel-1 will allow     data, processed by ESA. Parts of Map data in Figure 5-8 are
a frequent update of nationwide subsidence maps in the future,      copyrighted OpenStreetMap contributors and available from ht-
which can be used to verify whether current water management        tps://www.openstreetmap.org. Some maps were generated us-
strategies will have effectively reduced groundwater stress.        ing The Generic Mapping Tools (Wessel et al., 2019). Other
                                                                    maps were created using the Free and Open Source QGIS.
Our results show great potential for similar large-scale analysis
to be extended to other semi-arid and arid areas where water
resources are limited and groundwater depletion is a signific-                              REFERENCES
ant issue. Such products over extensive regions can provide
valuable information that can be of great interest to businesses,   AghaKouchak, A., Norouzi, H., Madani, K., Mirchi, A., Az-
decision-makers, and local communities.                             arderakhsh, M., Nazemi, A., Nasrollahi, N., Farahmand, A.,
                                                                    Mehran, A., Hasanzadeh, E., 2015. Aral Sea syndrome desic-
Land subsidence can pose a significant hazard to communities        cates Lake Urmia: Call for action. Journal of Great Lakes Re-
and civil infrastructure. For subsidence zones identified through   search, 41(1), 307-311.
a medium resolution subsidence mapping, we performed de-
tailed InSAR analysis. The analysis at the highest resolution       Alcamo, J., Döll, P., Henrichs, T., Kaspar, F., Lehner, B., Rösch,
allowed a detailed monitoring of infrastructure. Our study          T., Siebert, S., 2003. Development and testing of the WaterGAP
showed several parts of roads and railways in Tehran and Mash-      2 global model of water use and availability. Hydrological Sci-
had are subject to significant subsidence that might threaten       ences Journal, 48(3), 317-337.
their health in the near future.
                                                                    Alley, W. M., Clark, B. R., Ely, D. M., Faunt, C. C., 2018.
Such a detailed analysis of deformation is a practical tool for     Groundwater Development Stress: Global-Scale Indices Com-
monitoring and managing the health of the civil infrastructure.     pared to Regional Modeling. Groundwater, 56(2), 266-275.

                                               This contribution has been peer-reviewed.
                https://doi.org/10.5194/isprs-archives-XLIII-B3-2021-155-2021 | © Author(s) 2021. CC BY 4.0 License.                159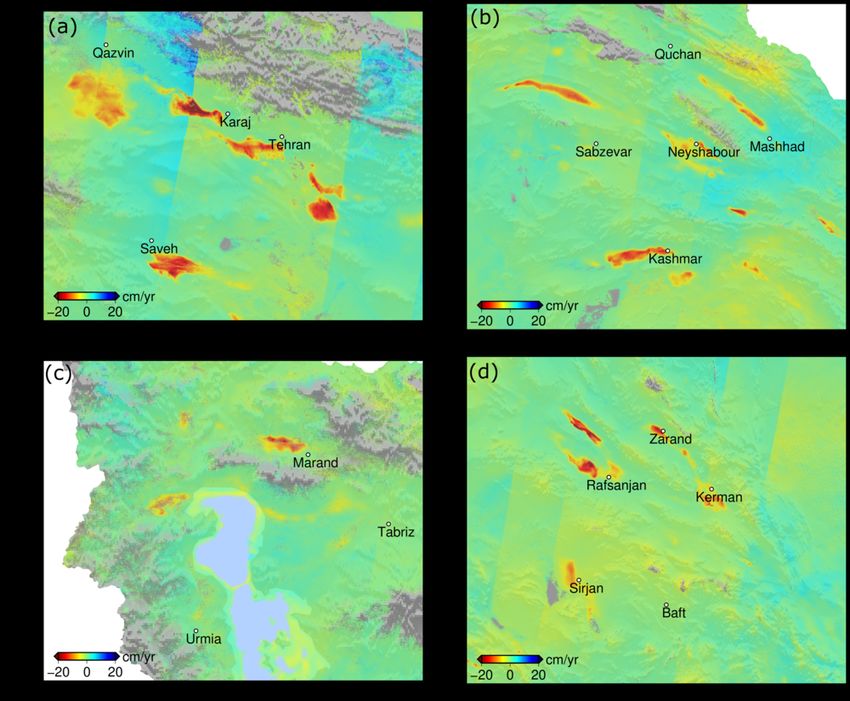
The International Archives of the Photogrammetry, Remote Sensing and Spatial Information Sciences, Volume XLIII-B3-2021
                                                XXIV ISPRS Congress (2021 edition)

Amelung, F., Galloway, D. L., Bell, J. W., Zebker, H. A.,           Galloway, D. L., Burbey, T. J., 2011. Regional land subsidence
Laczniak, R. J., 1999. Sensing the ups and downs of Las Ve-         accompanying groundwater extraction. Hydrogeology Journal,
gas: InSAR reveals structural control of land subsidence and        19(8), 1459–1486.
aquifer-system deformation. Geology, 27(6), 483-486.
                                                                    Haghshenas Haghighi, M., Motagh, M., 2017. Sentinel-1 In-
Ashraf, B., AghaKouchak, A., Alizadeh, A., Baygi, M. M.,            SAR over Germany: Large-scale interferometry, atmospheric
Moftakhari, H. R., Mirchi, A., Anjileli, H., Madani, K., 2017.      effects, and ground deformation mapping. ZfV: Zeitschrift für
Quantifying anthropogenic stress on groundwater resources.          Geodäsie, Geoinformation und Landmanagement, 2017(4),
Scientific reports, 7(1), 1–9.                                      245–256.

Babaee, S., Mousavi, Z., Masoumi, Z., Malekshah, A. H.,             Haghshenas Haghighi, M., Motagh, M., 2019. Ground surface
Roostaei, M., Aflaki, M., 2020. Land subsidence from inter-         response to continuous compaction of aquifer system in Tehran,
ferometric SAR and groundwater patterns in the Qazvin plain,        Iran: Results from a long-term multi-sensor InSAR analysis.
Iran. International Journal of Remote Sensing, 41(12), 4780-        Remote Sensing of Environment, 221, 534-550.
4798.
                                                                    Hooper, A., 2008. A multi-temporal InSAR method incorpor-
Bekaert, D., Walters, R., Wright, T., Hooper, A., Parker, D.,       ating both persistent scatterer and small baseline approaches.
2015. Statistical comparison of InSAR tropospheric correction       Geophysical Research Letters, 35(16).
techniques. Remote Sensing of Environment, 170, 40–47.
                                                                    Hooper, A., Segall, P., Zebker, H., 2007. Persistent scatterer
Berardino, P., Fornaro, G., Lanari, R., Sansosti, E., 2002. A new   interferometric synthetic aperture radar for crustal deforma-
algorithm for surface deformation monitoring based on small         tion analysis, with application to Volcán Alcedo, Galápagos.
baseline differential SAR interferograms. IEEE Transactions         Journal of Geophysical Research: Solid Earth, 112(B7).
on Geoscience and Remote Sensing, 40(11), 2375-2383.
                                                                    Madani, K., 2014. Water management in Iran: what is caus-
Castellazzi, P., Arroyo-Domı́nguez, N., Martel, R., Calderhead,     ing the looming crisis? Journal of environmental studies and
A. I., Normand, J. C., Gárfias, J., Rivera, A., 2016. Land sub-    sciences, 4(4), 315–328.
sidence in major cities of Central Mexico: Interpreting InSAR-
                                                                    Madani, K., AghaKouchak, A., Mirchi, A., 2016. Iran’s Socio-
derived land subsidence mapping with hydrogeological data.
                                                                    economic Drought: Challenges of a Water-Bankrupt Nation. Ir-
International Journal of Applied Earth Observation and Geoin-
                                                                    anian Studies, 49(6), 997-1016.
formation, 47, 102-111.
                                                                    Motagh, M., Djamour, Y., Walter, T. R., Wetzel, H.-U., Zschau,
Chaussard, E., Wdowinski, S., Cabral-Cano, E., Amelung, F.,         J., Arabi, S., 2007. Land subsidence in Mashhad Valley, north-
2014. Land subsidence in central Mexico detected by ALOS            east Iran: Results from InSAR, levelling and GPS. Geophysical
InSAR time-series. Remote Sensing of Environment, 140, 94-          Journal International, 168(2), 518-526.
106.
                                                                    Motagh, M., Shamshiri, R., Haghshenas Haghighi, M., Wet-
Cigna, F., Osmanoğlu, B., Cabral-Cano, E., Dixon, T. H., Ávila    zel, H.-U., Akbari, B., Nahavandchi, H., Roessner, S., Arabi,
Olivera, J. A., Garduño-Monroy, V. H., DeMets, C., Wdowin-         S., 2017. Quantifying groundwater exploitation induced sub-
ski, S., 2012. Monitoring land subsidence and its induced geo-      sidence in the Rafsanjan plain, southeastern Iran, using InSAR
logical hazard with Synthetic Aperture Radar Interferometry: A      time-series and in situ measurements. Engineering Geology,
case study in Morelia, Mexico. Remote Sensing of Environment,       218, 134-151.
117, 146-161. Remote Sensing of Urban Environments.
                                                                    Motagh, M., Walter, T. R., Sharifi, M. A., Fielding, E., Schenk,
Dalin, C., Wada, Y., Kastner, T., Puma, M. J., 2017. Ground-        A., Anderssohn, J., Zschau, J., 2008. Land subsidence in Iran
water depletion embedded in international food trade. Nature,       caused by widespread water reservoir overexploitation. Geo-
543(7647), 700–704.                                                 physical Research Letters, 35(16).
Dehghani, M., Valadan Zoej, M. J., Entezam, I., Mansourian,         Mousavi, S. M., Shamsai, A., Naggar, M. H. E., Khamehchian,
A., Saatchi, S., 2009. InSAR monitoring of progressive land         M., 2001. A GPS-based monitoring program of land subsidence
subsidence in Neyshabour, northeast Iran. Geophysical Journal       due to groundwater withdrawal in Iran. Canadian Journal of
International, 178(1), 47-56.                                       Civil Engineering, 28(3), 452-464.
Elshall, A. S., Arik, A. D., El-Kadi, A. I., Pierce, S., Ye,        Naderi, M. M., Mirchi, A., Bavani, A. R. M., Goharian, E.,
M., Burnett, K. M., Wada, C. A., Bremer, L. L., Chun, G.,           Madani, K., 2021. System dynamics simulation of regional wa-
2020. Groundwater sustainability: A review of the interactions      ter supply and demand using a food-energy-water nexus ap-
between science and policy. Environmental Research Letters,         proach: Application to Qazvin Plain, Iran. Journal of Envir-
15(9), 093004.                                                      onmental Management, 280, 111843.

Farr, T. G., Kobrick, M., 2000. Shuttle Radar Topography Mis-       Nikraftar, Z., Parizi, E., Hosseini, S. M., Ataie-Ashtiani, B.,
sion produces a wealth of data. Eos, Transactions American          2021. Lake Urmia restoration success story: A natural trend or
Geophysical Union, 81(48), 583–585.                                 a planned remedy? Journal of Great Lakes Research.

Ferretti, A., Fumagalli, A., Novali, F., Prati, C., Rocca, F.,      Richey, A. S., Thomas, B. F., Lo, M.-H., Reager, J. T., Famigli-
Rucci, A., 2011. A New Algorithm for Processing Interferomet-       etti, J. S., Voss, K., Swenson, S., Rodell, M., 2015. Quantifying
ric Data-Stacks: SqueeSAR. IEEE Transactions on Geoscience          renewable groundwater stress with GRACE. Water Resources
and Remote Sensing, 49(9), 3460-3470.                               Research, 51(7), 5217-5238.

                                               This contribution has been peer-reviewed.
                https://doi.org/10.5194/isprs-archives-XLIII-B3-2021-155-2021 | © Author(s) 2021. CC BY 4.0 License.             160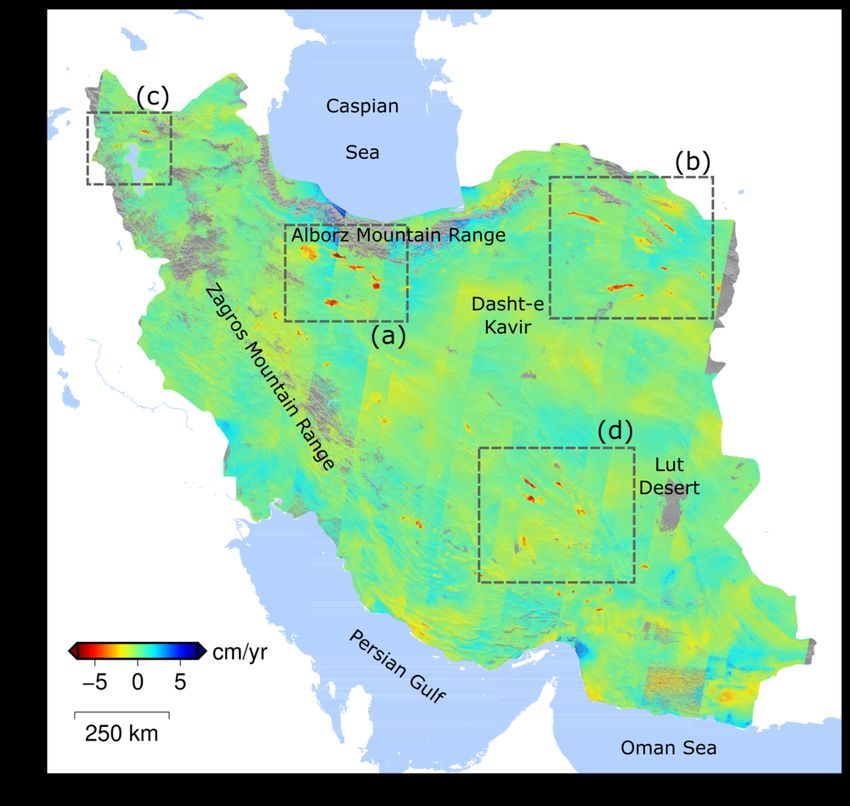
The International Archives of the Photogrammetry, Remote Sensing and Spatial Information Sciences, Volume XLIII-B3-2021
                                                XXIV ISPRS Congress (2021 edition)

Vaux, H., 2011. Groundwater under stress: the importance of
management. Environmental Earth Sciences, 62(1), 19–23.

Wada, Y., van Beek, L. P. H., Bierkens, M. F. P., 2011. Mod-
elling global water stress of the recent past: on the relative
importance of trends in water demand and climate variability.
Hydrology and Earth System Sciences, 15(12), 3785–3808.

Wang, G., Soler, T., 2015. Measuring Land Subsidence Using
GPS: Ellipsoid Height versus Orthometric Height. Journal of
Surveying Engineering, 141(2), 05014004.

Wessel, P., Luis, J. F., Uieda, L., Scharroo, R., Wobbe, F.,
Smith, W. H. F., Tian, D., 2019. The Generic Mapping Tools
Version 6. Geochemistry, Geophysics, Geosystems, 20(11),
5556-5564.

Yagüe-Martı́nez, N., Prats-Iraola, P., Rodrı́guez González, F.,
Brcic, R., Shau, R., Geudtner, D., Eineder, M., Bamler, R.,
2016. Interferometric Processing of Sentinel-1 TOPS Data.
IEEE Transactions on Geoscience and Remote Sensing, 54(4),
2220-2234.

Yu, C., Li, Z., Penna, N. T., Crippa, P., 2018. Generic Atmo-
spheric Correction Model for Interferometric Synthetic Aper-
ture Radar Observations. Journal of Geophysical Research:
Solid Earth, 123(10), 9202-9222.

                                               This contribution has been peer-reviewed.
                https://doi.org/10.5194/isprs-archives-XLIII-B3-2021-155-2021 | © Author(s) 2021. CC BY 4.0 License.           161
You can also read