Trace Detection of Diphenhydramine by Adsorption on a Microelectrode at Flow Injection System by Fast Fourier Transform Continuous Cyclic Voltammetry
←
→
Page content transcription
If your browser does not render page correctly, please read the page content below
CROATICA CHEMICA ACTA
                                                                                          CCACAA, ISSN 0011-1643, e-ISSN 1334-417X
                                                                                           Croat. Chem. Acta 83 (2) (2010) 135–142.
                                                                                                                         CCA-3403

                                                                                                               Original Scientific Article

 Trace Detection of Diphenhydramine by Adsorption on a Microelectrode
                     at Flow Injection System by Fast Fourier Transform
                                         Continuous Cyclic Voltammetry

                                 Parviz Norouzi,a,b* Mohammad Reza Ganjali, b,a Ezzattollah Nouryousefi,a
                                                    Seyed Jamaleddin Shahtaheri,c and Rassoul Dinarvandd
                         a
                        Center of Excellence in Electrochemistry, Faculty of Chemistry, University of Tehran, Tehran, Iran
                     b
                      Endocrinology & Metabolism Research Center, Tehran University of Medical Sciences, Tehran, Iran
c
 Dept. of Public Health, Center for Envir. Research, School of Public Health, Tehran Univ. of Medical Sciences, Tehran, Iran
                        d
                          Medicinal Nanotechnology Research Center, Tehran University of Medical Sciences, Tehran, Iran

                                                                  RECEIVED JUNE 24, 2008; REVISED AUGUST 8, 2009; ACCEPTED SEPTEMBER 10, 2009

                             Abstract. A continuous cyclic voltammetric study of diphenhydramine at gold micro electrode was carried
                             out. Some investigations were also done to find the effects of various parameters on the sensitivity of the
                             proposed method. The experiments were performed under the following conditions: pH = 2, the scan rate
                             = 40 V / s (v), accumulation potential = 500 mV (E), and accumulation time = 0.2 s (t). The drug in phos-
                             phate buffer (pH = 2.0) is adsorbed at optimized condition on the surface of electrode, giving rise to
                             change in the current of well-defined oxidation peak of gold in the flow injection system. The proposed
                             detection method is a very fast and appropriate technique for determination of the drug compound in a
                             wide variety of chromatographic analysis methods. Signal-to-noise ratio has significantly increased by
                             application of discrete Fast Fourier Transform (FFT) method, background subtraction and two-
                             dimensional integration of the electrode response over a selected potential range and time window.
                             The linear concentration range was from 4.0 × 10⁻⁷ to 1.0 × 10⁻¹¹ mol dm–3 (r = 0.9987) with a limit of
                             detection and quantitation 5 × 10–12 and 4 × 10–11 mol dm–3, respectively. The method has the requisite
                             accuracy, sensitivity, precision and selectivity to assay diphenhydramine in tablets.
                             Keywords: diphenhydramine, countinuous cyclic voltammetry, flow injection, fourier transformation

INTRODUCTION                                                         the most common subjective side effect. Wood and
                                                                     Garybiel demonstrated that D-amphetamine improves
Diphenhydramine, 2-(diphenylmethoxy)-N,N-dimethyl-                   tolerance to Coriolis stimulation of the vestibular sys-
amine, (Figure 1) is a conventional antihistaminic specie            tem. They found that the antihistamines produced an
in the H1 group (receptor antagonist) that can block                 increase in treatment effectiveness and reduced sedation
most anti-allergic, anti-emetic and anti-tussive drugs               when D-amphetamine was added. However, many anti-
found in many pharmaceutical preparations. Like other                motion-sickness drugs, alone or in combination are only
antihistaminic species, local anaesthetic activities have            partially effective, and their adverse effect cannot be
been observed. It is usually given orally in a preparation           ruled out. Therefore, it is highly desirable to look for a
of tablet, capsule or syrup. It may be administered by               drug that is effective for prevention of motion sickness
intramuscular or intravenous injections in severe aller-             and which is relatively free of side effect.2
gies and applied topically for local allergic reactions in
preparations of lotion and cream.1 Various anti-motion-
sickness medications, which many of them are available
over the counter, are commonly used to ameliorate
motion sickness. Many antihistamines dimenhydrinate,
meclizine and promethazine have been effective anti-
motion-sickness drugs, however, these drugs are antihis-
tamine-H1 receptor antagonists that cause sedation as                         Figure 1. The structure of diphenhydramine.

*   Author to whom correspondence should be addressed. (E-mail: norouzi@khayam.ut.ac.ir)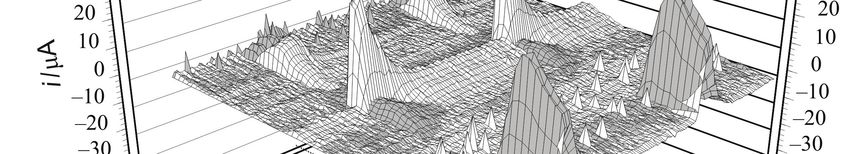
136 P. Norouzi et al., Trace Detection of Diphenhydramine by Adsorption on a Microelectrode
Several methods have been proposed for determin- Standards and Sample Solutions
ing diphenhydramine in pharmaceutical preparations
Standard stock solutions
including titrimetry, fluoremetry electrochemical analy-
A standard stock solution of diphenhydramine (mass
sis and spectrophotometry, which a batch-wise has
concentration, γ = 1 mg / ml) was prepared in the distilled
been applied.1–4 Chromatographic methods have been
water. This solution was protected from light using foil
used such as gas chromatography5 and HPLC,6 and the
and stored at 4 °C and it is to be stable during this period.
necessity to ensure the quality of pharmaceutical poly-
drugs like diphenhydramine and consequently the safety Standard solutions for FIA
and efficacy of the final marketed product, has led to the Aliquots of standard stock solution of diphenhydramine
development and evaluation of new techniques that were dispensed into 10 mL volumetric flasks and the flasks
reduce the time and cost of analysis such as capillary made up to volume with the running buffer to give final
electrophoresis.7–9 concentrations range of 4.0 × 10⁻⁷ to 1.0 × 10⁻¹¹ mol dm–3.
Some of techniques described above are not sim-
ple for direct application a large scale routine analysis Sample Preparation of Human Urine and Plasma
and require expensive instruments. As far as voltamme-
Plasma was obtained from Tehran University Hospital,
tric techniques are considered, they are generally rapid
Tehran, Iran and kept frozen until use after gentle thaw-
and economical in the determination of some organic
ing. Urine was also collected from healthy volunteers
and inorganic compounds in aqueous system with a
(males, around 30 years old).
sensitivity range of part-per-billion. Indeed, because of
One mL of untreated urine containing 10 g / mL
the selective detector, voltammetric techniques are use-
diphenhydramine was placed into a 50 mL volumetric
ful for the samples. The use of voltammetric techniques
flask and diluted with water to the mark. A 1 mL of this
have been further stimulated by the advent of UMEs,
solution was diluted with pH = 2 buffer solution to
due to their steady state currents, higher sensitivity,
20 mL into a volumetric flask. Then 20 μL aliquot was
increased mass transport and their ability to be used in
injected into the FIA system.
electroanalysis in solution with high resistance.10
For the determination of diphenhydramine in plas-
UMEs, for instance, have been applied as sensors in
ma, 100 µL aqueous diphenhydramine solutions (100
various techniques such as flow injection analysis,11,12
ng / mL) were added to 1 mL of untreated plasma. The
cardiovascular monitoring and organic compound anal-
mixture was vortexes for 30 s. In order to precipitate the
ysis.13,14 Now, our work describes a new electrochemical
plasma proteins, the plasma samples were treated with
method based on FIA and FFT Cyclic voltammetry for
20 µL perchloric acid HClO4 20 %. After that, the mix-
determination of diphenhydramine.
ture was whirled for a further 30 s and then centrifuged
at 6000 rpm for 5 min. Then 20 μL aliquot of the ob-
EXPERIMENTAL tained supernatant was injected into the FIA system.
Reagents and Materials Electrode Preparation
Double-distilled deionized water was used for prepara- Gold UMEs (with a 25μm in diameter) were prepared as
tion of samples by using analytical grade reagents described in previous papers15–20 Before each experi-
(Merck Chemicals). The reagents used for preparation ment the electrode surface was polished for 1 minute
of the running buffer or background electrolyte (BGE) using extra fine carborundum paper and then for 10
solution for flow-injection analysis (0.05 M H3PO4 and minutes with 0.3 µm alumina. Prior to being placed
1 M NaOH used for adjusting pH of the eluent), were in the cell the electrode was washed with water. In all
obtained from Merck Chemicals. Diphenhydramine measurements, an Ag(s) |AgCl(s) |KCl(aq, 1 mol dm–3)
standard powder was a gift from the Center of Quality reference electrode was used. The auxiliary electrode was
Control (Tehran, Iran). In all experiments, solutions made of a Pt wire, 1 cm length and 0.5 mm in diameter.
were made up in the background electrolyte solution,
and were used without removal of dissolved oxygen. Flow Injection Setup
The equipment for flow injection analysis included a 10
Background Electrolyte
roller peristaltic pump (UltrateckLabs Co., Iran) and a
The background electrolyte was made by addition of four way injection valve (Supelco Rheodyne Model
8.7 mL of phosphoric acid (85 % w/v) into a 1000 ml 5020) with a 50 L sample injection loop. Solutions
volumetric flask and dilution to a constant volume with were introduced into the sample loop by means of a
distilled water. The pH was adjusted to 2 with sodium plastic syringe. The volume of the cell was 100 µL. In
hydroxide. All solutions were freshly prepared and filtered all experiments described in this paper, the flow rate (u)
using a Millipore filter (0.45 µm) each day. of eluent solution was 2 mL / min.
Croat. Chem. Acta 83 (2010) 135.
P. Norouzi et al., Trace Detection of Diphenhydramine by Adsorption on a Microelectrode 137
Data Acquisition and Processing
All of the electrochemical experiments were done using
a setup comprised of a PC PIV Pentium 900 MHz mi-
crocomputer, equipped with a data acquisition board
(PCL-818HG, Advantech. Co.), and a custom made
potentiostat. All data acquisition and data processing
programs were developed in Delphi 6® program envi-
ronment.
RESULTS AND DISCUSSION
In Figure 2 the diagram of applied waveform potential
during cyclic voltammetric measurements is shown. The Figure 2. The diagram of the applied potential waveform.
potential waveform consists of three parts; a) Potential
steps, Ec1 and Ec2 (which are used for oxidizing and
reduction of the electrode surface, respectively), by potential waveform,13 therefore various potential wave-
which electrochemical cleaning of the electrode surface forms were examined in order to obtain a reproducible
takes place, b) Ec, where accumulation of analyte takes electrode surface (or a stable background signal). In
place, c) the final, part potential ramp, in which current fact, application of cyclic voltammetry for determina-
measurements take place. tion of electroactive compound mainly face to low sta-
Signal Calculation in this method is established bility of the background signal, due to changes occur-
based on the integration of net current changes over the ring in the surface crystal structure during oxidation,
scanned potential range. It must be noted that in this and reduction of the electrode in each potential cycle. In
case, the current changes (result of injected analyte) at this work, after examination of various potential wave
the voltammograms can be caused by various processes, forms, the best potential waveform for obtains a stable
which take place at the electrode surface. Those background during the measurement was the waveform
processes include; a) oxidation and reduction of ad- shown in Figure 2. As mentioned above, in this work,
sorbed analyte, and b) inhibition of oxidation and reduc- the potential waveform was continuously applied during
tion of the electrode surface by the adsorbed analyte. an experiment run where the collected data were filtered
Indeed, in order to see the influence of the adsorbed by FFT method before using them in the signal calcula-
analyte on the oxidation and reductions peaks of the tion.
gold surface, the scan rate must be set at very high rates The electrochemical oxidation process of gold sur-
(e.g. v > 20 V / s). face started with electrosorption of hydroxyl ion, which
However, during the scan, some of the adsorbed at more positive potentials form gold oxide and under-
analyte molecules are desorbed. Depending on the rate goes structural rearrangement,20 The surface oxidation
of those processes and scan rate, the amount of the de- can be initiated by adsorption of water molecule and
sorption analyte molecule (during the scan) can be then at more positive potential AuOH forms leading to
changed.21–29 The important point here is that part of the the formation of a two-dimensional phase of gold oxide;
adsorbed analyte molecule still remaining on the elec-
trode surface that can inhibit the red/ox process of the 2Au + 3H2O Au2O3 + 6e– + 6H+ (1)
electrode surface. In this method, ∆Q is calculated based
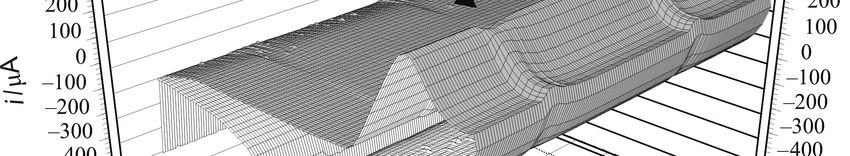
on the all current changes at the CVs. However, the An example of recorded CVs is shown in Figure 3 (a,
selectivity and sensitivity of the analyte response ex- b). Figure 3a shows a sequence of CVs recorded during
pressed in terms of ∆Q strongly depends on the selec- the flow analysis for determination of the drug. The
tion of the integration limits. One of the important as- volume of the injection was 50 µL of 5.0 × 10⁻⁵ M di-
pects of this method is application of a special digital phenhydramine (in 0.05 M H3PO4) into the eluent solu-
filtration, which is applied during the measurement. In tion containing 0.05 M H3PO4. The time axis of the
this method at the first, a CV of the electrode was rec- graph represents the time of the flow injection experi-
orded and then by applying FFT on the collected data, ment. In the absence of diphenhydramine, the shape of
the existing high frequency noises were indicated. Final- the CV curves is typical for a polycrystalline gold elec-
ly, by using this information, the cutoff frequency of the trode in acidic media.21 Figure 3b shows the absolute
analog filter was set at a certain value (where the noises current changes in the CVs curves after subtracting the
were removed from the CV). average background 4 CVs (in absent of the analyte). As
Since the crystal structure of a polycrystalline gold can be seen, this way of presentation of the electrode
electrode, strongly depends on the condition of applied response gives more details about the effect of adsorbed
Croat. Chem. Acta 83 (2010) 135.
138 P. Norouzi et al., Trace Detection of Diphenhydramine by Adsorption on a Microelectrode
tains hetroatoms such as S or N it thermodynamicly is
more suitable for stronger adsorption because these
atoms have better interaction with gold electrode orbit-
als. Furthermore this system the adsorption and desorp-
tion have a frequency which make the kinetic of pheno-
mena. So if the component has a vary fast adsorp-
tion/desorption the system is not able to detect it. The
free energy and the rate of adsorption depend on the
electrode potential, the electrode material, and to some
extent, on the choice of the concentration and type of
supporting electrolyte. By taking points into considera-
tion, in order to achieve maximum performance of the
detector, the effect of experimental parameters (such as;
pH of the supporting electrolyte, potential and time of
(a)
the accumulation and potential scan rate) must be ex-
amined and optimize.20–29
Optimizing the experimental parameters
The effect of eluent pH on performance of the detector
was examined the results are shown in Table 1. As
shown, the best Q was obtained with pH between
2 and 3. In addition, the results shows that at pH values
higher than 9 noises level in the baseline (∆Q vs. t), is
higher up to 12 % compared to acidic solution.
Also, in order to investigate the influence of scan
rates and the eluent flow rate on the sensitivity of the
detector response, solutions having a diphenhydramine
concentration of 2.0 × 10⁻⁷ mol dm–3 were injected. At
(b) different scan rates (from 10 to 60 V/s) and the eluent
flow, the responses of the detector to the injected sam-
ple were recorded. The results are presented in Figure 4.
Figure 3. (a) Cyclic voltammograms at Au ultra-microelec- As it is clear from the Figure 4, the detector exhibits the
trode recorded during the flow injection of 50 μL of 5.0 × 10⁻⁵
M of diphenhydramine at optimum conditions. The eluent was Table 1. pH effect on the microelectrode response
0.05 M H3PO4 and the flow rate was 2 mL / min. (b) Curves
result from subtracting an average CV (in the absence of pH 2.1 4 6 8 10 12
analyte) from test of the CVs in (a). ΔQ / μC 350 300 200 195 190 180
400
ion on currents of the CV. The curves show that current 400
350
changes mainly take place at the potential regions of the 300
oxidation and reduction of gold. When the electrode- 300
solution interface is exposed to diphenhydramine, which
Q / C
200
250
can adsorbed on the electrode, the oxide formation 200
Q / C
100
process becomes strongly inhibited. In fact, the inhibi-
150
tion of the surface process causes significant change in 0
0 1 2 3 4 5 6
the currents at the potential region, and as a conse- 100
u / ml min–1
quence the profound changes in the shape of CVs take 50
place. Universality of the detector in this mode is very 0
advantageous for chromatographic analysis, where a –-50
mixture of compounds presents in sample. 0 20 40 60 80 100 120
It must be noted that, theoretically, in this method, v / V s–1
the analyte response can be affected by the thermody- Figure 4. Effect of the sweep rate, v, on the response of the
namic and kinetic parameters of adsorption, the rate of Au microelectrode to injections of 2.0 × 10⁻⁷ M diphenhydra-
mass transport and other means if the component con- mine in 0.05 M H3PO4.
Croat. Chem. Acta 83 (2010) 135.P. Norouzi et al., Trace Detection of Diphenhydramine by Adsorption on a Microelectrode 139
maximum sensitivity at 40 V / s of scan rate and 2 mL / min ranges, E from – 400 to 900 mV and accumulation time
of the flow rate. The effects of the sweep rate on the de- range, t, from 0.1 to 1.0 s. Based the figure accumula-
tection performance can be taken into consideration from tion potential 500 mV at time 200 ms was chosen as the
three different aspects: first, speed in data acquisition, optimum condition. Because, the surface of the elec-
second, kinetic factors of adsorption of the diphenhydra- trode becomes saturated with the diphenhydramine
mine, and finally the flow rate of the eluent which controls within 200 s time window
the time window of the solution zone in the detector. On the electrode, the accumulation of diphenhy-
The main reason for application of high scan rates, is dramine takes place during the accumulation step (as-
prevention from desorption of the adsorbed diphenhydra- suming that an appropriate potential is selected). In fact,
mine during the potential scanning, (because under this the difference in the time of saturation of the various
condition, the inhibition outcome of the adsorbed diphen- compounds can be related to the existing differences in
hydramine on the oxidation process can take place. their kinetics of the electron transfer and mass transport.
Indeed, the use of this detection method in con- As mentioned above, the surface of the gold microelec-
junction with fast separation techniques such as capil- trode is very small, and in a very short time the surface
lary electrophoresis also requires the employment of of the electrode can be saturated.
high scan rates. From this point of view, checking how
the sensitivity of the method is affected by the sweep Validation
rate is necessary. To detect the amount of the adsorbed
The investigation of validity was performed with respect
analyte on the electrode surface, high sweep rates must
of linearity, limit of detection (LOD), precision, accuracy,
be employed, so that the potential scanning step is short
ruggedness/robustness, recovery and selectivity.30–32
in comparison with the accumulation period. Notably,
when the accumulation of diphenhydramine occurs at a
Linearity
potential very larger or smaller than Ei, more better
sensivity (low detection limit) will be obtained. Howev- Linear regression analysis of least square method was
er, sensitivity of the detection system mainly depends used to evaluate the linearity.33,34 The linear range of
on the potential sweep rate mainly due to kinetic factors 0.4–0.00001 mol dm–3 was conspicuous in constructed
in adsorption, and instrumental limitations. calibration curve. Peak areas of diphenhydramine were
Due to this fact that any changes in the parameters plotted versus its concentration and linear regression
related to adsorption process shows a strong dependence analysis performed on the resultant curve. A correlation
upon the applied potential and the time and the potential coefficient of R = 0.9987 with RSD values ranging from
of accumulation strongly affect the sensitivity of the 0.14 to 3.65 % across the concentration range stu-died
measurement. Therefore, the influence of the accumula- were obtained following linear regression analysis.
tion potential and time on the response of the method Typically, the regression equation for the calibration
for the injection of a 2.0 × 10⁻⁷ M solution of diphenhy- curve was found to be y = 0.7875 x + 188.19. Figure 6
dramine, in 0.05 M H3PO4, was studied. Figure 5 shows shows the calibration graph that obtained for the moni-
the detector response over the accumulation potential toring of diphenhydramine in a 0.05 M H3PO4.
360 700
340
600
320
500
300 400 600
Q / C
Q / C
350
280 400 500
300
Q / C
Q / C
250 400
260 200
300 300
150 y =y 0.7875 x ++ 188.19
= 0,7875x 188,19
240 200 R2R²==0.9978
0,9978
100
(b)
50 200 100
220 00 0.2 0.4 0.6 0.8 11
(a) 0,2 0,4
t/s
0,6 0,8 0 100 200 300
10 9 C / mol dm–3
400 500
200 100
–-1000 –-500 0 500 1000 1500 2000 2500 3000 3500 4000 0 1000 2000 3000 4000 5000 6000
E / mV 109 C / mol dm–3
Figure 5. Effect of accumulation potential (a) and the effect of Figure 6. Calibration curves obtained for diphenhydramine on
accumulation time (b) on the electrode response to injections the Au microelectrode in 0.05 M H3PO4.
of 2.0 × 10⁻⁷ M diphenhydramine in 0.05 M H3PO4.
Croat. Chem. Acta 83 (2010) 135.140 P. Norouzi et al., Trace Detection of Diphenhydramine by Adsorption on a Microelectrode
Table 2. Influence of the changes in the experimental condi- centrations for 3 consecutive days, resulting in mean
tions on the performance of the FIA system diphenhydramine concentrations of 0.2, 0.005 and
0.0006 mol dm–3 with associated RSD. values of 0.6,
Diphenhydramine 0.7 and 0.9 %, respectively.
Parameter Modification recovery
(expressed in %)
Accuracy
pH 1.8 100.3 Interpolating of replicate (n = 6) peak areas of three
2.0 101.1 accuracy standards (0.2, 0.005 and 0.0005 mol dm–3),
2.3 99.9 the accuracy of the method was assessed by a calibration
curve prepared as previously described. In each case, the
3.0 99.8
percent relevant error and accuracy was calculated. The
flow rate, resultant concentrations were 0.2 ± 0.01, 0.005 ± 0.0001
1.8 100.6
u / ml min–1 and 0.0006 ± 0.00003mol dm–3 with relevant error per-
2.0 101.3 centage of 0.6, 0.9 and 0.85 %, respectively.
2.2 99.9
Ruggedness
buffer 0.04 97.9
composition, Comparing of the intra- and inter- day assay results for
Cb.c. / mol dm–3 0.05 101.6 tow diphenhydramine analytes was used to check the
0.06 100.4 ruggedness of the method. The RSD values for intra-
and inter- day assays of diphenhydramine in the cited
θlab. / ºC 20 101.3 formulations performed in the same laboratory by the
25 99.9 two analysts did not exceed 3.5 %, this way the rugged-
ness of the method is illustrated. The robustness was
30 100.8
also examined while the parameters values (the pH of
the eluent, the flow rate, the buffer composition and the
laboratory temperature) were being slightly changed.35
Table 3. Application of the proposed method to the determi- According to Table 2, the diphenhydramine recovery
nation of diphenhydramine in spiked human plasma and urine percentages were satisfactory in most cases, without
presenting any important changes during the alteration
γdiph./ ng mL–1 γdiph./ ng mL–1 RSD RE of the critical parameters.
(added) (interpolated) (in %) (in %)
10 (plasma) 9.89 ± 0.2 1.5 1.02 Recovery
100 (urine) 101.1 ± 0.5 1.0 1.4 In order to perform the recovery test, diphenhydramine
Data obtained from five replicates at each concentration. standard powder at concentration of 1.0 × 10⁻⁸ mol dm–3
Interpolated concentration data expressed as mean ± SD. was added to samples of known amounts at 0.2, 0.005 and
0.0005 mol dm–3 and then the voltammograms were
recorded. The assay was repeated (n = 9) over 3 consecu-
Limit of Detection tive days to obtain intermediate precision data. The resul-
tant RSD for this study was found to be 0.9 % with a cor-
The lowest amount of the analyte that may be detected to
responding percentage recovery value of 99.95 %.
produce a response is defined as LOD. Based on the
calculation of standard deviation of the response (δ) and
Selectivity
the slope (S) of the calibration curve at the levels ap-
proaching the limits according to equation LOD = 3.3 Standard solutions of diphenhydramine, was exploited
(δ /S),35 the limit of detection that found to be 0.005 to determine the sensitivity of the method in the pres-
nmol dm–3, was approved. ence of formulation components. As expected, the res-
ponses were not different from that obtained in the cali-
Precision bration. We found that the formulation compounds have
no interference to the determination of diphenhydramine
Precision was investigated by injecting nine replicate
due to the well fixed optimized parameters.
samples of each of the 0.2, 0.005 and 0.0005 mol dm–3
standards. The final mean concentrations were found to
Determination of Diphenhydramine in Real Samples
be 0.19, 0.006 and 0.000 mol dm–3 with associated
RSDs of 0.05, 0.2 and 1.0 %, respectively. The inter-day The voltamograms were recorded according to the above
precision was assessed by injecting the same three con- recommended procedure. The voltamograms of samples
Croat. Chem. Acta 83 (2010) 135.P. Norouzi et al., Trace Detection of Diphenhydramine by Adsorption on a Microelectrode 141
Table 4. Influence of the changes in the experimental conditions on the performance of the FIA system
Method LOD Ref. No.
Native fluorescence flow-through optosensor in Phamaceuticals 0.02 mg / ml 1
LC-MS/MS 1 ng / ml 2
Flow injection spectrophotometriy 75 mg / ml 3
spectrophotometriy 0.03 mg / ml 4
GC 0.4 mg / ml 5
Atomic emission spectrometric based on formation of ion-associates with
2.7 mg / ml 6
ammonium reineckate
Capillary electrophoresis 2.5 mg / ml 7
Indirect Atomic Absorption based on formation of ion-associates with
5.6 mg / ml 36
Potassium tetraiodometrcurate
Nonaqueous Capillary electrophoresis 0.6 mg / ml 37
FFTCV 1.0 pg / ml This work
without diphenhydramine do not show any signal that can 9. S. F. Y. Li, Capillary Electrophoresis, Principles Practice and
interfere with the direct determination, so external calibra- Applications, Elsevier, Amsterdam, 1992.
10. R. M. Wightman and D. O. Wipf In: A. J. Bard, (Ed.), Electroa-
tion can be used. The result has been shown in Table 3. nalytical Chemistry vol. 15, Marcel Dekker, New York, 1989.
The major advantage of the method as applied to plasma 11. M. Paeschke, F. Dietrich, A. Ulig, and R. Hintsche, Electroana-
and urine is that no prior extraction step is required. lysis 8 (1996) 891–898.
12. T. Dimitrakopoulos, P. W. Alexander, and D. B. Hibbert, Elec-
Comparison of the Method's Sensitivity and Other troanalysis 8 (1996) 438–442.
13. V. Cosofret, M. Erdosy, T. A. Johnson, R. P. Buck, R. B. Ash,
Previously Reported Methods
and M. R. Neuman, Anal. Chem. 67 (1995) 1647–1651.
The detection limit of the proposed method is compared 14. R. Hintsche, M. Paeschke, U. Wollenberger, U. Schnakenberg,
B. Wagner, and T. Lisec, Biosens. Bioelectron. 9 (1994) 697–
with the other reported methods. The results are shown
705; 9 (1995) 1647–1654.
in Table 4. In comparison to other reported methods, the 15. P. Norouzi, M. R. Ganjali, and P. Matloobi, Electrochem. Com-
sensitivity of this method is considerably more than mun. 7 (2005) 333–338.
previously reported methods. As can be seen in Table 4, 16. P. Norouzi, G. R. Nabi Bidhendi, M. R. Ganjali, A. Sepehri, and
the detection limit of the method is 1000 times lower M. Ghorbani, Microchim. Acta 152 (2005) 123–129.
than the most sensitive reported method.1–7,36,37 17. M. R. Ganjali, P. Norouzi, M. Ghorbani, and A. Sepehri, Talanta
66 (2005) 1225–1233.
Acknowledgment. The authors express their appreciation to the 18. P. Norouzi, M. R. Ganjali, M. Ghorbani, and A. Sepehri, Sens.
Research Council of the University of Tehran for the financial Actuators B 110 (2005) 239–243.
19. P. Norouzi, M. R. Ganjali, T. Alizadeh, and P. Daneshgar, Elec-
support of this work.
troanalysis 18 (2006) 947–958.
20. J. Lipkowski, and L. Stolberg. Adsorption of Molecules at Metal
REFERENCES Electrodes, publication in VCH, New York, 1992, 171.
21. J. O. M. Bockris, B. E. Conway, and E. Yeager, Comprehensive Trea-
1. I. P. Reguera and M. G. Rubio, Anal. Sci. 25 (2004) 799–803. tise of Electrochemistry, Plenum, New York and London, 1980, 135.
2. C. Wang, G. Fan, M. Lin, Y. Chen, W. Zhao, and Y. Wu, 22. P. Norouzi, M. R. Ganjali, S. Shirvani-Arani, and A. Mohamma-
J. Chromatogr. B 854 (2007) 48–56. di, J. Pharm. Sci. 96 (2007) 893–904.
3. P. Tipparat and S. Lapanantnoppakhun, J. Pharma. Biomed. 23. P. Norouzi, S. Shirvani-Arani, P. Daneshgar, and M. R. Ganjali,
Anal. 30 (2002) 105–112. Biosens. Bioelectron. 22 (2006) 1068–1074.
4. W. S. Hassan, M. M. El-Henawee, and A. A. Gouda, J. Spectro- 24. P. Norouzi, M. R. Ganjali, and A. A. Moosavi-Movahedi, J. Bra-
chim. Acta part A 69 (2008) 245. zil. Chem. Soc. 18 (2006) 231–238.
5. S. S. Rai, S. U. Kapdia, and A. P. Argekar, Talanta 46 (1998) 25. P. Norouzi, M. R. Ganjali, P. Daneshgar and A. Mohammadi,
221–225. Anal. Lett. 40 (2007) 547–559.
6. C. Barbas, A. Garsia, L. Saavedra, and M. Castro, J. Chroma- 26. P. Norouzi, M. R. Ganjali, and P. Daneshgar, J. Pharmacol. Tox-
togr., A 870 (2000) 97–103. icol. Methods 55 (2007) 289–296.
7. M. R. Gomez and R. A. Olsina, J. Pharma. Biomed. Anal. 30 27. P. Norouzi, M. R. Ganjali, P. Daneshgar, T. Alizadeh, and A.
(2002) 791–799. Mohammadi, Anal. Biochem. 360 (2007) 175–181.
8. Y. Dong ,X. Chen , Y. Chen, X. Chen, and Z. Hu, J. Pharma. 28. P. Norouzi, M. R. Ganjali, and P. Daneshgar, Sens. Actuators B
Biomed. Anal. 39 (2005) 285–289. 123 (2007) 125–132.
Croat. Chem. Acta 83 (2010) 135.142 P. Norouzi et al., Trace Detection of Diphenhydramine by Adsorption on a Microelectrode
29. P. Norouzi, M. R. Ganjali, P. Daneshgar, P. Dinarvand, A. A. 33. J. C. Miller, and J. N. Miller, Statistics for Analytical Chemistry,
Moosavi-Movahedi, and A. A. Saboury, Anal. Chim. Acta. 590 Ellis Horwood, Chichester, 22 (1984) 82–86.
(2007) 74–80. 34. Z. Al-Kurdi, T. Al-Jallad, A. Badwanamd, and A. M. Y. Jaber,
30. A. Mohammadi, I. Kanfer, V. Sewram, and R. B. Walker, Talanta 50 (1999) 1089–1097.
J. Chromatogr. B 824 (2005) 148–152. 35. International Conference on Harmonization (ICH) Topic Q2 B:
31. A. Mohammadi, N. Rezanour, M. Ansari Dogaheh, F. Ghorbani Validation of Analytical Procedures: Methodology, the European
Bidkorbeh, M. Hashem, and R. B. Walker, J. Chromatogr. B Agency for the Evaluation of Medicinal Products, Geneva, 1996.
1116 (2006) 153–157. 36. M. A. El Ries and S. Khalil, J. Pharm. Biomed. Anal. 25 (2001)
32. United States Pharmacopeial convention, INC., M. D. Rockville 3–7.
2748. 37. L. Geiser and J. L. Veuthey, Electroanalysis, 28 (2007) 45–57.
SAŽETAK
Određivanje tragova difenhidramina adsorbiranih na površini
mikroelektrode kontinuiranom cikličkom voltametrijom s
brzim Fourierovim transformacijama u protočnom
sustavu s ubrizgavanjem analita
Parviz Norouzi,a,b* Mohammad Reza Ganjali,a,b Ezzattollah Nouryousefi,a
Sayed Jamaleddin Shahtaheric i Rasoul Dinarvandd
a
Center of Excellence in Electrochemistry, Department of Chemistry, University of Tehran, Tehran, Iran
b
Endocrinology & Metabolism Research Center, Tehran University of Medical Science, Tehran, Iran
c
University of Tehran, School of Public Health, Environmental Research Center, Tehran, Iran
d
University of Tehran, Medicinal Nanotechnology Research Center, Tehran, Iran
Opisana je kontinuirana ciklička voltametrija difenhidramina na zlatnoj mikroelektrodi. Istraženi su utjecaji para-
metara pobude na osjetljivost metode. Optimalni uvjeti su fosfatni pufer (pH = 2), brzina promjene potencijala (v)
40 V / s, potencijal akumulacije 0,5 V i trajanje akumulacije 0,2 s. Adsorpcija analita na površinu zlatne elektrode
mijenja odziv aksidacije zlata u protočnom sustavu s ubrizgavanjem uzorka. Opisana elektroanalitička metoda je
pogodna za određivanje difenhidramina različitim kromatografskim tehnikama. Korištenjem brze Fourierove
transformacije povećava se omjer signala i šuma odbijanjem osnovne struje i dvodimenzionalnom integracijom
elektrodnog odziva u odabranim područjima potencijala i vremena. Ovisnost odziva o koncentraciji analita
linearna je u rasponu od 1 × 10–11 do 4 × 10⁻⁷ mol dm–3, a granice detekcije i kvantifikacije su 5 × 10–12 mol dm–3 i
4 × 10–11 mol dm–3. Predloženom metodom određen je sadržaj difenhidramina u tabletama
Croat. Chem. Acta 83 (2010) 135.You can also read