Cross Chest Graph for Disease Diagnosis with Structural Relational Reasoning
←
→
Page content transcription
If your browser does not render page correctly, please read the page content below
Cross Chest Graph for Disease Diagnosis with Structural
 Relational Reasoning

 Gangming Zhao, Baolian Qi, Jinpeng Li, *†‡

 Abstract Inter-image
arXiv:2101.08992v2 [cs.CV] 1 Feb 2021

 Knowledge Mining

 Knowledge
 Locating lesions is important in the computer-aided di- Reasoning
 agnosis of X-ray images. However, box-level annotation is Intra-image
 time-consuming and laborious. How to locate lesions accu- Knowledge Mining

 rately with few, or even without careful annotations is an ur-
 Cross Chest Graph Network
 gent problem. Although several works have approached this
 problem with weakly-supervised methods, the performance
 Figure 1. CCG network models the intra-image relationship be-
 needs to be improved. One obstacle is that general weakly- tween different anatomical areas by leveraging the structural infor-
 supervised methods have failed to consider the characteris- mation to simulate the doctor’s habit of observing different areas.
 tics of X-ray images, such as the highly-structural attribute. Meanwhile, the relationship between any pair of images is mod-
 We therefore propose the Cross-chest Graph (CCG), which eled by a knowledge-reasoning module to simulate the doctor’s
 improves the performance of automatic lesion detection by habit of comparing multiple images.
 imitating doctor’s training and decision-making process.
 CCG models the intra-image relationship between different
 anatomical areas by leveraging the structural information , object detection [3, 5, 16, 15, 10] and semantic segmenta-
 to simulate the doctor’s habit of observing different areas. tion [12, 17]. To achieve good performance in these tasks,
 Meanwhile, the relationship between any pair of images is substantial images with careful annotations are needed. En-
 modeled by a knowledge-reasoning module to simulate the couraged by the success of DCNN in computer vision, some
 doctor’s habit of comparing multiple images. We integrate researches have directly applied DCNN models to analyze
 intra-image and inter-image information into a unified end- the medical images but cannot achieve the same perfor-
 to-end framework. Experimental results on the NIH Chest- mance as in the natural images. The reasons lie in two folds:
 14 database (112,120 frontal-view X-ray images with 14 1. it is expensive to acquire accurate localization or classi-
 diseases) demonstrate that the proposed method achieves fication labels in chest X-ray images. 2. there exists much
 state-of-the-art performance in weakly-supervised localiza- professional knowledge in medical images that DCNN can-
 tion of lesions by absorbing professional knowledge in the not exploit well. Therefore, how to exploit the professional
 medical field. knowledge into DCNN models for solving these two ques-
 tions still opens a fully challenging problem. Our work
 transfers the knowledge into DCNN models to reduce the
 1. Introduction problem of shortage of carefully annotated images.
 Chest radiographs are a type of medical images that can Recent work paid much attention to utilize professional
 be conveniently acquired for disease diagnosis. With the knowledge of chest X-ray images into DCNN frameworks.
 rapid development of deep learning, automatic disease de- However, they just proposed a simple fused strategy to em-
 tection in chest X-ray images has become an important task bed low-level information of chest X-ray into models, such
 in the computer-aided diagnosis. Deep convolutional neu- as Liu et al. [9] utilized contrastive learning to provide more
 ral networks (DCNN) have been widely applied in many localization information with the help of healthy images.
 computer vision tasks, such as image classification [6, 18] Zhao et al. [22] proposed to exploit the contralateral infor-
 mation of chest X-ray via a simple fusion module. These
 * Gangming Zhao and Baolian Qi contributed equally to this work.
 † Gangming
 methods only exploit the apparent information of chest-
 Zhao is with the Department of Computer Science, The
 University of Hong Kong, Hong Kong.
 Xray images. They all overlooked the inner structure infor-
 ‡ Qibao Lian and Jinpeng Li are with University of Chinese Academy mation of chest X-rays. Therefore, they cannot apply their
 of Sciences, Beijing, China methods into real applications.
In this paper, we propose a Cross Chest Graph Network 2. Related Work
(CCG-Net) as shown in Fig 1, which firstly utilizes deep ex-
pert knowledge to automatical detect disease in chest X-ray 2.1. Disease Detection
images. We have known that medical experts have much ex- Object detection is one of the most important computer
perience in finding out disease and how to treat patients. In vision tasks, aiming to localize and classify. Due to their
fact, the actions of medical experts consist of two phases: strong feature representation ability, DCNN achieved much
training and decision-making processes. They pay much progress in object detection tasks. For detection tasks,
time to learn distinguish disease and embed their experi- DCNN methods consist of two style framework: 1. two-
ence into the decision process. During the training process, stage models, such as RCNN series [16], 2. one-stage mod-
experts would like to observe different areas and find out els, such as YOLO [15] and SSD [10]. However, for disease
the relationship between any pair of images. Our CCG- detection, because of the shortage in careful annotations,
Net aims to model the observation way by a knowledge- traditional detection framework cannot directly be applied
reasoning module to simulate the doctor’s habit of compar- in chest X-ray images. Besides, since there is much distor-
ing multiple images. Then we integrate intra-image and tion caused by other chest X-ray tissues, such low contrast
inter-image information into a unified end-to-end frame- also causes the difficulty of disease finding.
work. Weakly supervised object detection (WSOD) can be con-
 Inspired from the experience of medical experts, our pro- sidered as an effective method to solve these problems.
posed CCG-Net consists of four modules, 1. an end-to-end Based on CAM [23], researchers proposed many tech-
framework for deciding where and what is a disease, 2. a niques to use only image-level labels to detect objects. Al-
inter-image relation module, which formulates the training though there is no enough detection supervision, WSOD
process of medical experts, to compare multiple images, 3. still achieved much progress. However, researchers still
a intra-image knowledge learning module, which builds the face a big challenge when it comes to disease detection in
local relation graph for different patches of chest X-ray im- medical images. the existence of much professional knowl-
ages. Due to their highly structured property, every chest edge greatly limits the development of the applications of
X-ray image can be divided into several patches, we build DCNN in medical fields. Therefore, in this paper, we are
a patch-wise relation graph on them, 4. a knowledge rea- inspired by the experts’ learning and decision processes to
soning module, which excavates the inner knowledge from propose CCG-Net, which not only exploits a larger amount
cross-image structural features. The last three operations of knowledge in chest X-ray images but also builds a unified
(2, 3, and 4) are similar to medical experts’ training pro- framework to detect disease in an end-to-end style.
cess, which learn intra-image and inter-image information
to gain professional knowledge. The first operation embeds 2.2. Knowledge-based Disease Diagnosis
the learned knowledge into DCNN frameworks leading to Automatical disease diagnosis is a key problem in med-
better disease diagnosis models. Above all, our contribu- ical fields. However, due to the shortage of careful an-
tion consists of three folds: notations and the existence of much professional knowl-
 edge, DCNN methods cannot achieve a good performance
 • We propose CCG-Net, which is the first to formulate in medical tasks, especially such a tough problem: disease
 the medical experts’ training process by building rela- detection in chest X-ray images. To exploit medical knowl-
 tion graphs in the intra-image and inter-image informa- edge and embed it into DCNN frameworks, researchers paid
 tion of chest X-ray images. More generally, it provides much effort to utilize medical experts’ experience for dis-
 inspiration to address medical vision tasks with much ease diagnosis. Wang et al. [20] firstly proposed a carefully
 professional knowledge like in chest X-ray images. annotated chest X-ray dataset and led to a series of work
 that focuses on using image-level labels to localize the dis-
 ease. Li et al. [8] integrated classification and localization in
 • We divide the experts’ professional actions into two a whole framework with two multi instance-level losses and
 stages including training and decision-making pro- performed better. Liu et al. [9] improved their work to pro-
 cesses. In addition, we utilize intra-image and inter- pose contrastive learning of paired samples, which utilizes
 image relation to learn much professional knowledge healthy images to provide more localization information for
 that would be embedded in an end-to-end detection disease detection. Zhao et al. [22] proposed to utilize the
 framework. symmetry information in a chest X-ray to improve the dis-
 ease localization performance. Besides, many works ap-
 plied relation knowledge models to chest X-ray diagnosis.
 • We achieve state-of-the-art results on the localization Ypsilantis et al. [21], Pesce et al. [14], and Guan et al. [4]
 of NIH ChestX-ray14. proposed to build a relation attention model fusing DCNN

 2
The Patch of x
 1′
 Hash Code
 1′

 FC Layer
 [0 1 1 ∙∙∙ 0], [0 1 1∙∙∙ 1], ∙∙∙ , [0 1 1∙∙∙ 1]

 [1 0 0 ∙∙∙ 0], [1 0 0 ∙∙∙1], ∙∙∙ , [0 1 1∙∙∙ 1]
 SLIC 2′
 2′ Intra-image Knowledge Learning Module

 Input
 1
 2 ′

 Backbone
 1
 2
 ′
 Softmax(P) ⊗
 1
 1 Bounding Box Regression Softmax( ) ⊗
 Backbone

 2
 ′

 2 Knowledge Reasoning Module
 Inter-image Relation Module

 ⊕

 Fully Supervised Learning ⊗ Element-wise multiplication ⊕ Addition
 P The affinity matrix F Feature maps
 Bounding Box Regression
 CCG Network

 Disease proposals
 SLIC Simple Linear Iterative Clustering
 Category Prediction The loss of End_to_End Framework
 The loss of Inter-image Relation Module
 Weakly Supervised Learning R The loss of Knowledge Reasoning Module
 Category Prediction The loss of Intra-image Knowledge Learning Module
 Cross Chest Graph Network

Figure 2. The network consists of four modules: 1. an end-to-end framework for disease detection under weakly-supervised settings, 2.
the inter-image relation module among different samples, 3. the intra-image knowledge learning module based on the thoracic spatial
structure, 4. the knowledge reasoning module mining cross-image structural features. Our four modules are tightly related and can be
easily integrated into an end-to-end framework.

models achieved much progress. Li et al. [7] proposed the disease in chest X-ray images. In our paper, we
a knowledge-graph based on medical reports and images utilize the same multi-instance level losses used in [9]
to determine the dependencies among chest X-ray images. and [8].
Cheng et al. [11] also proposed a new total strongly super-
vised dataset for tuberculosis detection. However, they all • Inter-image Relation Module, which includes a learn-
overlooked the structural relation among chest X-ray im- able matrix G ∈ Rn×n . We also use a contrast-
ages. In this paper, we propose to build a structural, rela- constrained loss to share similar information of X and
tional graph for disease detection under weakly supervised exploit their contrasted structural knowledge. We build
scenarios in chest X-ray images. Specifically, we build the a cross-sample graph for them to exploit the dependen-
global and local graph in chest X-ray via three modules: 1. cies among different samples. The graph G ∈ Rn×n
a inter-image relation module, 2. a intra-image knowledge is to build the inter-image relation among sampled
learning module, 3. knowledge reasoning module. Further- samples, which is a learnable matrix, and every el-
more, we integrate three modules into an end-to-end frame- ement is initialized by n1 . The element gij of G,
work to jointly train our network. Our proposed three rela- i, j ∈ {1, 2, ..., n}, represents the similarity wight of
tional modules provide better supervision since we exploit images xi and xj .
the local structural knowledge and global relation among
different samples. • Intra-image Knowledge Learning, which firstly ac-
 quires patch-wise features of different images. Then
3. Method the network can achieve a new image graph via build-
 ing a structural knowledge-based module. We denote
3.1. Overview this graph as Gk ∈ Rn×n . Assumed that the num-
 Given the images X = {x1 , x2 , ..., xn }. Our proposed ber of patches are |pi | and |pj | of images xi and xj .
framework consists of four modules: The graph Gk would be calculated on using the graph
 Gl ∈ R|pi |×|pj | , which learns the relationship between
 • The End to End Framework is to localize and classify different paired patches of images.

 3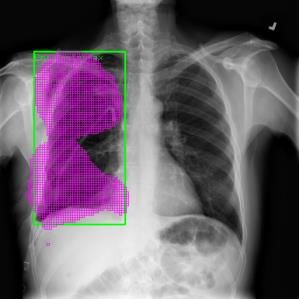
• Knowledge Reasoning Module, which is based on similar information of X and exploit their contrasted struc-
 cross image structural knowledge. When we get the tural knowledge, as following equation.
 whole structural information of different images, we P
 will utilize it to reason the inner structural dependen- (u,v)∈G G(u, v)D(Fu , Fv )
 LIR = (4)
 cies among different patches in different images. n×n
3.2. End to End Framework D(·) is the distance metric function, where it is a Euclidean
 The end to end framework is to localize and classify distance. Fu and Fv means the feature map after C5 of the
the disease in chest X-ray images in a coarse-grained style. image xu and xv . We build a cross-sample graph for them
More specifically, the input images X = {x1 , x2 , ..., xn } of to exploit the dependencies among different samples. The
the module are resized to 512 × 512. ResNet-50 pre-trained graph G ∈ Rn×n is to build the inter-image relation among
from the ImageNet dataset is adopted as the backbone for sampled samples, which is a learnable matrix, and every
this module. We use the feature map F after C5 (last con- element is initialized by n1 . The element gij of G, i, j ∈
volutional output of 5th-stage), which is 32 times down- {1, 2, ..., n}, represents the similarity wight of images xi
sampled from the input image, and of size 2048 × 16 × 16. and xj . G is adaptively adjusted during training processes
Each grid in the feature map denotes the existent probabil- and changes with diverse inputs to exploit the relationship
ity of disease. We pass F through two 1 × 1 convolutional fully.
layers and a sigmoid layer to obtain the class-aware feature 3.4. Intra-image Knowledge Learning
map P of size C ×H ×W , where C is the number of classes.
Then we follow the paradigm used in [9], computing losses Intra-image Knowledge Learning, which firstly utilizes
and making predictions in each channel for the correspond- Simple linear iterative clustering (SLIC) [1], a super-
ing class. For images with box-level annotations, if the grid pixel method to generate the patches for different im-
in the feature map overlaps with the projected ground truth ages. Assumed that the patches of the image xi is pi =
box, we assign label 1 to the grid. Otherwise, we assign 0 to pi1 , pi2 , ..., pim . Then the network can achieve a new im-
it. Therefore, we use the binary cross-entropy loss as used age graph via building a structural knowledge-based mod-
in [9] for each grid: ule with the help of pi , i ∈ 1, 2, ..., n. We denote the graph
 X X as Gk ∈ Rn×n , which is the intra-image graph between
 Lki (P) = k
 −yij log(pkij )− k
 (1−yij ) log(1−pkij ) (1) paired images xi and xj . The graph Gk is calculated on
 j j using the graph Gl ∈ R|pi |×|pj | , which learns the depen-
 dencies among different paired patches of images. Then the
where k, i, and j are the index of classes, samples, and grids
 k same contrast-constrained loss using this graph to provide
respectively. yij denotes the target label of the grid and pkij
 more structural knowledge for the whole framework.
denotes the predicted probability of the grid.
 For images with only image-level annotations, we use
 P
 (u,v)∈Gk Gk (u, v)D(Fu , Fv )
the MIL loss used in [8]. LIK = (5)
 n×n
 Y
 Lki (P) = −yik log(1 − (1 − pkij ))
 Gk = Wl (Gl ) (6)
 j
 (2)
 Where, Wl is a fully connected layer and
 Y
 −(1 − yik ) log( (1 − pkij ))
 j 0 0
 Gl (l, p) = D (Hl , Hp ), l ∈ 1, 2, ..., |pi |, p ∈ 1, 2, ..., |pj |
where yikdenotes the target label of the image. For this end (7)
to end framework, the whole loss Lbase as shown in Fig. 2,
is formulated as follows. Hl is the hash code [19] of the patch pil in the image xi and
 0 0
 XX Hp is the hash code of the patch pjp in the image xj . D (·)
 Lbase = λki βB Lki (P) + (1 − λki )Lki (P) (3) is the Hamming distance.
 i k

where λki ∈ 0, 1 denotes if the kth class in the ith sample 3.5. Knowledge Reasoning Module
has box annotation, and βB is the balance weight of the two In addition to previous efforts to focus on information in
losses and is set to 4. a whole image, we also explored the value of cross-image
 semantic relations in the medical object. The correlations
3.3. Inter-image Relation Module
 between patches across images are emphasized, especially,
 Inter-image relation is formulated as a learnable matrix the correlations between corresponding patches in two im-
G ∈ Rn×n . A contrast-constrained loss is used to share ages.

 4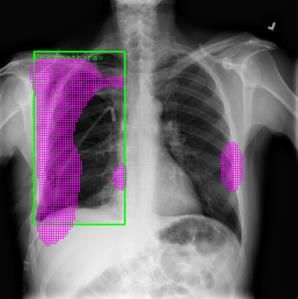
Knowledge Reasoning Module focuses on the correla- 3.7. Training and Test
tions of two images. After getting the feature map Fu and
 Training All the models are trained on NIH chest X-ray
Fv of the images, the affinity matrix P is firstly calculated
 dataset using the SGD algorithm with the Nesterov momen-
between Fu and Fv .
 tum. With a total of 9 epochs, the learning rate starts from
 P = FuT WP Fv ∈ RHW ×HW 0.001 and decreases by 10 times after every 4 epochs. Ad-
 ditionally, the weight decay and the momentum is 0.0001
where the feature map Fu ∈ RC×HW and Fv ∈ RC×HW and 0.9, respectively. All the weights are initialized by pre-
are flattened into matrix formats, and WP ∈ RC×C is a trained ResNet [6] models on ImageNet [2]. The mini batch
learnable matrix. The affinity matrix P represents the simi- size is set to 2 with the NVIDIA 1080Ti GPU. All mod-
larity of all pairs of patches in Fu and Fv . els proposed in this paper are implemented based on Py-
 Then P is normalized column-wise to get the attention Torch [13].
map of Fu for each patch in Fv and row-wise to get the Testing We also use the threshold of 0.5 to distinguish
attention map of Fv for each patch in Fu . positive grids from negative grids in the class-wise feature
 0
 map as described in [8] and [9]. All test setting is same
 Fu = Fu sof tmax(P ) ∈ RC×HW as [9], we also up-sampled the feature map before two last
 0
 Fv = Fv sof tmax(P T ) ∈ RC×HW fully convolutional layers to gain a more accurate localiza-
 tion result.
where sof tmax(P ) and sof tmax(P T ) pay attention to the
similar patches of the feature map Fu and Fv respectively. 4. Experiments
Therefore, they can be used to enhance Fu and Fv respec-
tively, so that similar patches in Fu and Fv are highlighted. 4.1. Dataset and Evaluation Metrics
 The cross-image method can extract more contextual in- Dataset. NIH chest X-ray dataset [20] include 112,120
formation between images than using a single image. This frontal-view X-ray images of 14 classes of diseases. There
module exploits the context of other related images to im- are different diseases in each image. Furthermore, the
prove the reasoning ability of the feature map, which is dataset contains 880 images with 984 labeled bounding
beneficial to the localization and classification of disease boxes. We follow the terms in [8] and [9] to call 880 images
in chest X-ray images. Furthermore, we exploit the en- as “annotated” and the remaining 111,240 images as “unan-
hanced feature map to calculate the new similarity between notated”. Following the setting in [9], we also resize the
the paired images to gain a more strong supervisor. original 3-channel images from resolution of 1024 × 1024
 P 0 0 0 to 512 × 512 without any data augmentation techniques.
 (u,v)∈Gk Gk (u, v)D(Fu , Fv )
 0

 LKR = (8) Evaluation Metrics. We follow the metrics used in [8].
 n×n The localization accuracy is calculated by the IoU (Inter-
 0 0
 section over Union) between predictions and ground truths.
 The graph Gk is calculated on using the graph Gl ∈ Since it is a coarse-grained task, our localization predic-
R|pi |×|pj | . tions are discrete small rectangles. The eight diseases with
 0 0 0 ground truth boxes is reported in our paper. The localization
 Gk = Wl (Gl ) (9) result is regarded as correct when IoU > T (IoU ), where
 0 T(*) is the threshold.
where Wl is a fully connected layer and
 0 0 4.2. Comparison with the State-of-the-art
 Gl (l, p) =D (Pl , Pp ),
 (10) In order to evaluate the effectiveness of our models for
 l ∈ {1, 2, ..., |pi |}, p ∈ {1, 2, ..., |pj |}
 weakly supervised disease detection, we design the exper-
 0
Pl is the l-th feature patch of Fu and Pp is the p-th feature iments on three sets of data and conduct a 5-fold cross-
 0
patch of Fv , respectively. validation. In the first experiment, we use the 50% unan-
 notated images and 80% annotated images for training, and
3.6. Training Loss test the models with the remaining 20% annotated images.
 In the second experiment, we use the 100% unannotated
 The overall loss function during the training is a
 images and no any annotated images for training, and test
weighted combination of four loss functions,
 the models with all annotated images. In the third experi-
 Lall = w1 Lbase + w2 LIR + w3 LIK + w4 LKR (11) ment, we use the 100% unannotated images and 40% anno-
 P4 tated images for training, and test the models with remain-
where i=1 wi = 1. In our experiments, we always set ing 60% annotated images. Additionally, our experimen-
wi = 0.25, i ∈ 1, 2, .., 4. tal results are mainly compared with four methods. The

 5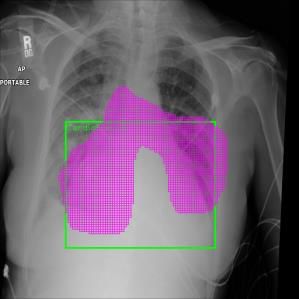
T (IoU) Models Atelectasis Cardiomegaly Effusion Infiltration Mass Nodule Pneumonia Pneumothorax Mean
 X, Wang [20] 0.24 0.46 0.30 0.28 0.15 0.04 0.17 0.13 0.22
 0.3 Z, Li [8] 0.36 0.94 0.56 0.66 0.45 0.17 0.39 0.44 0.49
 J, Liu [9] 0.53 0.88 0.57 0.73 0.48 0.10 0.49 0.40 0.53
 Ours 0.44 0.86 0.68 0.84 0.47 0.29 0.67 0.40 0.60
 X, Wang [20] 0.05 0.18 0.11 0.07 0.01 0.01 0.03 0.03 0.06
 0.5 Z, Li [8] 0.14 0.84 0.22 0.30 0.22 0.07 0.17 0.19 0.27
 J, Liu [9] 0.32 0.78 0.40 0.61 0.33 0.05 0.37 0.23 0.39
 Ours 0.27 0.86 0.48 0.72 0.53 0.14 0.58 0.35 0.49
 X, Wang [20] 0.01 0.03 0.02 0.00 0.00 0.00 0.01 0.02 0.01
 0.7 Z, Li [8] 0.04 0.52 0.07 0.09 0.11 0.01 0.05 0.05 0.12
 J, Liu [9] 0.18 0.70 0.28 0.41 0.27 0.04 0.25 0.18 0.29
 Ours 0.20 0.86 0.48 0.68 0.32 0.14 0.54 0.30 0.44

Table 1. The comparison results of disease localization among the models using 50% unannotated images and 80% annotated images. For
each disease, the best results are bolded.

 T (IoU) Models Atelectasis Cardiomegaly Effusion Infiltration Mass Nodule Pneumonia Pneumothorax Mean
 Z, Li [8] 0.59 0.81 0.72 0.84 0.68 0.28 0.22 0.37 0.57
 0.1 J, Liu [9] 0.39 0.90 0.65 0.85 0.69 0.38 0.30 0.39 0.60
 Ours 0.66 0.88 0.79 0.85 0.69 0.28 0.40 0.47 0.63
 J, Liu [9] 0.34 0.71 0.39 0.65 0.48 0.09 0.16 0.20 0.38
 0.3 Baseline 0.36 0.69 0.35 0.64 0.44 0.08 0.02 0.23 0.35
 Ours 0.31 0.79 0.37 0.75 0.40 0.06 0.24 0.27 0.40
 J, Liu [9] 0.19 0.53 0.19 0.47 0.33 0.03 0.08 0.11 0.24
 0.5 Baseline 0.18 0.51 0.14 0.47 0.27 0.03 0.01 0.12 0.22
 Ours 0.19 0.71 0.14 0.52 0.31 0.08 0.05 0.13 0.27
 J, Liu [9] 0.08 0.30 0.09 0.25 0.19 0.01 0.04 0.07 0.13
 0.7 Baseline 0.11 0.34 0.06 0.32 0.20 0.01 0.00 0.06 0.14
 Ours 0.06 0.64 0.08 0.38 0.19 0.01 0.08 0.09 0.19

Table 2. The comparison results of disease localization among the models using 100% unannotated images and no any annotated images.
For each disease, the best results are bolded.

first method is X, Wang [20], which proposes a carefully [8] only provides the results when T(IoU) = 0.1, in order
annotated chest X-ray dataset and a unified weakly super- to better show the performance of our model, we add an
vised multi-label image classification and disease localiza- evaluation method of T(IoU) = 0.1. It can be seen that our
tion framework. The second method is Z, Li [8], which uses model outperforms [8] and [9] in most cases, as shown in
fully convolutional neural network to localize and classify Table 2. For example, when T(IoU) is 0.1, the mean accu-
the disease in chest X-ray images. The third method is J, racy of our models is 0.63, which is 0.06 higher than [8],
Liu [9], which proposes contrastive learning of paired sam- and 0.03 higher than [9]. Furthermore, when T(IoU) is 0.7,
ples to provide more localization information for disease the mean localization result of our model is 0.19, which is
detection. The last method is our baseline model, which is a 0.06 higher than [8] and 0.05 higher than [9]. Compared
unified end-to-end framework that doesn’t use our approach with the baseline model, our approach performs better in
to locate and classify the disease. most classes except for “Atelectasis” and “Nodule”. The
 In the first experiment, we compare the localization re- trend stays the same that at higher T(IoU), our approach
sults of our model with [20], [8] and [9]. We can observe demonstrates more advantages over baseline methods. The
that our model outperforms existing methods in most cases, added unannotated training samples contribute more than
as shown in Table 1. Particularly, with the increase of the removed annotated ones in those classes, which implies
T(IoU), our model has greater advantages over the refer- that our approach can better utilize the unannotated sam-
ence models. For example, when T(IoU) is 0.3, the mean ples. The overall results show that even without annotated
accuracy of our model is 0.60, and outperforms [20], [8] data used for training, our approach can achieve decent lo-
and [9] by 0.38, 0.11 and 0.07 respectively. However, when calization results.
T(IoU) is 0.7, the mean accuracy of our model is 0.44, and In the third experiment, we use more annotated images
outperforms [20], [8] and [9] by 0.43, 0.32 and 0.15 re- comparing the second experiment. We compare the lo-
spectively. Overall, the experimental results shown in Table calization results of our model with [9] in same data set-
1 demonstrate that our method is more accurate for disease ting. It can be seen that our model outperforms [9] in most
localization and classification, which provides a great role cases, as shown in Table 3. With T(IoU) = 0.3 and 0.7,
for clinical practices. our model outperforms [9] by 0.02 and 0.05 respectively.
 In the second experiment, we train our model without Similar improvements are achieved comparing the second
any annotated images comparing the first experiment. Since experiment. Overall, the experimental results demonstrate

 6

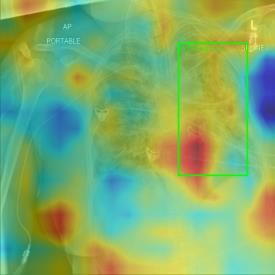
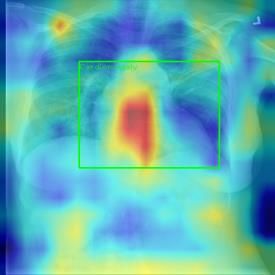
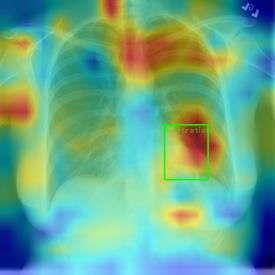
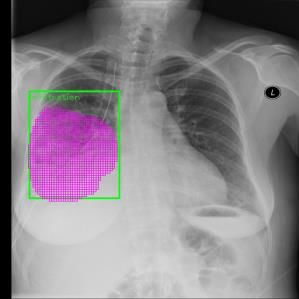
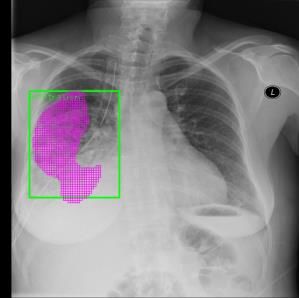
T (IoU) Models Atelectasis Cardiomegaly Effusion Infiltration Mass Nodule Pneumonia Pneumothorax Mean
 J, Liu [9] 0.55 0.73 0.55 0.76 0.48 0.22 0.39 0.30 0.50
 0.3 Baseline 0.47 0.84 0.65 0.82 0.33 0.04 0.57 0.29 0.50
 Ours 0.49 0.87 0.66 0.88 0.48 0.10 0.51 0.20 0.52
 J, Liu [9] 0.36 0.57 0.37 0.62 0.34 0.13 0.23 0.17 0.35
 0.5 Baseline 0.27 0.76 0.39 0.58 0.24 0.02 0.39 0.21 0.36
 Ours 0.26 0.80 0.41 0.67 0.15 0.06 0.42 0.18 0.37
 J, Liu [9] 0.19 0.47 0.20 0.41 0.22 0.06 0.12 0.11 0.22
 0.7 Baseline 0.14 0.62 0.20 0.42 0.07 0.00 0.23 0.08 0.22
 Ours 0.18 0.71 0.20 0.50 0.20 0.02 0.29 0.06 0.27

Table 3. The comparison results of disease localization among the models using 100% unannotated images and 40% annotated images.
For each disease, the best results are bolded.

 Atelectasis Cardiomegaly

 Effusion Infiltration

 Mass Nodule

 Pneumonia Pneumothorax
Figure 3. Visualization of the predicted results on both the baseline model and our method. The first column shows the original images, the
second and third columns show baseline and our method. The green bounding box and red area mean the the ground truth and prediction.

that our method can improve the performance of models formation of intra-image and inter-image can improve the
with limited annotated images. performance of automatic lesion detection. Additionally,
 we also visualize the generated heatmap and ground truth
 To better demonstrate the final effect of our approach on of our model, as shown in Figure 4. It can be seen that the
disease localization and classification, we visualize some proposed method can effectively locate and classify medical
of typical predictions of both the baseline model and our images.
method, as shown in Figure 3. The first column shows the
original images, the second and third columns show base- 4.3. Ablation Studies
line model and our method. The green bounding box and
red area mean the ground truth and prediction. It can be In this section, we explore the influence of different mod-
seen that our models can predict more accurate in most ules on our method for ablation studies. To evaluate our
cases comparing the baseline model. For example, the class method more comprehensively, we build 6 models, includ-
“Atelectasis” and “Nodule”, the localization reslut of the ing the model of the end to end framework (Baseline), the
baseline model is completely inconsistent with the ground model with the intra-image knowledge learning (IK), the
truth, but the localization reslut of our method is consistent model with the inter-image relation module (IR), the model
with the ground truth. It shows that using the structural in- with the knowledge reasoning (KR), the model combining

 7
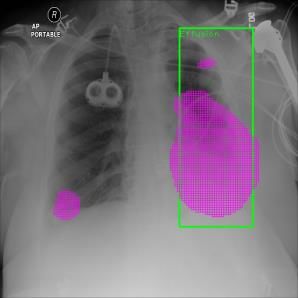
Figure 4. Visualization of the generated heatmap and ground truth of our method, where the green bounding box means the ground truth.

 Data Models Atelectasis Cardiomegaly Effusion Infiltration Mass Nodule Pneumonia Pneumothorax Mean
 X, Wang [20] 0.01 0.03 0.02 0.00 0.00 0.00 0.01 0.02 0.01
 Z, Li [8] 0.04 0.52 0.07 0.09 0.11 0.01 0.05 0.05 0.12
 J, Liu [9] 0.18 0.70 0.28 0.41 0.27 0.04 0.25 0.18 0.29
 Baseline 0.34 1.00 0.40 0.68 0.11 0.14 0.65 0.00 0.41
 0.5 0.8 IK 0.22 0.82 0.36 0.56 0.32 0.14 0.25 0.35 0.38
 IR 0.24 0.82 0.40 0.56 0.32 0.07 0.38 0.30 0.39
 KR 0.24 0.89 0.32 0.68 0.26 0.14 0.21 0.30 0.38
 (IR+IK) 0.20 0.86 0.48 0.68 0.32 0.14 0.54 0.30 0.44
 IR+IK+KR 0.27 0.86 0.40 0.56 0.37 0.14 0.13 0.30 0.38
 J, Liu [9] 0.08 0.30 0.09 0.25 0.19 0.01 0.04 0.07 0.13
 Baseline 0.11 0.34 0.06 0.32 0.20 0.01 0.00 0.06 0.14
 IK 0.10 0.59 0.07 0.37 0.20 0.00 0.13 0.06 0.19
 1.0 0.0 GR 0.06 0.61 0.07 0.28 0.14 0.00 0.05 0.08 0.16
 IK 0.09 0.63 0.06 0.36 0.22 0.00 0.09 0.07 0.19
 IR+IK 0.06 0.64 0.08 0.38 0.19 0.01 0.08 0.09 0.19
 IR+IK+KR 0.12 0.51 0.07 0.36 0.22 0.03 0.02 0.07 0.17
 J, Liu [9] 0.19 0.47 0.20 0.41 0.22 0.06 0.12 0.11 0.22
 Baseline 0.14 0.62 0.20 0.42 0.07 0.00 0.23 0.08 0.22
 IK 0.14 0.66 0.09 0.47 0.15 0.00 0.30 0.06 0.23
 1.0 0.4 GR 0.14 0.75 0.24 0.42 0.11 0.00 0.26 0.12 0.25
 KR 0.13 0.68 0.20 0.47 0.19 0.06 0.17 0.08 0.25
 IR+IK 0.13 0.72 0.13 0.43 0.20 0.00 0.23 0.06 0.24
 IR+IK+KR 0.18 0.71 0.20 0.50 0.20 0.02 0.29 0.06 0.27

Table 4. The comparison results of disease localization among the models using three sets of data at T(IoU)=0.7, including 50% unan-
notated and 80% annotated images (0.5 0.8), 100% unannotated and no any annotated images (1.0 0.0), and 100% unannotated and 40%
unannotated images (1.0 0.4). For each disease, the best results are bolded.

the inter-image relation module and the intra-image knowl- because no matter what kind of data we use, our models
edge learning (IR+IK), the model combining the inter- achieve great improvement. Particularly, the method can
image relation module, the intra-image knowledge learning achieve good localization results even without any annota-
and the knowledge reasoning module (IR+IK+KR). tion images for training.
 Table 4 shows the results of the three experiments men-
tioned in section 4.2 at T(IOU)=0.7. It can be seen that our
method performs better in most classes except for “Atelec-
tasis”, “Effusion” and “Mass” comparing [20], [8] and [9]. 5. Conclusion
Furthermore, comparing the baseline model, it can be ob-
served that the performance of our other models are im- By imitating doctor’s training and decision-making pro-
proved in most cases, which shows that our method is effec- cess, we propose the Cross-chest Graph (CCG) to improve
tive for improving model performance. However, a model the performance of automatic lesion detection under lim-
does not always maintain the advantage in the three exper- ited supervision. CCG models the intra-image relationship
iments, for example, the model (IR+IK) achieves the best between different anatomical areas by leveraging the struc-
performance in the data (0.5 0.8), the model (IK), the model tural information to simulate the doctor’s habit of observing
(KR) and the model (IR+IK) achieve the best performance different areas. Meanwhile, the relationship between any
in the data (1.0 0.0), and the model (IR+IK+KR) achieves pair of images is modeled by a knowledge-reasoning mod-
the best performance in the data (1.0 0.4). Overall, the ule to simulate the doctor’s habit of comparing multiple im-
experimental results demonstrate that using structural rela- ages. We integrate intra-image and inter-image information
tional information can improve the performance of models. into a unified end-to-end framework. Experimental results
For different experimental data, our models can achieve dif- on the NIH Chest-14 dataset demonstrate that the proposed
ferent results. It is difficult for us to determine which model method achieves state-of-the-art performance in diverse sit-
is the best, but we can be sure that our method is effective, uations.

 8
References ban Desmaison, Luca Antiga, and Adam Lerer. Automatic
 differentiation in pytorch. 2017. 5
 [1] Radhakrishna Achanta, Appu Shaji, Kevin Smith, Aurelien [14] Emanuele Pesce, Petros-Pavlos Ypsilantis, Samuel Withey,
 Lucchi, Pascal Fua, and Sabine Süsstrunk. Slic superpixels. Robert Bakewell, Vicky Goh, and Giovanni Montana. Learn-
 Technical report, 2010. 4 ing to detect chest radiographs containing lung nodules using
 [2] Jia Deng, Wei Dong, Richard Socher, Li-Jia Li, Kai Li, visual attention networks. arXiv preprint arXiv:1712.00996,
 and Li Fei-Fei. Imagenet: A large-scale hierarchical image 2017. 2
 database. In 2009 IEEE conference on computer vision and [15] Joseph Redmon, Santosh Divvala, Ross Girshick, and Ali
 pattern recognition, pages 248–255. Ieee, 2009. 5 Farhadi. You only look once: Unified, real-time object de-
 [3] Ross Girshick. Fast r-cnn. In Proceedings of the IEEE inter- tection. In Proceedings of the IEEE conference on computer
 national conference on computer vision, pages 1440–1448, vision and pattern recognition, pages 779–788, 2016. 1, 2
 2015. 1 [16] Shaoqing Ren, Kaiming He, Ross Girshick, and Jian Sun.
 [4] Qingji Guan, Yaping Huang, Zhun Zhong, Zhedong Zheng, Faster r-cnn: Towards real-time object detection with region
 Liang Zheng, and Yi Yang. Diagnose like a radiologist: At- proposal networks. In C. Cortes, N. D. Lawrence, D. D.
 tention guided convolutional neural network for thorax dis- Lee, M. Sugiyama, and R. Garnett, editors, Advances in Neu-
 ease classification. arXiv preprint arXiv:1801.09927, 2018. ral Information Processing Systems 28, pages 91–99. Curran
 2 Associates, Inc., 2015. 1, 2
 [5] K. He, X. Zhang, S. Ren, and J. Sun. Spatial pyramid [17] Olaf Ronneberger, Philipp Fischer, and Thomas Brox. U-
 poolling in deep convolutional networks for visual recogni- net: Convolutional networks for biomedical image segmen-
 tion. In European Conference of Computer Vision (ECCV), tation. In International Conference on Medical image com-
 2014. 1 puting and computer-assisted intervention, pages 234–241.
 [6] Kaiming He, Xiangyu Zhang, Shaoqing Ren, and Jian Sun. Springer, 2015. 1
 Deep residual learning for image recognition. In Proceed- [18] Olga Russakovsky, Jia Deng, Hao Su, Jonathan Krause, San-
 ings of the IEEE conference on computer vision and pattern jeev Satheesh, Sean Ma, Zhiheng Huang, Andrej Karpathy,
 recognition, pages 770–778, 2016. 1, 5 Aditya Khosla, Michael Bernstein, et al. Imagenet large
 [7] Christy Y Li, Xiaodan Liang, Zhiting Hu, and Eric P Xing. scale visual recognition challenge. International journal of
 Knowledge-driven encode, retrieve, paraphrase for medical computer vision, 115(3):211–252, 2015. 1
 image report generation. In Proceedings of the AAAI Confer- [19] R. Venkatesan, S. M. Koon, M. H. Jakubowski, and P.
 ence on Artificial Intelligence, volume 33, pages 6666–6673, Moulin. Robust image hashing. In International Conference
 2019. 3 on Image Processing, 2000. 4
 [8] Zhe Li, Chong Wang, Mei Han, Yuan Xue, Wei Wei, Li-Jia [20] Xiaosong Wang, Yifan Peng, Le Lu, Zhiyong Lu, Mo-
 Li, and Li Fei-Fei. Thoracic disease identification and lo- hammadhadi Bagheri, and Ronald M Summers. Chestx-
 calization with limited supervision. In Proceedings of the ray8: Hospital-scale chest x-ray database and benchmarks
 IEEE Conference on Computer Vision and Pattern Recogni- on weakly-supervised classification and localization of com-
 tion, pages 8290–8299, 2018. 2, 3, 4, 5, 6, 8 mon thorax diseases. In Proceedings of the IEEE Conference
 [9] J. Liu, G. Zhao, Y. Fei, M. Zhang, Y. Wang, and Y. Yu. on Computer Vision and Pattern Recognition, pages 2097–
 Align, attend and locate: Chest x-ray diagnosis via con- 2106, 2017. 2, 5, 6, 8
 trast induced attention network with limited supervision. In [21] Petros-Pavlos Ypsilantis and Giovanni Montana. Learning
 2019 IEEE/CVF International Conference on Computer Vi- what to look in chest x-rays with a recurrent visual attention
 sion (ICCV), pages 10631–10640, 2019. 1, 2, 3, 4, 5, 6, 7, model. arXiv preprint arXiv:1701.06452, 2017. 2
 8 [22] Gangming Zhao, Chaowei Fang, Guanbin Li, Licheng Jiao,
[10] Wei Liu, Dragomir Anguelov, Dumitru Erhan, Christian and Yizhou Yu. Contralaterally enhanced networks for tho-
 Szegedy, Scott Reed, Cheng-Yang Fu, and Alexander C racic disease detection, 2020. 1, 2
 Berg. Ssd: Single shot multibox detector. In European con- [23] Bolei Zhou, Aditya Khosla, Agata Lapedriza, Aude Oliva,
 ference on computer vision, pages 21–37. Springer, 2016. 1, and Antonio Torralba. Learning deep features for discrimina-
 2 tive localization. In Proceedings of the IEEE conference on
[11] Yun Liu, Yu-Huan Wu, Yunfeng Ban, Huifang Wang, and computer vision and pattern recognition, pages 2921–2929,
 Ming-Ming Cheng. Rethinking computer-aided tuberculo- 2016. 2
 sis diagnosis. In Proceedings of the IEEE/CVF Conference
 on Computer Vision and Pattern Recognition, pages 2646–
 2655, 2020. 3
[12] Jonathan Long, Evan Shelhamer, and Trevor Darrell. Fully
 convolutional networks for semantic segmentation. In Pro-
 ceedings of the IEEE conference on computer vision and pat-
 tern recognition, pages 3431–3440, 2015. 1
[13] Adam Paszke, Sam Gross, Soumith Chintala, Gregory
 Chanan, Edward Yang, Zachary DeVito, Zeming Lin, Al-

 9
You can also read