Kangaroo harvest quotas for Victoria, 2021 - D.S.L. Ramsey and M.P. Scroggie December 2020 - Arthur Rylah ...
←
→
Page content transcription
If your browser does not render page correctly, please read the page content below
Kangaroo harvest quotas for
             Victoria, 2021

     D.S.L. Ramsey and M.P. Scroggie

                               December 2020

     Arthur Rylah Institute for Environmental Research
                    Technical Report Series No. 323

     OFFICIAL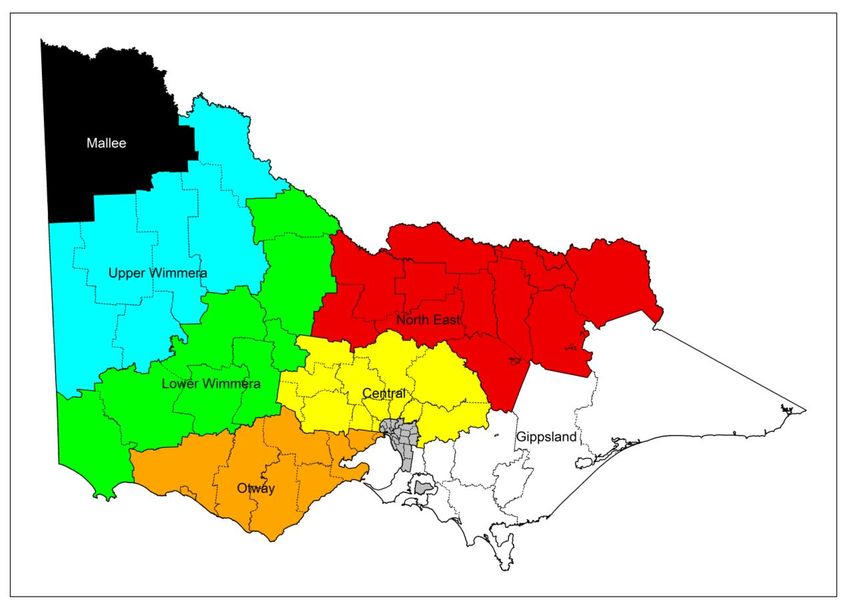
Acknowledgment
We acknowledge and respect Victorian Traditional Owners as the original
custodians of Victoria’s land and waters, their unique ability to care for
Country and deep spiritual connection to it. We honour Elders past and
present whose knowledge and wisdom has ensured the continuation of
culture and traditional practices.
We are committed to genuinely partner, and meaningfully engage, with Victoria’s
Traditional Owners and Aboriginal communities to support the protection of
Country, the maintenance of spiritual and cultural practices and their broader
aspirations in the 21st century and beyond.
Arthur Rylah Institute for Environmental Research
Department of Environment, Land, Water and Planning
PO Box 137
Heidelberg, Victoria 3084
Phone (03) 9450 8600
Website: www.ari.vic.gov.au
Citation: Ramsey, D.S.L. and Scroggie, M.P. (2020). Kangaroo harvest quotas for Victoria, 2021. Arthur Rylah Institute for
Environmental Research Technical Report Series No. 323. Department of Environment, Land, Water and Planning, Heidelberg,
Victoria.
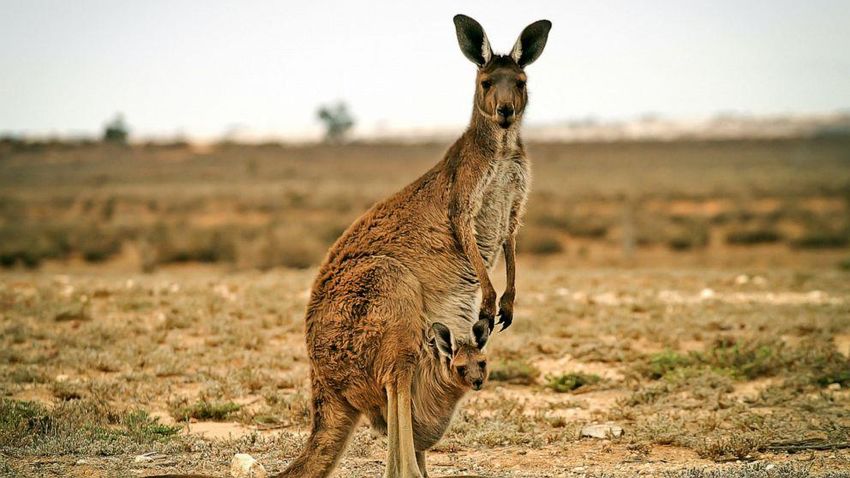
Front cover photo: Western Grey Kangaroo and Joey (Source: Getty Images).
© The State of Victoria Department of Environment, Land, Water and Planning 2020
This work is licensed under a Creative Commons Attribution 3.0 Australia licence. You are free to re-use the work under that licence,
on the condition that you credit the State of Victoria as author. The licence does not apply to any images, photographs or branding,
including the Victorian Coat of Arms, the Victorian Government logo, the Department of Environment, Land, Water and Planning logo
and the Arthur Rylah Institute logo. To view a copy of this licence, visit http://creativecommons.org/licenses/by/3.0/au/deed.en
Edited by David Meagher, Zymurgy SPS
ISSN 1835-3827 (print)
ISSN 1835-3835 (pdf))
ISBN 978-1-76105-394-8 (print)
ISBN 978-1-76105-394-5 (pdf/online/MS word)
Disclaimer
This publication may be of assistance to you but the State of Victoria and its employees do not guarantee that the publicatio n is
without flaw of any kind or is wholly appropriate for your particular purposes and therefore disclaims all liability for any error, loss or
other consequence which may arise from you relying on any information in this publication.
Accessibility
If you would like to receive this publication in an alternative format, please
telephone the DELWP Customer Service Centre on 136 186, email
customer.service@delwp.vic.gov.au or contact us via the National Relay
Service on 133 677 or www.relayservice.com.au. This document is also
available on the internet at www.delwp.vic.gov.au
OFFICIAL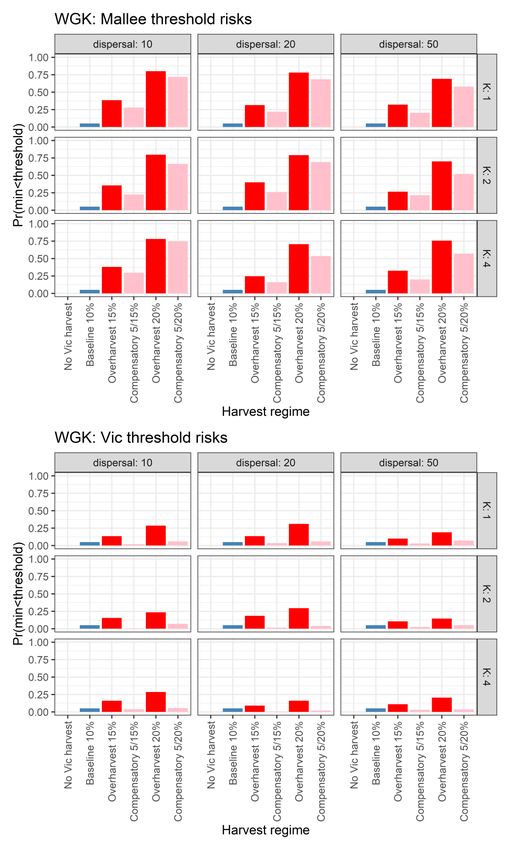
Kangaroo harvest quotas for Victoria,
2021

D.S.L. Ramsey1 and M.P. Scroggie1

1ArthurRylah Institute f or Environmental Research
123 Brown Street, Heidelberg, Victoria 3084

                                                            Date

Arthur Rylah Institute for Environmental Research
Technical Report Series No. 323

Arthur Rylah Institute f or Environmental Research
Department of Environment, Land, Water and Planning
Heidelberg, Victoria

                                                 OFFICIAL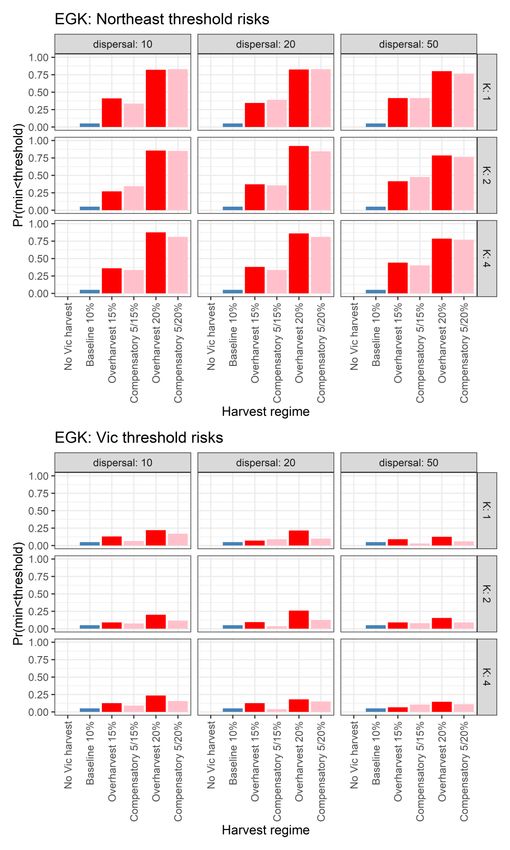
Acknowledgements

We thank Bali Forbes f or providing us with the historical data on the numbers of kangaroos culled under the
Authority to Control Wildlif e (ATCW), which are used in this report .

ii      Kangaroo harvest quotas for Victoria, 2021

Contents

Acknowledgements                                                                                      ii
Summary                                                                                               1
1     Introduction                                                                                    3
2     Methods                                                                                         4

2.1   Kangaroo abundance estimates                                                                    4
2.2   Predicting demand for Kangaroos taken under A TCW permits                                       6
2.3   Sustainability of variable harvest rates among zones                                            6
2.4   Apportioning the quota between the KHP and ATCW permits                                         7

3     Results                                                                                         8

3.1   Kangaroo abundance                                                                              8
3.2   Predicting demand for Kangaroos taken under A TCW permits                                       9
3.3   Sustainability of variable harvest rates among zones                                           12
      3.3.1 Risk analysis f or harvest management of Western Grey Kangaroos in the Mallee harvest
      management zone                                                                                12
      3.3.2 Risk analysis f or harvest management of Eastern Grey Kangaroos in the North East harvest
      management zone                                                                                 12
3.4   Apportioning the quota between the KHP and ATCW permits                                        15

4     Conclusions                                                                                    16

      Recommendations                                                                                16

5     References                                                                                     18

Kangaroo harvest quotas for Victoria, 2021                                                            iii

                                               OFFICIAL
Tables

Table 1. Local Government Areas in each kangaroo aerial survey stratum (harvest zone) in Victoria. .......... 5

Table 2. Simulated harvest scenarios examined using the spatial harvest model. The over-harvest zone is
        Mallee f or Western Grey Kangaroos, and North East f or Eastern Grey Kangaroos. The
        compensatory zones f or Western Greys are Upper and Lower Wimmera, and Central f or Eastern
        Greys. ........................................................................................................................................ 7

Table 3. Kangaroo abundances in seven harvest zones covering the no n-f orested part of Victoria, estimated
        f rom aerial surveys in October 2020. Estimates are rounded to the nearest 50. ............................... 8

Table 4. Recommended total take f or Grey Kang aroos for 2021 by harvest zone. ...................................... 8

Table 5. Predictive accuracy expressed as the mean absolute scaled error (MASE) f or f our models f itted to
        the time series of ATCW permit numbers between 2002 and 2019. Lower values (bolded) indicate
        models with better predictive accuracy. .......................................................................................10

Table 6. The recommended total quota of grey kang aroos f or 2021 compared with the predicted ATCW
        numbers f rom the best f it ARIMA model. The of f take (%) indicates the predicted ATCW numbers in
        2021 as a percentage of the kangaroo abundance in the zone. The 3-year average is the
        equivalent calculation averaged over the last three years (2017–2019). ........................................10

Table 7. Recommended apportioning of quotas for Grey Kangaroos by ATCW and the KHP f or 2021 by
        harvest zone. Values are rounded to the nearest 50. ...................................................................15

Table 8. Alternative recommended apportioning of quotas f or Grey Kangaroos by ATCW and the KHP f or
        2021 by harvest zone, assuming 20% of predicted ATCW control is undertaken through the KHP. ..15

Figures

Figure 1. Kangaroo harvest management zones in Victoria. Each zone is f ormed by amalgamating groups
        of ecologically similar local government areas. The grey shaded areas are not subject to harvest.
        Colour-coding of harvest management areas matches the colours of the tags attached to carcasses
        during commercial harvesting operations...................................................................................... 4

Figure 2. Trends in the abundance of Grey Kangaroos in each harvest zone since aerial surveys began in
        2017. Grey shading indicates 90% conf idence intervals................................................................ 9

Figure 3. Time series of kangaroos taken under ATCW permits f or each harvest zone f rom 2002 to 2019.
        The predicted ATCW numbers f or 2021 (± 90% conf idence interval) are that predicted by the ETS
        model (blue circle and shading) and the ARIMA model (red circle and shading). Data f or 2020 was
        excluded f rom the model fitting because it was incomplete. ..........................................................11

Figure 4. Relative ecological risks f or the f ive harvest management scenarios f or Western Grey Kangaroos
        (WGK) in the Mallee harvest management zone (top), and f or the whole of Victoria (bottom ).

iv                                                                                               Kangaroo harvest quotas for Victoria, 2021

                                                                   OFFICIAL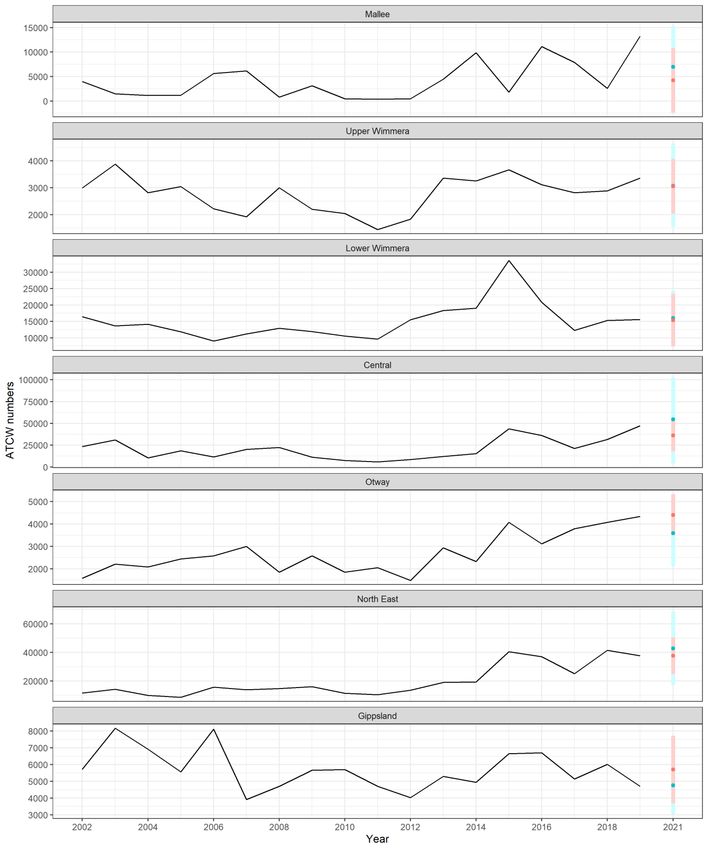
Columns are the estimated probability that the population will drop below the 5% percentile of
        minimums that would be expected under a baseline (10% harvest management scheme). A larger
        magnitude implies a greater relative ecological risk. Each panel provides estimates under dif f erent
        combinations of assumed dispersal rates and carrying capacities f or each of the 6 harvesting
        scenarios. .................................................................................................................................13

Figure 5. Relative ecological risks f or the 5 harvest management scenarios f or Eastern Grey Kangaroos
        (EGK) in the North east harvest management zone (top), and f or the whole of Victoria (excluding
        Gippsland, see methods, bottom). Columns are the estimated probability that the population will
        drop below the 5% percentile of minimums that would be expected under a baseline (10% harvest
        management scheme). A larger magnitude implies a greater relative ecological risk. Each of the
        grid of nine panel provides relative risk estimates under dif f erent combinations of assumed dispersal
        rates and carrying capacities (K) for the 6 harvesting scenarios (see methods). .............................14

Kangaroo harvest quotas for Victoria, 2021                                                                                                          v

                                                                  OFFICIAL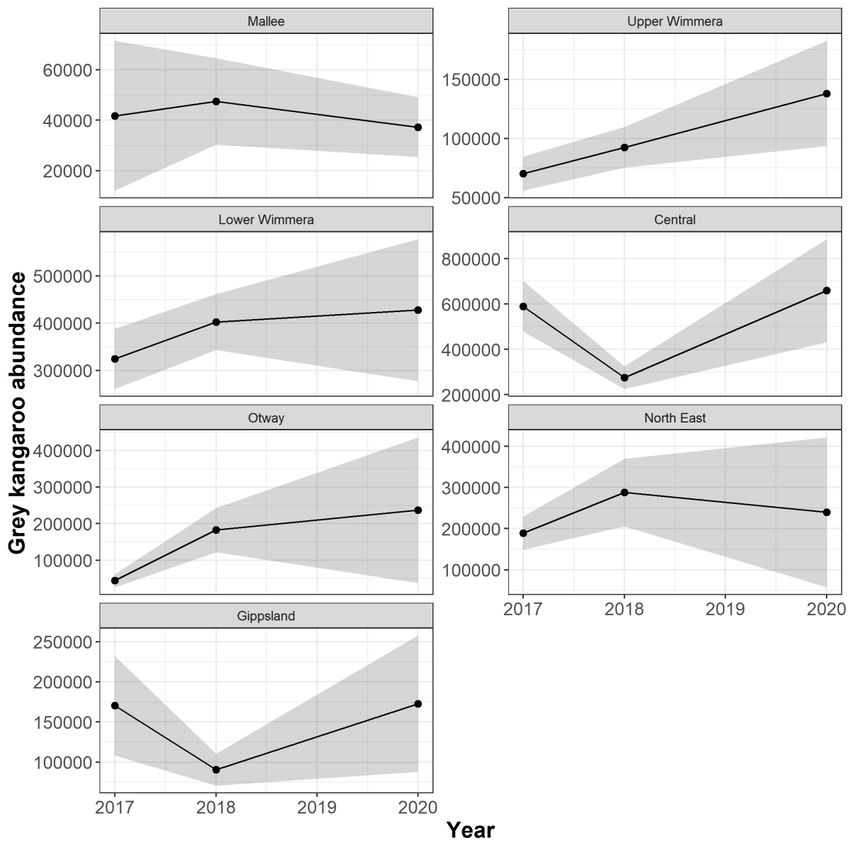
Summary

Context:
The Victorian Government has adopted a policy of supporting ecologically sustainable commercial
harvesting of wild Grey Kangaroo (Eastern Grey Kangaroo, Macropus giganteus and Western Grey
Kangaroo, M. fuliginosus) populations in the state. To support the implementation of this policy, there is a
requirement to set ecologically sustainable harvesting quotas to avoid overexploitation of kangaroo
populations.
Aims:
Using the kangaroo abundance estimates derived f rom the statewide aerial survey conducted in October
2020, recommend a maximum sustainable of f take of Eastern and Western Grey Kangaroos and apportion
the total of f take among the demands f rom the ATCW permit process and the kangaroo commercial harvest
program (KHP).
Methods:
The annual total sustainable quota f or 2021 was assessed as being no more than 10% of the abundance of
each species of grey kangaroo. The predicted demand f or kangaroos authorised through the ATCW permit
process in 2021 was estimated by analysing the histo rical ATCW kangaroo numbers using several time-
series models. The model with the best (training) predictive accuracy was then used to predict the likely
demand f or kangaroo control through ATCW permits in 2021. The total sustainable quota was then
apportioned between the expected demands f or both ATCW permits and the KHP.
Results:
The total sustainable quota f or 2021 was assessed as being 191,200 kangaroos comprising 176,650 Eastern
Grey Kangaroos, and 14,550 Western Grey Kangaroos. Predicted demand f or kangaroos under the ATCW
permit process was estimated to comprise approximately 62% of the total quota f or 2021 comprising 119,400
grey kangaroos. However, demand in the Mallee and North East harvest management zones was predicted
to exceed the recommended sustainable level of take f or those zones. This lef t an allocation of 71,800
kangaroos f or the KHP, af ter adjusting f or the total predicted ATCW demand .
Conclusions and implications:
Kangaroo abundance in 2020 has increased by approximately 41% (95% CI; 22% to 60%) f or Eastern Grey
Kangaroo and 12% (95% CI; –3% to 27%) f or Western Grey Kangaroo across the state, compared with the
2018 aerial survey. However, populations in both the Mallee and North East zones have declined, coinciding
with a recent increased demand f or kangaroo control through ATCW permits in these zones. The level of
of f take in these zones has been greater than the 10% currently recommended as sustainable, and hence the
kangaroo populations in these zones may be at some risk of overharvest if this level of of ftake continues.
Consequently, no KHP quota has been recommended f or the Mallee or the North East zone.

Recommendations:
•   For the 2021 calendar year, a total of 191,200 Grey Kangaroos is recommended as the maximum
    sustainable of f take. This includes kangaroos taken in the commercial harvest program (KHP) and
    through ATCW permits. The sustainable kangaroo of f take in each harvest management zone,
    apportioned between the KHP and ATCW permit process, is shown in Table 7.
•   It would be desirable f or the majority of kangaroos that would otherwise by authorised through ATCW
    permits to be commercially harvested through the KHP, as this would enable more accurate tracking of
    the total take of kangaroos. In addition, increased use of the KHP should lead to less wastage of
    carcases, improved animal welf are outcomes, and economic benef its f or the state’s commercial
    kangaroo harvesters.
•   If a proportion of the kangaroo control predicted to occur under the ATCW system could , instead, be
    carried out by commercial harvesters under the KHP, the KHP quota could be adjusted accordingly,
    while still maintaining a sustainable level of take across the state. An alternative recommended quota
    accounting f or a proportionate transf er f rom ATCW to KHP of 20% is outlined in Table 8.
•   If a proportion of predicted ATCW control is not transf erred to the KHP in the Mallee harvest
    management zone, no commercial harvest is recommended in this zone during 2021 to protect Western

Harvest quotas for kangaroos in Victoria for 2021                                                            1
Grey Kangaroo populations in the region f rom potential overharvesting. Reducing harvest rates f or
Western Grey Kangaroos in the Upper and Lower Wimmera zones will not compensate f or
overharvesting in the Mallee zone, but it will mitigate the risks on the Western Grey Kangaroo population
as a whole.
• If a proportion of predicted ATCW control is not transf erred to the KHP in the North East zone, no
commercial harvest is recommended in this zone f or 2021 to protect Eastern Grey Kangaroos in the
region f rom potential overharvesting. Reducing harvest rates on Eastern Grey Kangaroos in the
adjacent Central zone will not compensate f or overharvest in the North East zone but will mitigate the
risks on the Eastern Grey Kangaroo population as a whole.
• Kangaroos authorised to be taken through the ATCW permit process should be caref ully monitored in
both the Mallee and North East harvest zones to ensure demand does not exceed the maximum
recommended sustainable of f take.
• Accurate and detailed harvest records, including the location, species, sex, and age class of all
harvested kangaroos should be maintained. This is especially important f or the Upper and Lower
Wimmera harvest zones, so that the numbers of harvested Western and Eastern Grey Kangaroos f rom
those harvest zones can be accurately assessed.
2 Kangaroo harvest quotas for Victoria, 2021
OFFICIAL1 Introduction
Victoria’s commercial kangaroo harvesting program (KHP) commenced on 1 October 2019, underpinned by
the regulatory guidelines detailed in the Victorian Kangaroo Harvest Management Plan (DELWP 2020). The
program enables authorised harvesters to take kangaroos f or commercial purposes in designated areas of
Victoria. The commercial take is limited by quotas, set across seven commercial harvesting zones, which
are based on ecologically sustainable criteria (Scroggie and Ramsey 2019). The total allowable of f take of
kangaroos in each harvest zone includes that taken by the KHP (KHP quota) and any kangaroos taken
under the Authority to Control Wildlif e (ATCW) provisions of the Wildlife Act 1975 (Victoria). Under the
ATCW provisions, kangaroos can be legally culled by landholders af ter being issued a permit by DELWP.
To ensure the sustainability of the program, it is essential that the maximum number of kangaroos that are
permitted to be taken under the KHP and ATCW quotas each year is determined on clear ecological criteria,
with administrative and regulatory controls in place to ensure that populations are not overexploited.
Scroggie and Ramsey (2019) developed quotas based on a policy of allowing a maximum harvest f raction of
10% of the estimated kangaroo population in each calendar year. Proportional harvest quotas of 10% were
recommended f or the two kangaroo species that can be harvested in Victoria: Eastern Grey Kangaroo
(Macropus giganteus) and Western Grey Kangaroo (M. fuliginosus).
The total quota is divided between seven harvest management zones, based on the proportion of the total
state population in each zone. Because the quota f or each harvest zone includes both the KHP and ATCW
quotas, the regulatory f ramework needs to include mechanisms f or apportioning the total ecologically
sustainable harvest between these two categories .
The 10% quota recommended by Scroggie and Ramsey (2019) is conservative; quotas in other states are
typically set at 15% (Hacker et al. 2004; McLeod et al. 2004). However, the 10% quota ref lects the
depauperate data on kangaroo population dynamics f rom Victoria in comparison with other states. Most
available data and analyses pertinent to setting kangaroo harvest quotas have been collected f rom
populations of Red Kangaroos (Osphranter rufus), Western Grey Kangaroos and Euros (Macropus robustus)
inhabiting arid and semi-arid ecosystems, including rangeland ecosystems in New South Wales, Queensland
and South Australia, f rom which long time-series of population monitoring data are available (i.e. more than
10 years). These long-term data have been used to construct stochastic population models for assessing
the ecological risks associated with harvesting policies f or arid-zone kangaroo populations (e.g. Caughley et
al. 1987). Such models combine time-series observations of abundance or density of kangaroos with
harvest statistics and data on presumed drivers of kangaroo demography (such as rainf all and pasture
availability) to inf er relationships between the rate at which kangaroo populations increase and spatially and
temporally varying f actors such as density dependence, resource availability and harvest of f take.
A similar model f or examining the ef f ect of spatially varying harvest has been developed f or Grey Kangaroos
in Victoria (Scroggie and Ramsey 2020). However, this model relied on ecological and demographic
inf ormation collected f rom kangaroo populations elsewhere, because of a lack of comparable time-series
abundance data f or kangaroo populations in Victoria. As harvest and abundance monitoring data f rom
Victoria accumulate, the spatial harvest model can be more reliably calibrated to represent the population
dynamics of Victorian kangaroos, which should lead to greater conf idence when using the model f or
management decisions, such as setting quotas. In the meantime, conservative quotas should be retained
until adequate local monitoring data and management experience can be used to inf orm and validate the
spatial harvest model f or Victorian kangaroo populations.
This report presents an analysis to guide the setting of quotas f or both the commercial harvest of kangaroos
and those taken under ATCW permits in Victoria f or the 2021 calendar year. This analysis is based primarily
on the most recent monitoring data f rom the statewide aerial survey of kangaroos. We also used historical
ATCW permit inf ormation to predict the likely demand f or kangaroo permit numbers in 2021 and apportion
the ATCW and commercial quotas f or each harvest zone. In addition, we use the spatial harvest model to
examine the extent to which various levels of harvesting in excess of the nominal 10% quota in a zone (up to
20%) could be of f set by reducing quotas in neighbouring harvest zones .
Kangaroo harvest quotas for Victoria, 2021 3
OFFICIAL2 Methods
2.1 Kangaroo abundance estimates
Moloney et al. (2017; 2018) used aerial survey data collected f rom the non-f orested parts of Victoria (but
including mallee vegetation types) to determine abundances of Red, Western Grey and Eastern Grey
Kangaroos across the entire state. Full details of the survey methodology and interpretation are given in
Moloney et al. (2017), Scroggie et al. (2017) and Moloney et al. (2018). The three kangaroo species are
ref erred to hereaf ter as RK, EGK and WG; GK ref ers to both grey kangaroos combined.
The aerial surveys were designed around seven harvest management zones, with transects allocated
randomly within the zones in proportion to their areas. The boundaries of the zones were f ormed by
amalgamating adjacent local government areas (LGAs) with similar ecological f eatures, land use and climate
(Figure 1, Table 1). Separate estimates of abundance f or RKs and GKs were derived f rom the aerial
surveys. In the west of the state, the geographic ranges of EGKs and WGKs overlap substantially (Caughley
et al. 1984), and as the two species cannot be reliably distinguished f rom the air, the aerial surveys alone did
not allow apportionment of the total grey kangaroo population between the two species . To resolve this
uncertainty, vehicle transect surveys were conducted across the overlap zone to estimate the spatial
variation in the proportions of EGKs and WGKs, allowing the total count of GKs within each of these strata to
be divided between the two species (Moloney et al. 2018). Collectively, the results of these surveys are the
most up-to-date and comprehensive inf ormation on the status of kangaroo populations in Victoria and
provide a robust basis f or determining ecologically sustainable harvest quotas.
Figure 1. Kangaroo harvest management zones in Victoria. Each zone is formed by amalgamating groups of
ecologically similar local government areas. The grey shaded areas are not subject to harvest. Colour-coding
of harvest management areas matches the colours of the tags attached to carcasses during commercial
harvesting operations.
4 Kangaroo harvest quotas for Victoria, 2021
OFFICIALTable 1. Local Government Areas in each kangaroo aerial survey stratum (harvest zone) in
Victoria.
Zone LGAs Zone LGAs
Mallee Mildura Central Ballarat
Upper Wimmera Buloke Brimbank
Hindmarsh Hepburn
Horsham Hume
Swan Hill Macedon Ranges
West Wimmera Melton
Yarriambiack Mitchell
Lower Wimmera Ararat Moorabool
Central Goldf ields Mount Alexander
Gannawarra Murrindindi
Glenelg Nillumbik
Loddon Whittlesea
Northern Grampians Yarra Ranges
Pyrenees North East Alpine
Southern Grampians Benalla
Otway Colac Otway Campaspe
Corangamite Greater Bendigo
Golden Plains Greater Shepparton
Greater Geelong Indigo
Hobsons Bay Mansf ield
Moyne Moira
Surf Coast Strathbogie
Warrnambool Towong
Wyndham Wangaratta
Gippsland Bass Coast Wodonga
Baw Baw
Cardinia
Casey
East Gippsland
Latrobe
Mornington Peninsula
South Gippsland
Wellington
Kangaroo harvest quotas for Victoria, 2021 5
OFFICIALAerial surveys of kangaroos within the seven harvest management zones were undertaken during October
2020 along 150 transects, comprising around 3000 km of survey ef f ort. The abundances of EGKs and
WGKs within each harvest zone were estimated using line transect methods and design-based inf erence;
see Moloney et al. (2018) f or details of the overall method.
2.2 Predicting demand for Kangaroos taken under ATCW permits
To achieve ecologically sustainable kangaroo management, the total number of kangaroos being culled must
be managed, including not only the intended commercial harvest but also any other permitted culling under
ATCW provisions. Because it is not possible to know, at the outset of a harvest period, how many ATCW
applications will be received, the potential demand f or ATCW permits is predicted by analysing the historical
time series of kangaroo numbers authorised f or control under ATCW permits.
Historical numbers of kangaroos authorised f or control under ATCW permit provisions (hereaf ter ATCW
numbers) were available f or each harvest zone f rom 2002 to 2019. Although data f rom 2020 were available
up to 30 October, these were not used f or prediction because they are currently incomplete f or the entire
calendar year.
We modelled the historical time series of ATCW numbers f or each zone using an exponential smoothing
state-space model ETS (Holt 2004) as well as an autoregressive integrated moving average (ARIMA) model
(Hyndman and Athanasopoulos 2019). Both models attempt to f ind trends in the time series f or the purpose
of f orecasting (predicting) into the f uture. Exponential smoothing models weight observations , with weights
decaying exponentially with time. Hence the ETS models place greater weight on more recent observations .
ARIMA models employ both autoregressive and moving average components f or smoothing and prediction.
We f itted both ETS and ARIMA models to the time series of ATCW numbers and examined their relative
predictive accuracy by examining the mean absolute scaled error (MASE) of the f itted models (Hyndman and
Athanasopoulos 2019). The best model f or each zone was then used to predict the likely number of
kangaroos authorised under ATCW p ermits f or the 2021 calendar year.
2.3 Sustainability of variable harvest rates among zones
One possible means of mitigating the impacts of undesirably high rates of harvesting in some of the
kangaroo harvest management zones would be to reduce the rate of harvesting in adjacent zones . Under
such a regime, the overall rate of harvesting would not exceed the recommended sustainable rate when
considered over the whole state, although the rate(s) could still be higher than the recommended 10% in the
f ew zones where over-harvesting was occurring. We explored the implications of such compensatory
harvesting regimes using a modif ied version of the existing stochastic spatial harvest model f or Victorian GK
populations (Scroggie and Ramsey, 2020).
The most important innovation in the model used here, compared to the model described by Scroggie and
Ramsey (2020), is that EGKs and WGKs are accounted f or separately by placing each species in its own
sub-model. This was considered essential f or the current analysis, primarily because compensatory under-
harvesting to of f set over-harvesting elsewhere must logically be applied to the same species of kangaroo.
For example, if WGKs are over-harvested in the Mallee harvest zone, then a compensatory harvest scheme
can only be considered justif iable in those zones where WGKs occur, which in Victoria limits compensatory
under-harvesting of WGKs to the Upper and Lower Wimmera harvest zones.
A similar argument applies to the situation with over-harvesting in the North East harvest management zone,
which is occupied exclusively by EGKs. Compensatory under-harvesting to of f set this over-harvest could
only be considered justif iable if it was implemented in other harvest zones containing signif icant proportions
of EGKs.
An additional consideration is that part of the likely mechanism by which compensatory under-harvest can
of f set localised over-harvest is by the dispersal of kangaroos into a harvest management zone where over-
harvesting has occurred. For this reason, we only considered scenarios in which the compensatory under-
harvesting was conducted in zones adjacent to those being over-harvested. For WGKs in the Mallee, these
were the Upper and Lower Wimmera harvest management zones, and f or EGKs in the North East, the
compensatory under-harvest was applied to the Central harvest management zone. As dispersal of
kangaroos over the Great Dividing Range f rom the Gippsland harvest management zone was considered
implausible, the Gippsland zone was excluded f rom consideration in the model of EGK populations
considered here.
Models representing some representative harvest regimes were run in order to estimate and compare
resulting ef f ects on ecological risks (Table 2). For all scenarios, GK populations in adjacent New South
Wales and South Australia were harvested at a f ixed rate of 15%. A baseline scenario f or Victoria involved
6 Kangaroo harvest quotas for Victoria, 2021
OFFICIALharvesting at 10% in all zones. Two over-harvest scenarios were considered, with harvesting at rates of 15
or 20% in a single zone (Mallee or North East) without compensatory reductions elsewhere, while two
compensatory scenarios considered reductions in harvest rate in zones adjacent to the over-harvested
zones (Upper and Lower Wimmera, Central) to 5% (Table 2).
Table 2. Simulated harvest scenarios examined using the spatial harvest model. The over-
harvest zone is Mallee for Western Grey Kangaroos, and North East for Eastern Grey
Kangaroos. The compensatory zones for Western Greys are Upper and Lower Wimmera,
and Central for Eastern Greys.
Scenario Overharvest Compensatory Rest of Victoria Interstate
Zone Zone(s) (NSW/SA)
1. No Vic harvest — — — 15%
2. Baseline 10% 10% 10% 10% 15%
3. Overharvest 15% 15% 10% 10% 15%
4. Compensatory (5/15%) 15% 5% 10% 15%
5. Overharvest 20% 20% 10% 10% 15%
6. Compensatory (5/20%) 20% 5% 10% 15%
The assumed population vital rates in the models were the same as those described by Scroggie and
Ramsey (2020). A moderate 20% value f or environmental stochasticity in the vital rates was assumed. As
compensatory population dynamics are partially dependant on the dispersal of kangaroos f rom under-
harvested to over-harvested areas, we considered three alternative scales of dispersal to assess sensitivity
of the model to this parameter. Dispersal was theref ore modelled using an exponential dispersal kernel, with
scale parameters of 10, 20 and 50 km. Knowledge regarding carrying capacities (and hence density -
dependent population dynamics) f or Victorian kangaroo populations is very limited, and the dynamics of the
spatial harvest model are known to be highly sensitive to assumptions about carrying capacity (Scroggie and
Ramsey, 2020). We theref ore considered three alternative carrying capacities, based on the carrying
capacity being 1, 2 and 4 times the spatialised estimates of GK abundance in Scroggie and Ramsey (2020).
The model described by Scroggie and Ramsey used square grid cells, each 50 50 km. As the model
presented here requires f iner spatial resolution to determine expected population trajectories within individual
harvest zones, we altered the structure of the model to reduce the cell size to 25 25 km. While this
ref inement allows more spatially accurate predictions of abundance, it comes at the cost of a greater
computational burden, resulting in signif icantly increased execution times f or the model.
For each combination of species (EGK or WGK), dispersal (10, 20 or 50 km) and carrying capacity (1, 2 or 4
times current abundance) we ran 200 stochastic population simulations over 50 years. For each simulation
the minimum abundance of the population was recorded as a measure of ecological risk , on the basis that
regular excursions into low abundance states are indicative of high risks of population extinction. These
simulated minimums were recorded both f or the total Victorian population (but excluding Gippsland f or
EGKs), and f or the populations within the over-harvested zones (Mallee and North East).
To assess the relative risk, we f irst calculated the 5th percentile of population minimums under the currently
recommended 10% harvest rate (based on 200 stochastic simulations) as a baseline measure of ecological
risk. For all remaining harvest scenarios, we then estimated the proportion of stochastic population
trajectories that had minimum abundances less than this baseline. This approach enabled comparisons of
relative ecological risk to be made across the various scenarios, thereby allowing assessments of risk
relative to the intended baseline harvest rate of 10% Victoria-wide.
2.4 Apportioning the quota between the KHP and ATCW permits
Once the predicted demand f or kangaroos authorised under the ATCW permit process was estimated, the
total recommended sustainable of f take of WGK and EGK f or 2021 was apportioned between the predicted
ATCW demand and the KHP by subtracting the predicted ATCW demand f rom the total quota. Where the
predicted demand exceeded the recommended total level of take, the resulting KHP quota was reduced to
zero. The KHP allocation was then f urther revised to ensure the total of ftake (KHP + ATCW) did not exceed
the total recommended sustainable of f take f or the state.
Kangaroo harvest quotas for Victoria, 2021 7
OFFICIAL3 Results
3.1 Kangaroo abundance
The abundance estimates f or the three kangaroo species in each harvest zone during 2020 are given in
Table 3, these being derived by aggregation of the LGA-level results presented in Moloney et al. (2020).
The trends in kangaroo abundance since aerial surveys began in 2017 indicates that kangaroo populations
have generally increased since the last survey in 2018 with an approximate 41% (95% CI; 22% to 60%)
increase in EGK and a 12% (95% CI; –3% to 27%) increase in WGK, across the state. However,
populations in the Mallee and North East zones have exhibited slight declines since 2018 (Figure 2). Based
on these estimates, the annual quota f or GKs f or 2021, using a maximum proportional of ftake of 10%, is
given in Table 4.
Table 3. Kangaroo abundances in seven harvest zones covering the non-forested part of
Victoria, estimated from aerial surveys in October 2020. Estimates are rounded to the
nearest 50.
Harvest Zone Red Kangaroo Eastern Grey Western Grey Grey
Kangaroo Kangaroo Kangaroos
Combined
Mallee 30,450 4,550 32,750 37,300
Upper Wimmera 65,300 72,800 138,100
Lower Wimmera 387,800 39,900 427,700
Central 658,950 658,950
Otway 236,950 236,950
North east 239,850 239,850
Gippsland 172,700 172,700
Statewide Total 30,450 1,766,100 145,450 1,911,550
Table 4. Recommended total take for Grey Kangaroos for 2021 by harvest zone.
Totals include all predicted culling under both ATCW and commercial harvesting allocations f or the period
1st January to 31st December 2021. Quotas are set at 10% of the population per annum and are rounded to
the nearest 50.
Harvest Zone Eastern Grey Western Grey Grey Kangaroos
Kangaroo Kangaroo Combined
Mallee 450 3,250 3,700
Upper Wimmera 6,550 7,300 13,850
Lower Wimmera 38,800 4,000 42,800
Central 65,900 65,900
Otway 23,700 23,700
North east 24,000 24,000
Gippsland 17,250 17,250
Statewide Total 176,650 14,550 191,200
8 Kangaroo harvest quotas for Victoria, 2021
OFFICIALFigure 2. Trends in the abundance of Grey Kangaroos in each harvest zone since aerial surveys began in 2017. Grey shading indicates 90% confidence intervals. 3.2 Predicting demand for Kangaroos taken under ATCW permits Based on the MASE accuracy measure, the ARIMA model including both autoregressive and moving average components was generally the pref erred model f or ATCW numbers having better predictive accuracy than the ETS model (Table 5). However, the ETS model had better predictive accuracy f or ATCW numbers in the Mallee and North East zones. To capture model uncertainty, we used model averaged estimates f rom both the ETS and ARIMA models (with equal weighting) to predict ATCW demand in 2021 (Figure 3). However, predictions were rather imprecise f or some zones (Fig ure 3). Generally, numbers of kangaroos predicted to be taken under ATCW permits are lower than the total quota f or each zone, with the exception of the Mallee and North East zones where ATCW numbers are predicted to be around 15% and 17% of the population, respectively (Table 6). These predictions are similar to the average of f take observed over the last three years as a percentage of the average population abundance (Table 6). Harvest quotas for kangaroos in Victoria for 2021 9
Table 5. Predictive accuracy expressed as the mean absolute scaled error (MASE) for four
models fitted to the time series of ATCW permit numbers between 2002 and 2019. Lower
values (bolded) indicate models with better predictive accuracy.
           Zone                ETS                ARIMA
          Mallee               0.83                 0.85
     Upper Wimmera             1.04                 0.87
     Lower Wimmera             0.97                 0.76
         Central               0.99                 0.87
          Otway                0.79                 0.60
       North East              0.86                 0.94
       Gippsland               0.74                 0.71

Table 6. The recommended total quota of grey kangaroos for 2021 compared with the
predicted ATCW numbers from the best fit ARIMA model. The offtake (%) indicates the
predicted ATCW numbers in 2021 as a percentage of the kangaroo abundance in the zone.
The 3-year average is the equivalent calculation averaged over the last three years (2017–
2019).
 Zone                Total quota    Predicted   Offtake (%)   Offtake (%)
                                    ATCW                      3-year average
 Mallee                     3,700       5,543        14.9           18.7
 Upper Wimmera             13,850       3,051         2.2            3.0
 Lower Wimmera             42,800      15,729         3.7            3.7
 Central                   65,900      45,487         6.9            6.6
 Otway                     23,700       3,997         1.7            2.6
 North East                24,000      40,304        16.8           14.5
 Gippsland                 17,250       5,243         3.0            3.7
 Total                   191,200      119,353         7.0            6.5

10                                                                  Kangaroo harvest quotas for Victoria, 2021

                                                OFFICIAL
Figure 3. Time series of kangaroos taken under ATCW permits for each harvest zone from 2002 to 2019. The predicted ATCW numbers for 2021 (± 90% confidence interval) are that predicted by the ETS model (blue circle and shading) and the ARIMA model (red circle and shading). Data for 2020 was excluded from the model fitting because it was incomplete. Kangaroo harvest quotas for Victoria, 2020 11
3.3     Sustainability of variable harvest rates among zones
3.3.1    Risk analysis for harvest management of Western Grey Kangaroos in the Mallee
         harvest management zone
Estimates of relative ecological risk of the various harvest management scenarios f or Western Grey
Kangaroos in Victoria are given in Figure 4. For the Mallee harvest management zone only (top panel of
Figure 4), it is apparent that both overharvesting regimes (15 and 20%, red columns) have markedly higher
relative ecological risks than the baseline 10% harvest regime (blue column). When compensatory under-
harvesting (5%) was applied in the adjacent Upper and Lower Wimmera harvest zone, ecological risks f or
the Mallee population were reduced somewhat (pink columns), but still remained markedly higher than was
the case under a baseline 10% harvest scenario.
When the entire Victorian population of WGKs was considered (rather than the Mallee population alone),
relative ecological risks were lower f or all scenarios (Figure 4, bottom panel). However, the overharvesting
scenarios (15% and 20% overharvest in the Mallee) still entailed a higher risk of the population going below
the threshold abundance, relative to the baseline 10% harvesting scenario . When compensatory under-
harvesting (5 %) was applied in the Upper and Lower Wimmera zones the risks to the populations as whole
were substantially mitigated (pink columns).
Collectively, these results provide some tentative support f or the notion that under-harvesting in the Upper
and Lower Wimmera could of fset the impacts of overharvesting in the Mallee on the entire population of
WGKs in Victoria. However, when the Mallee population of WGKs is considered in isolation, it would seem
that compensatory under-harvesting in adjacent zones has little impact on ecological risk. This suggests that
compensatory under-harvesting of WGKs in Victorian would f unction mainly to increase abundance of WGKs
in the zones where under-harvesting is implemented (Upper and Lower Wimmera), but would do little to limit
the reduction in abundances that would be expected in the over-harvested (Mallee) zone itself .

3.3.2    Risk analysis for harvest management of Eastern Grey Kangaroos in the North East
         harvest management zone
Results of a comparable risk analysis f or EGKs in the North East harvest management zone are presented in
Figure 5. For the North East zone only (top panel of Figure 5), it is apparent that risks of population
trajectories f alling lower than would be expected under the baseline 10% harvest rate are substantially
higher f or both overharvest (15% and 20%) scenarios (red columns). These added risks were not ef f ectively
mitigated by the imposition of a compensatory (5%) under-harvest in the adjacent Central zone (pink
columns). Across all assumed values of dispersal and carrying capacity parameters, ecological risk was not
substantially inf luenced by the assumed dispersal rate or carrying capacity of the EGK population.
Conversely, when considering the entire Victorian population of EGKs (but excluding the Gippsland zone;
see methods), overharvest (15 or 20%, Figure 5, bottom panel, red bars) in the North East zone led to
relatively small increases in ecological risk relative to a baseline constant harvest scenario at a rate of 10%
(blue bars). This risk was somewhat mitigated when compensatory under-harvesting at a rate of 5% was
applied in the Central zone (Figure 5, bottom panel, pink bars).
Collectively, the results of this risk analysis demonstrate some limited capacity f or compensatory
overharvesting in adjacent zones to reduce ecological risks f or harvested populations of both species of grey
kangaroos when the Victorian populations are considered in their entirety. However, the results also show
that heightened ecological risks to the population in an overharvested management zone can continue in
that zone and cannot be ef f ectively mitigated by compensatory under-harvesting in an adjacent zone.

12                                                                      Kangaroo harvest quotas for Victoria, 2021

                                                   OFFICIAL
Figure 4. Relative ecological risks for the five harvest management scenarios for Western Grey Kangaroos (WGK) in the Mallee harvest management zone (top), and for the whole of Victoria (bottom). Columns are the estimated probability that the population will drop below the 5% percentile of minimums that would be expected under a baseline (10% harvest management scheme). A larger magnitude implies a greater relative ecological risk. Each panel provides estimates under different combinations of assumed dispersal rates and carrying capacities for each of the 6 harvesting scenarios. Kangaroo harvest quotas for Victoria, 2020 13
Figure 5. Relative ecological risks for the 5 harvest management scenarios for Eastern Grey Kangaroos (EGK)
in the North east harvest management zone (top), and for the whole of Victoria (excluding Gippsland, see
methods, bottom). Columns are the estimated probability that the population will drop below the 5% percentile
of minimums that would be expected under a baseline (10% harvest management scheme) . A larger magnitude
implies a greater relative ecological risk. Each of the grid of nine panel provides relative risk estimates under
different combinations of assumed dispersal rates and carrying capacities (K) for the 6 harvesting scenarios
(see methods).

14                                                                       Kangaroo harvest quotas for Victoria, 2021

                                                    OFFICIAL
3.4 Apportioning the quota between the KHP and ATCW permits
Based on the calculation of the total quota f or grey kangaroos f or each harvest zone (Table 3) and the
expected demand f or ATCW permits in each zone f or 2021 (Table 6 and Figure 2), the total quota was
apportioned between the KHP and ATCW permit system (Table 7). Due to the high expected demand f or
ATCW permits in the Mallee and North East harvest zones, (which exceeds the total quota in these zones),
the KHP quota has been reduced to 0 in these zones. The KHP was also reduced in other zones to ensure
that the total of f take (KHP + ATCW) did not exceed the total quota f or the state.
Table 7. Recommended apportioning of quotas for Grey Kangaroos by ATCW and the KHP
for 2021 by harvest zone. Values are rounded to the nearest 50.
Harvest Zone Total Quota Predicted ATCW KHP quota
Mallee 3,700 5,550 0
Upper Wimmera 13,850 3,050 9,000
Lower Wimmera 42,800 15,750 22,700
Central 65,900 45,500 16,400
Otway 23,700 4,000 15,700
North east 24,000 40,300 0
Gippsland 17,250 5,250 8,000
Subtotals 119,400 71,800
Statewide Total 191,200
If a proportion of the kangaroo control predicted to occur under the ATCW system could , instead, be carried
out by commercial harvesters under the KHP, the KHP quota could be adjusted accordingly, while still
maintaining a sustainable level of take across the state. An alternative recommended quota accounting f or a
proportionate transf er f rom ATCW to KHP of 20% is outlined in Table 8.
Table 8. Alternative recommended apportioning of quotas for Grey Kangaroos by ATCW
and the KHP for 2021 by harvest zone, assuming 20% of predicted ATCW control is
undertaken through the KHP.
Harvest Zone Total Quota Adjusted ATCW Adjusted KHP quota
prediction
Mallee 3,700 4,440 1,110
Upper Wimmera 13,850 2,440 9,610
Lower Wimmera 42,800 12,600 25,850
Central 65,900 36,400 25,500
Otway 23,700 3,200 16,500
North east 24,000 32,240 8,060
Gippsland 17,250 4,200 9,050
Subtotals 95,520 95,680
Statewide Total 191,200
Kangaroo harvest quotas for Victoria, 2020 154 Conclusions
Compared with the estimates f rom the previous aerial survey in 2018, kangaroo abundance in 2020 is
greater, with an approximate 41% (95% CI; 22% to 60%) increase in EGK and a 12% (95% CI; –3% to 27%)
increase in WGK across the state. However, changes in abundance varied across harvest zones , with
populations in both the Mallee and North East zones declining f rom the 2018 estimates . Coincidently, these
are also the two zones where historical and predicted ATCW of f take, as a proportion of estimated
abundance, has been greatest.
Over the previous f our years, since the start of kangaroo aerial surveys, the number of kangaroos authorised
on ATCW permits amounted to an average of f take of 14.5% and 18.7% of the populatio ns in the North East
and Mallee zones, respectively. This level of offtake is greater than the 10% currently recommended as
sustainable, and hence the kangaroo populations in these zones are at risk of overharvest ing. Continued
of f take at these levels could lead to lower population levels in the f uture (Scroggie and Ramsey 2020). This
issue may be more acute f or the Mallee zone, which contains a large proportion of the Victorian WGK
population. We have theref ore recommended that no KHP quota be issued f or 2021 f or the Mallee and
North East zones (Table 7). However, assuming that 20% of the kangaroo control predicted under the
ATCW system was instead undertaken by commercial harvesters under the KHP, some KHP quota may be
allocated to these zones (Table 8). Regardless of which recommended quota is adopted (Table 7 or 8), the
quota allocation across all zones has been adjusted to ensure that the total take across the state remains
sustainable. The overall 2021 KHP quota is considerably higher than the 2020 quota, ref lecting the overall
higher kangaroo abundance.
In f uture, it would be desirable f or the majority of kangaroos that would otherwise b e culled under ATCW
permits to be commercially harvested through the KHP, as this would enable more accurate tracking of the
total take of kangaroos. In addition, increased use of the KHP should lead to less wastage of carcases,
improved animal welf are outcomes, and economic benef its f or the state’s commercial kangaroo harvesters.
However, it is acknowledged that the KHP is a new program that is still maturing in Victoria, and landholder
awareness of this option is low. We theref ore recommend that the KHP be encouraged and promoted as an
alternative option to landholders f or kangaroo control.
Risk analyses of scenarios where harvest rates greater than 10% were permitted in some zones, with
compensatory reductions in harvesting (5%) in adjacent management zones, has demonstrated that
compensatory under-harvesting can help to reduce the risks of population decline f or Victorian populations of
both species of Grey Kangaroo as a whole. However, it is important to recognize that this approach runs the
risk of causing potentially unacceptable depletions in the abundances of Grey Kangaroos within the zones
that are subjected to higher rates of harvesting (15 or 20%), even if the strategy limits the depletion of the
populations as a whole. These risks are only slightly mitigated by reducing harvest rates in adjacent zones,
even when the assumed rates of dispersal between harvest management zones are at the higher end of the
plausible range.
Such risks (regional population depletion) must be considered more serious f or populations of Western Grey
Kangaroos, which are at the edge of their geographic range in the north-west of the state and thus have
much more limited capacity f or recovery in the event of population depletion through over harvesting .
Recommendations
• For the 2021 calendar year, a total of 191,200 Grey Kangaroos is recommended as the maximum
sustainable of f take. This includes kangaroos taken in the commercial harvest program (KHP) and
through ATCW permits. The sustainable kangaroo of f take in each harvest management zone,
apportioned between the KHP and ATCW permit process, is shown in Table 7.
• It would be desirable f or the majority of kangaroos that would otherwise by authorised through ATCW
permits to be commercially harvested through the KHP, as this would enable more accurate tracking of
the total take of kangaroos. In addition, increased use of the KHP should lead to less wastage of
carcases, improved animal welf are outcomes, and economic benef its f or the state’s commercial
kangaroo harvesters.
• If a proportion of the kangaroo control predicted to occur under the ATCW system could , instead, be
carried out by commercial harvesters under the KHP, the KHP quota could be adjusted accordingly,
while still maintaining a sustainable level of take across the state. An alternative recommended quota
accounting f or a proportionate transf er f rom ATCW to KHP of 20% is outlined in Table 8.
16 Kangaroo harvest quotas for Victoria, 2021
OFFICIAL• If reallocation of a proportion of predicted ATCW control to the KHP cannot occur in the Mallee harvest
management zone, no commercial harvest is recommended in this zone during 2021 to protect Western
Grey Kangaroo populations in the region f rom potential overharvesting . Reducing harvest rates f or
Western Grey Kangaroos in the Upper and Lower Wimmera zones will not compensate f or
overharvesting in the Mallee zone, but it will mitigate the risks on the Western Grey Kangaroo population
as a whole.
• If reallocation of a proportion of predicted ATCW control to the KHP cannot occur in the North East zone,
no commercial harvest is recommended in this zone f or 2021 to protect Eastern Grey Kangaroos in the
region f rom potential overharvesting. Reducing harvest rates on Eastern Grey Kangaroos in the
adjacent Central zone will not compensate f or overharvest in the North East zone but will mitigate the
risks on the Eastern Grey Kangaroo population as a whole.
• Kangaroos authorised to be taken through the ATCW permit process should be caref ully monitored in
both the Mallee and North East harvest zones to ensure demand does not exceed the maximum
recommended sustainable of f take.
• Accurate and detailed harvest records, including the location, species, sex, and age class of all
harvested kangaroos should be maintained . This is especially important f or the Upper and Lower
Wimmera harvest zones, so that the numbers of harvested Western and Eastern Grey Kangaroos f rom
those harvest zones can be accurately assessed .
Kangaroo harvest quotas for Victoria, 2020 175 References
Caughley, G., Brown, B., Dostine, P., and Grice, D . (1984). The grey kangaroo overlap zone. Wildlife
Research 11, 1–10.
Caughley, G., Shepherd, N., and Short, G. (1987). Kangaroos, their ecology and management in the sheep
rangelands of Australia. (Cambridge University Press: Cambridge, UK.)
DELWP (2020). Victorian Kangaroo Harvest Management Plan. Department of Environment, Land, Water
and Planning, Victorian Government, Melbourne. Available at:
http://agriculture.vic.gov.au/__data/assets/pdf_f ile/0011/495029/Kangaroo -harvest-management-plan-
2020.pdf ?v=2
Hacker, R., Mcleod, S., Druhan, J., Tenhumberg, B., and Pradhan, U. (2004). Kangaroo management
options in the Murray–Darling Basin. (Murray–Darling Basin Commission: Canberra, Australia).
Holt, C. C. (2004). Forecasting seasonals and trends by exponentially weighted moving averages .
International Journal of Forecasting 20, 5–10.
Hyndman, R., and Athanasopoulos, G. (2019). Forecasting: principles and practice. 3rd edition. (OTexts:
Melbourne, Australia.) Available at: https://otexts.com/fpp3/arima-ets.html
McLeod, S. R., Hacker, R. B., and Druhan, J. P. (2004). Managing the commercial harvest of kangaroos
in the Murray–Darling Basin. Australian Mammalogy 26, 9–22.
Moloney, P. D., Ramsey, D. S. L., and Scroggie, M. P. (2017). A state-wide aerial survey of kangaroos in
Victoria. Arthur Rylah Institute f or Environmental Research Technical Report Series No . 286.
Department of Environment, Land, Water and Planning, Heidelberg, Victoria.
Moloney, P. D., Scroggie, M. P., and Ramsey, D. S. L. (2018). Revisiting the Victorian kangaroo aerial
survey design. Unpublished Client Report. Arthur Rylah Institute f or Environmental Research.
Department of Environment, Land, Water and Planning, Heidelberg, Victoria.
Scroggie, M. P., and Ramsey, D. S. L. (2019). Kangaroo harvest quotas f or Victoria, 2020. Arthur Rylah
Institute f or Environmental Research Technical Report Series No . 308. Department of Environment,
Land, Water and Planning, Heidelberg, Victoria.
Scroggie, M. P., and Ramsey, D. S. L. (2020). A Spatial Harvest Model f or Kangaroo Populations in
Victoria. Arthur Rylah Institute f or Environmental Research Technical Report Series No . 315.
Department of Environment, Land, Water and Planning, Heidelberg, Victoria.
Scroggie, M. P., Moloney, P. D., and Ramsey, D. S. L. (2017). Design of an aerial survey to estimate the
abundance of kangaroos in Victoria. Arthur Rylah Institute f or Environmental Research Technical
Report No. 280. Department of Environment, Land, Water and Planning, Heidelberg, Victoria.
18 Kangaroo harvest quotas for Victoria, 2021
OFFICIALwww.delwp.vic.gov.au www.ari.vic.gov.au
You can also read