INFRASTRUCTURE IN GREECE - FUNDING THE FUTURE - PWC
←
→
Page content transcription
If your browser does not render page correctly, please read the page content below
Infrastructure in
Greece

Funding the future

May 2019
Content overview

    1        Executive          2   Infrastructure
             summary                investment
                                                     The
                                                     investment
    3        Greek              4   Funding of       gap in Greek
             infrastructure         Greek            infrastructure
             projects               infrastructure
             pipeline               projects         is about

    5        Conclusion         6   Appendices

                                                        0.7pp of
                                                           GDP
Infrastructure in Greece 2018                                    May 2019
PwC                                                                    2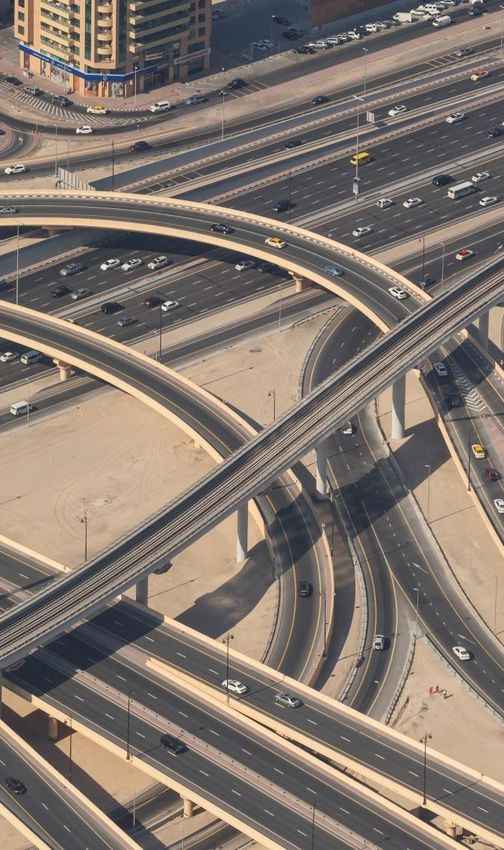
1
       Executive
    summary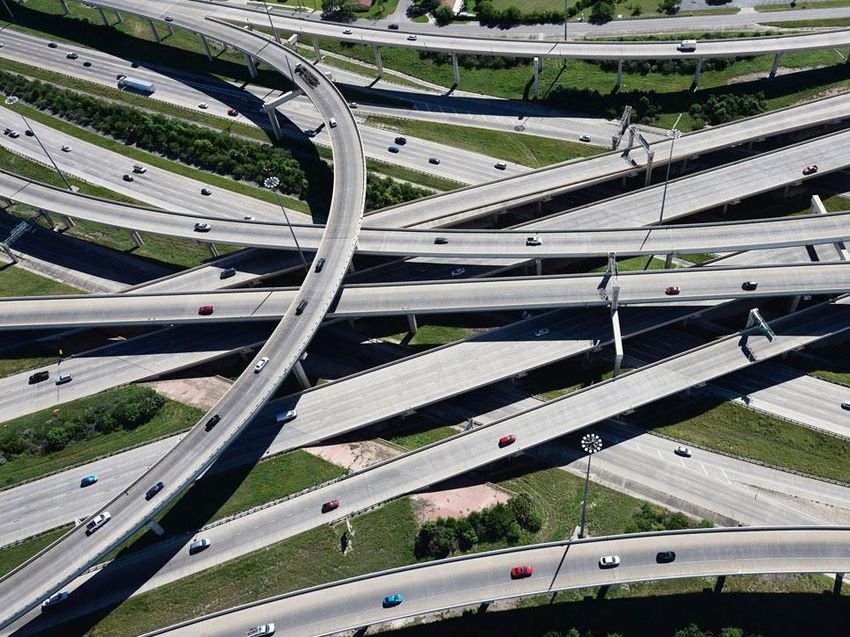
Executive Summary (1/2)
Funding the future

•     Global infrastructure needs are expected to reach around $
      80trln by 2040                                                       € 25bn total infrastructure budget
                                                                           Infrastructure work in progress and upcoming projects
•     Greece ranks 38th globally and 21st among the EU countries in
      terms of infrastructure
•     There is an infrastructure investment gap between 0.7pp of
      GDP (against the European average) translating into an
      average spending shortage of € 1.4bn per year
                                                                                                       Waste Management
•     Infrastructure investments have an economic multiplier of 1.8x,
                                                                                              Rail         3.88%
      which boosts demand across the economy
                                                                                                  10.41%
•     The infrastructure pipeline, i.e. projects in progress or prepared
      but not yet funded, amounts to 88 projects with a budget of €
      25bn
                                                                            Urban Rail                                                  Energy
•     The pipeline is higher than in the past due to the completion of                                                         43.12%
                                                                                         19.79%
      lower cost projects and the addition of higher cost ones in the
      preparation phase
•     € 10.6bn of the budget refers to Energy projects, while € 7.4bn
      to Railways and € 4.3bn to Motorways. Tourist infrastructure
      and Waste management projects account for a small part of the
                                                                                                     17.57%
      remaining budget taking up only about € 1.3bn and € 0.9bn                                                    5.23%
      respectively                                                                         Motorways
                                                                                                                     Tourism Infrastructure
•     The infrastructure pipeline is concentrated (63%) on electricity
      interconnection and generation and urban rail
•     The current project portfolio is heavy on energy and transport
      but short on connectivity, tourism and the environment
                                                                           Source: Press, PwC calculations

                                                                                                                                          May 2019
PwC                                                                                                                                              4
Executive Summary (2/2)

 •     Infrastructure projects in Greece suffer from systematic
       slippage both in preparation and execution, with an          Estimated Completion year (cumulative)
       average 23 months of slippage in preparation/design          Number of projects
       and 28 months of slippage in execution/construction.
       Possible delay factors range from government and
       contractor issues to general and environmental
       problems
 •     Possible delays in execution will lead to a loss of                Planned        In progress        55   56
                                                                                                       54
       investment of around € 4bn by 2024 with a 0.8pp p.a.                                       52
       negative impact on GDP, which makes more imperative
       for the government to move the backlog of € 8.2bn, in                               42          17   18   19
                                                                                                  15
       the planning stage, forward
 •     There should be a single state organisation mandated                         35      8

       with the planning, design and management of all major                        4                                       32 projects are
       infrastructure projects to reduce delays and maximise                                                                in early design
       private funding                                                       23                                             phase with no
 •    Accelerating the preparation of projects and minimizing                                     37   37   37   37
                                                                                                                            announced
      slippage requires better coordination across the whole         13             31
                                                                                           34                         32    commencement
      process and full use of concessionary and private                                                                     and completion
                                                                             22
                                                                                                                            dates yet
      funding                                                        13
 •    The growing need for infrastructure spending, combined
      with the limited capacity of state funding and the balance    2019 2020 2021 2022 2023 2024 2025 2026           N/A
      sheet constraints of the Greek banks call for new
      sources of funding. Traditional funding sources, such as      Source: Press, PwC calculations

      loan facilities and the Public Investment Program are
      limited, shifting the financing focus to the private sector
                                                                                                                                 May 2019
PwC                                                                                                                                    5
2
     Infrastructure
    investment
Definition of infrastructure

 • “Infrastructure is the system of public works in a country, state or region, including roads, utility lines and
   public buildings”
      OECD
 • “Infrastructure is “the basic framework for delivering energy, transport, water & sanitation and information &
   communication technology (ICT) services to people affecting directly or indirectly their lives”
      World Bank

                                                                             In the study, we have included projects with
                                                                             regards to transport (airport, ports, roads &
                                                                             rail), energy (electricity, oil & gas) as well
                                                                             as water & sewage, whilst ICT and Social
                                                                             Infrastructure (e.g. Hospitals, Schools,
                                                                             Public Buildings, Sport Structures and
                                                                             Green Areas) have been excluded

                                                                             Information & Communications Technology,
                                                                             according to the World Bank, refers to
                                                                             physical telecommunications systems and
                                                                             networks (cellar, broadcast, cable, satellite,
                                                                             postal) and the services that utilize them
                                                                             (internet, voice, mail, radio, and television)

                                                                                                                   May 2019
PwC                                                                                                                      7
Sustainable Development Goals (SDGs)
17 SDGs focusing mainly on 6 investment areas addressing poverty and universal
development

In 2015, 193 UN Member                   Investment areas
States adopted the
Sustainable Development                    1. Health                                                  In the long-term, infrastructure
Goals (SDGs) to be                                                                                    investment can jolt economic
achieved by 2030 in order                  2. Education                                               growth by increasing the potential
                                                                                                      supply capacity of an economy
to build sustainable
economic growth                            3. Social Protection
                                           4. Food Security and
                                                   Sustainable
                                                   Agriculture                                        1. Energy access and low-carbon
                                                                                                         energy infrastructure

                                           5. Infrastructure                                          2. Water and Sanitation
                                                                                                      3. Transport infrastructure

                                           6. Ecosystem Services                                      4. Telecommunications
                                                                                                         infrastructure

              Source: Transforming our world: the 2030 Agenda for Sustainable Development, UN, 2015
                                                                                                                                      May 2019
PwC           Source: Investment Needs to Achieve the Sustainable Development Goals, UN, 2015                                               8
Global infrastructure could require up to $ 80trln of
 investment by 2040
 In the period 2018-2040, 3.2% of global GDP                  Traditional funding sources are no longer
 needs to be invested in water infrastructure, road           enough to cover the rapid increase in
 & rail transportation, airports and ports, energy            infrastructure projects, which are expected to
                                                              reach $ 3.5trln p.a. until 2040

                                                                             Road
                                                                   31.6      Rail
                                                                             Airports & Ports                3.2%
                                                                   10.6
                                                                   4.6

                                                                Transport

                                                                  1.9%
                                                                                                             79.6

                                                                                                1.1%
                                                                 46.8

                                            0.2%                                                26.7

                                            6.0

                                          Water               Transport                   Energy*            Total

                                              Infrastructure needs ($trln)                 % of Global GDP

                                     Source: Global Infrastructure Outlook, Oxford Economics
                                                                                                                     May 2019
PwC                                                                                                                        9
Infrastructure extent and quality index
   Greece ranks low relatively to its global peers

          Infrastructure index (scale:0-100*)                                                                                                            The infrastructure index captures the quality
          Greece                                                                                                                                         and extent of transport and utility infrastructure
 100
                                                                                                                   98
                                                                                                                   98
                                                                                                                                       91
                                                                                                                                       91                Transport Infrastructure
                 76                                                         74
                                                                            74
                                                                                                                                                             I.   Road
                76                                                                                                                                                 • Quality of road network
                                    65
                                    65                                                                                                                             • Quality of road infrastructure
                                                                                               56
                                                                                               56                                                            II. Rail
                                                                                                                                                                   • Railroad density
                                                        38
                                                        38                                                                                                         • Efficiency of train services
                                                                                                                                                             III. Air
                                                                                                                                                                   • Airport connectivity
                                                                                                                                                                   • Efficiency of transport services
                                                                                                                                                             IV. Sea
    0                                                                                                                                                              • Shipping connectivity***
                 Total             Roads              Railroads        Air Transport      Water Transport       Electricity           Water                        • Efficiency of seaport services
            Infrastructure
                                                                                                                                                         Utility infrastructure
           Source: The Global Competitiveness Report 2018
          * Indices are expressed on a 0 to 100 scale and are interpreted as “progress scores”, indicating how close a country is to the ideal state         I.  Electricity
                                                                                                                                                                   • Electricity access
                                                                                                                                                                   • Electricity quality
          Ranking in infrastructure (140 countries)                                                                                                          II. Water
                                                                                                                                                                   • Exposure to unsafe drinking water
  Best
performer
                                                                                                                                                                   • Reliability of water supply
                Singapore          Singapore          Switzerland            Japan             Singapore         6 countries**        Switzerland
  (1st)
                                                                                                                                                       *** For landlocked countries, this indicator is not included in the
Greece            38th              49th                49th                 26th                30th               47th                31st              computation and the Sea component score only corresponds to
                                                                                                                                                          the score of “Efficiency of seaport services”

                                                                                                                                                                                                         May 2019
          **Finland, Hong Kong, Iceland, South Korea, Luxembourg,
  PwC                                                                                                                                                                                                            10
          Singapore
There are two statistically distinct levels of
infrastructure extent and quality, whose difference
cannot be explained by the level of GDP
Infrastructure Index 2018
93
92 Netherlands
Greece ranks 38th
globally and21st among the EU
countries in terms of infrastructure, revealing also a
91
90
Group 1 Germany France
quality gap for the current level of GDP per capita 89
88 United Kingdom Austria
Spain
87 Belgium
86 Denmark
85 Sweden
84
Τhe differences in In Greece, the average 83 Italy
Finland
Czech Republic
infrastructure extent and infrastructure investment 82
81
quality between Western level during 2009-2018 80
Quality gap
and Northern European corresponded to only 14% 79 Poland
Slovakia
78 Slovenia
countries, compared to the of GDP, lowest among all 77 Hungary
Central and Eastern E.U. countries, 76 Greece
Ireland Croatia Estonia
75
European countries, cannot undermining country’s 74
Lithuania
be explained by the level of upcoming infrastructure 73 Latvia
72
relative investment quality Romania
71
70
Group 2
Bulgaria
Infrastructure investments, 69
measured through the Gross 68
67
Fixed Capital Formation 66
(GFCF), appear to have a 65
different impact on 12% 14% 16% 18% 20% 22% 24% 26%
infrastructure quality in
Gross Fixed Capital Formation / GDP
each group
Source: World Economic Forum - The Global Competitiveness
Report 2018, BMI
Infrastructure in Greece 2018 May 2019
PwC 11There is a systematic investment gap of 0.7pps of GDP (or ca. € 1.4bn
p.a.) in Greek infrastructure over the past 10 years
Infrastructure investment*
Infrastructure in Greece has The erosion of infrastructure
EU avg (2009-2018): 2.1% been severely affected by the investment from 2009 to 2018
deep recession. Total value of resulted in a € 13bn permanent
€ 12.6bn investment shortage between 2009-2018 infrastructure projects has shortage** against the EU average
2.9 3.1
3.1
1.6% 1.6% decreased by as much as 29%
2.8 2.7 after 2009 but has rebounded The infrastructure investment gap is
Greek avg 2.6
(2009-2018) 1.3% 2.4 2.3 2.4 1.5% since between 0.7 pp of GDP (against the
2.2 1.4% 1.4%
1.4% European average) or 1.6 pp of GDP
1.2% 1.2% 1.2% 1.2% The current rate of (against pre-crisis levels)
infrastructure investment is
around 1.4% of GDP, falling Infrastructure investments in Greece
short of the historical pre crisis have an economic multiplier of
average of 3.0% and the around 1.8x***. The industry
European average of 2.1% of employs ca 875k people
GDPInsert
2009 2010 2011 2012 2013 2014 2015 2016 2017 2018e text
Infrastructure industry value (€ bn) Infrastructure industry value (% of GDP)
Source: BMI International
Greece’s pre-crisis rate (2000-2008): Greece’s historic rate (2009-2018): European rate (2009-2018):
3.0% 1.4% 2.1%
BMI Infrastructure Investment incudes: Transport Infrastructure (Roads, Bridges, Railways, Airports, Ports and Waterways) and Energy & Utilities (Power Plants, Transmission Grids, Oil & Gas, Pipelines and
Water infrastructure)
*Infrastructure Investment data is derived from GDP by output figures from ELSTAT. Specifically, it measures the output of the Infrastructure industry over the reported 12-month period in nominal values. As it is
derived from GDP data, it is a measure of value added within the industry , hence it does not measure the nominal value of all inputs used in the infrastructure industry
** Infrastructure gap= (European Average-Greek Average) * Years(2009-2018)*Average Greek GDP(2009-2018)
***for every Euro spent on infrastructure, GDP is further increased by € 0.8 (IMF Working paper “The welfare multiplier of Public Infrastructure Investment, 2016) May 2019
PwC 12There is need for more investment in infrastructure
• There is a large need for further • The quality of infrastructure in
infrastructure investment globally over the Greece is substantially inferior
next 22 years, estimated at $ 3.5trln per annum or than the level of wealth would predict
3.2% of global GDP
• The need for infrastructure
• The average annual level of infrastructure investments in Greece in terms
investment in Greece between 2009 and 2018 of both capacity expansion and
stands at € 2.6bn, 54% lower than the historical quality improvement is evident
average of 2000-2008
• In Greece, there is a systematic infrastructure
investment gap of ο.7pps of GDP (ca. € 1.4bn
p.a.) or about € 12.6bn in total, over the past 10
years
May 2019
PwC 133 Greek
infrastructure
projects
pipelineBetween 2014 and 2018, 35
infrastructure projects were
completed totaling € 8.3bn
Budget of completed projects
(2014-2018)
Motorway Projects
Water & Sewage
Energy Projects
6.2% Energy Interconnection Projects
85.3%
1.7% 3.8% Rail Projects
1.5% Tourist product upgrading
1.4%
Source: Press, PwC calculations
Number of completed projects
14
9
6
4
2
2014 2015 2016 2017 2018
Source: Press, PwC calculations
Infrastructure in Greece 2018 May 2019
PwC 1532
Infrastructure projects pipeline amount to € 25bn
Most of energy and rail projects are in progress, 5 waste Rail, energy and motorways require higher investment
management projects are about to be delivered, while per project, compared to tourist infrastructure and waste
tourist product projects are still in initial development management projects
stage
Pipeline budget* breakdown Estimated Completion year (cumulative) 33% of the pipeline budget
Number of projects represents projects that
Planned 54 55 56 have already commenced
51 projects Planned 52
66% In progress 15% of the projects, with a
42 17 18 19
15
35 32 projects are remaining budget of around
8
4 in early design €0.5bn, are estimated to be
23 phase with no delivered in 2019
In progress announced
37 projects 13
31 34 37 37 37 37
32 commencement The commencement/
34% 22
and completion completion dates of 32
13
dates yet projects in early planning
2019 2020 2021 2022 2023 2024 2025 2026 N/A phase, with a € 8.2bn
budget, are unknown
Source: Press, PwC calculations Source: Press, PwC calculations
May 2019
PwC *Infrastructure projects backlog and total budget of upcoming projects 16Higher infrastructure pipeline
mainly due to completion of
lower cost projects and
addition of higher cost new
ones in the preparation phase
Evolution of 5-year infrastructure pipeline
(2014-2018)
€ 25bn
€ 20bn € 21bn € 21bn
€ 19bn From 2014 to 2016 the
40.4% 37.1% 66.1%
42.1%
46 projects 48 projects 34 projects 40.5% 51 projects work in progress
37 projects
investment remained
62.9%
fairly stable but in 2017
57.9% 59.6% 59.5%
24 projects 30 projects 35 projects
38 projects 33.9% and 2018 dropped due to
37 projects
completion of a number
2014 2015 2016 2017 2018 of projects and no new
Planned projects Projects in progress commencements
Source: PwC calculations
Infrastructure in Greece 2018 May 2019
PwC 17Energy and urban rail projects
account for 63% of the total
budget
Total remaining budget*
Waste Management
Rail
3.88%
10.41%
• Waste management and water
supply get very little attention
Urban Rail 19.79%
43.12%
Energy
• Rail, given its current low
economic significance, gets a
disproportionate share (10.4%)
Motorways 17.57%
5.23%
Tourism Infrastructure
*Infrastructure backlog and total budget of upcoming projects
Source: Press, PwC calculations
Subsector & project budget • There are 19 Energy projects
(43% of total pipeline budget)
€ 4.9bn Transportation Energy Water & Waste
30 mainly in oil & gas and
Management
€ 5.6bn electricity
17
• 30% of the remaining budget
€ 3.4bn
Urban Rail
€ 2.5bn
covers rail projects (17
€ 2.3bn
Rail 5 11 projects), while 18% (13
€ 2.6bn 3
7 7 € 0.2bn € 0.0bn projects) motorways
€ 0.4bn
€ 0.9bn 2 1
Rail Airports Transit Energy Oil and Hydroelectric Solar Waste Water
Transport, Natural Gas / Wind Management Supply
Ports
Infrastructure in Greece 2018 Source: Press, PwC calculations Total Budget Number of projects May 2019
PwC 18Energy projects amount to
ca. € 10.6bn
Estimated Completion year (cumulative) Number of
Number of projects projects with no
13
announced
4 commencement/
9 completion dates
7 2
6
5
9
7 7
1 5
1
2019 2020 2021 2022 2023 N/A
Planned In progress
Source: Press, PwC calculations
• 63% of the number of • 62% of the remaining
energy projects are budget is earmarked for
interconnections (TAP, energy interconnections
IGB, EuroAsia, Ariadne, and the rest for
LNGs), while the remaining electricity generation
37% refers to electricity
• Almost half of the
generation (Wind parks,
total energy projects
Power plants)
have not yet started
Infrastructure in Greece 2018 May 2019
PwC 1932
Electricity interconnection projects account for 40% of
the budget and generation for 38%
Energy projects Electricity generation sources
Remaining budget 2018 (€ bn) % of remaining budget 2018
10,588
Gas Interconnectors
(TAP/IGB)
1,213 12.5% • The electricity interconnectors take up
7.0% about 40% of the outstanding budget
Electricity
4,260 4.7%
Interconnectors • About 67% of the total remaining budget
42.8% of scheduled electricity generation
Electricity projects refers renewable energy and in
generation 4,023 33.0% particular wind
LNG terminals
Other
• The average cost per new MW installed
655
Fuel/Lignite Hybrid (Hydro & Wind) is about € 1.1mn
437 Wind Solar
Remaining Budget(€ mn) Hydro May 2019
PwC 20
Source: Press, PwC calculations Source: Press, PwC calculationsBulgaria Bulgaria
Albania Energy projects
geographical
distribution
• Trans-Adriatic Pipeline of 878 km in total will
supply Europe with natural gas from
Azerbaijan through Greece, Albania and Italy,
with a capacity of 20 bn m³ per annum
• Ptolemaida V Power Plant: New single
lignite power plant of 660 MW and 140 MW for
district heating (PPC)
• Attica – Crete and Peloponnese – Crete
Interconnectors: 310 km underwater electric
cable connecting Crete with mainland with a
capacity of 1,000 MW and 400MW
respectively
Cyprus
• IGB: Natural gas pipeline of 182km length will
connect the Greek and Bulgarian existing
networks, with daily transport capacity of
Alexandroupoli approximately 3-5bcm per year
TAP Wind power plants
Independent
Natural Gas System • Alexandroupoli Independent Natural Gas
Electricity
Interconnectors Ptolemaida V Power Kavala storage facility System: New offshore LNG with 28 km length
of Cyclades Plant (lignite fired) (Underground Storage facility) of subsea and onshore pipeline (4 km
onshore and 24 km offshore), with storage
IGB Amfilohia Hydro- Siteia and Rethymno Hybrid capacity of 170k m³ and pumping capacity of
pumped storage Stations
Development of 6,1bcm per year
distribution of
natural gas network Gas Compressor Solar parks • Kavala LNG: Floating storage (170k m³ LNG
Station (Kipoi) capacity) and processing terminal (annual
Electricity Mytilineos power plant sent-out capacity of 3-5bcm) at Kavala Bay
Interconnectors Kavala LNG
May 2019
PwC 21Rail projects amount to € 7.4bn, with
66% on urban rail projects
Estimated Completion year (cumulative)
Number of projects Number of
14 projects with no
13 13 13
announced
4 commencement/
10 3 3 3
1
completion dates
8
3
9 10 10 10 10
3
2 7
3
2
2019 2020 2021 2022 2023 2024 2025 2026 N/A
Planned In progress
Source: Press, PwC calculations
• 35% of the rail projects account to • The percentage of electrified lines in
urban rail interconnections (Attiko Greece is only 24% compared to the
Metro, Tram, Metro Thessaloniki), European average of 54%
while the remaining 65% to rail projects (International Union of Railways,
• More than half of the rail projects 2017). However, Greece is making
have already started with further Attiko progress in rail electrification by
Metro and Thessaloniki Metro converting and adding about 740km of
extensions and some Ergose upgrades electrified lines to the national network
in planning
• 2 rail projects are expected to be
delivered in 2019, the Tithorea-
Domoko rail line and the Athens Tram
extension to Piraeus
May 2019
PwC 2232
Urban rail account for the bulk of the investment expenditure in
rail
• 34% of the remaining budget
Rail projects and Urban Rail projects Urban Rail projects accounts to rail projects, while the
Remaining budget breakdown (€ bn) Remaining budget breakdown (€ bn) remaining 66% to urban rail
7.4 • Attiko Metro’s new lines and
0.7% extensions are the largest urban rail
Rail Projects 2.6 projects, with a total budget of €
31.4% 3.3bn taking up about 68% of the
remaining budget of the urban rail
projects
67.9% • The average investment in railway
Urban Rail Projects 4.9 projects is estimated at € 5.9mn/km,
while the respective investment in
urban railways stands at
Attiko Metro Metro Thessaloniki Athens Tram €112.4mn/km
Source: Press, PwC calculations Source: Press, PwC calculations May 2019
PwC 23Attica Rail projects
geographical
distribution
• Construction of Metro in Thessaloniki and
extension to Kalamaria (14.3km) serving 315k
passengers per day
• The new Metro Line 4 in Athens with 33km
length (31 new stations) is expected to serve
around 500k passengers daily, especially at
densely populated areas (Kipseli, Pagrati,
Zografou)
• Extension of Athens metro to Piraeus (6
new stations) connecting the Athens
International Airport with the Port of
Piraeus will increase current capacity to 123k
passengers
• Tram extension from N. Faliro to Piraeus
(5.3km) will have a daily capacity of 100k
Thessaloniki passengers
ERGOSE ERGOSE
Metro Rhododafni Upgrade of Athens Train • Construction of double rail tracks and
Station
ERGOSE upgrading of signaling and electrification of
ERGOSE Polikastro ERGOSE Volos the main OSE network to improve customer
Palaiofarsalos
service and time of travel rendering rail an
ERGOSE Tithorea- Attiko Metro Line 4 efficient alternative for long distance travel
Upgrade of the network
Domoko
in Sepolia
• The construction and electrification of the
Athens Tram Extension Connection of the Port Attiko Metro, Extension of Kiato to Patras will connect Athens to Patras
N. Faliro to Piraeus of Kavala Line 3 to Piraeus and Northern Peloponnese again after a long
ERGOSE time
Thessaloniki-Kavala-
Promachonas
Xanthi May 2019
PwC 24Motorways investment
pipeline is about € 4.3bn
Number of
projects with no
announced
Estimated Completion year (cumulative)
commencement/
Number of projects completion dates
7
6 6
6
2
1 1
4
6
2 5 5 5
4
1
2
1
2019 2020 2021 2022 2023 2024 N/A
Planned In progress
Source: Press, PwC calculations
• After the completion of many • The total motorway
large motorway projects in 2017, kilometers of planned and in
the only major road projects in the progress projects in Greece
pipeline are the Crete Northern amount to 867km, of which
highway, the southern and only 14% has already been
northern parts of E65 and the constructed
Patras-Pyrgos link
• The average cost of
• One of the largest projects that motorway construction in
was announced in 2018 was the Greece is €14.6mn per km
Crete Northern highway, with a
total length of 300km and the
projected delivery date is 2024 May 2019
PwC 25Motorway projects
Egnatia
Odos
geographical
distribution
• Egnatia Odos vertical Axes will connect
the main part of Egnatia Odos with Bulgaria
and Serres with Drama and Kavala
• Ionia Odos side Axis, with a length of
48.5km will connect Aktio to Amvrakia
• The relative cost of construction of major
motorways per km is estimated at
€6.4mn/km, while the respective European
average stands at €11.6mn/km
(Infrastructure Journal, 2010)
• The Northern and Southern parts of the
Central Greece Motorway (part of E65
Katerini Ring Underwater
Road tunnels
Motorway) are under construction with a
total length of 175km and will connect
Vertical axes of Kalo Nero –
Egnatia Odos Tsakona road Lamia, Karditsa and Trikala with Egnatia
axis Odos.
Average delays in road investment projects
Crete Northern Motorway Ε65 Number of months from planned completion • The Patras-Pyrgos Motorway is a physical
Highway extension of Olympia Odos with a total
Vertical axis of Patras-Pyrgos length of 75 km and will establish a better
Motorway
Ionia Odos connection between the two cities
Aktio-Amvrakia
Thessaloniki –
Circumvention 16 • Crete Northern highway is one of the
of Chalkida
Doirani Road 11 largest projects that was announced in
Axis 7 2018, with a total length of 300km
Circumvention
Kalamata- of Lagkadia 3
Methoni road axis
Greece Spain Germany Poland
May 2019
PwC source: ECA, Are EU Cohesion Policy funds well spent on roads? (2013), PwC analysis 26For the upgrading of the
tourist product around € 1.3bn
have been scheduled
Number of
Estimated Completion year (cumulative) projects with no
Number of projects announced
commencement/
completion dates
14
9
8
7 7
6 3
2
5 1 1
4
6 6 6 6 6
5
4
2019 2020 2021 2022 2023 2024 2025 N/A
Planned In progress
Source: Press, PwC calculations
• 61% of the tourist infrastructure projects are not even fully
planned except from the new dock at the Port of Thessaloniki
and Kasteli airport which are scheduled to be completed by
2022 and 2025 respectively
• There is no information on the construction of the key marinas
(Katakolo & Zakynthos, Alimos hub, Glyfada hub, Patra hub,
Chios hub, Crete hub, Pylos hub and Aretsou Kalamarias hub)
except for the marina of Symi which was delivered in 2018
• The average budget for tourist infrastructure amounts to
€77.6mn per project
May 2019
PwC 27Tourist
infrastructure
geographical
distribution
• Greece is a significant global tourist
destination, attracting 30mn arrivals in
2018, and € 16bn in tourist receipts
• Despite being a global tourist attraction, the
tourist infrastructure quality in Greece is of
low quality
• For Greece to remain a top global tourist
destination it is necessary to:
o complete the upgrade of the 14
regional airports acquired by the
Slentel-Fraport joint venture and
upgrade the second wave of airport
privatizations as well as the construction
of the new airport in Kasteli
o upgrade vital ports to serve as transit
terminals and facilitate interconnection
with neighbor countries
Regional Airports (Joint venture Athens International Airport Small o modernise key marina hubs (Alimos,
Slentel-Fraport) expansion Kalamaria, Chios, Crete, Glyfada,
Marinas Upgrade Metropolitan Water Airport (Port of Zakynthos & Katakolo, Patra, Pylos and
Thessaloniki) Rhodes & Kos) to meet the increasing
Ports Upgrade demand in marine tourism
Kasteli Airport
Marina of Nafplio
May 2019
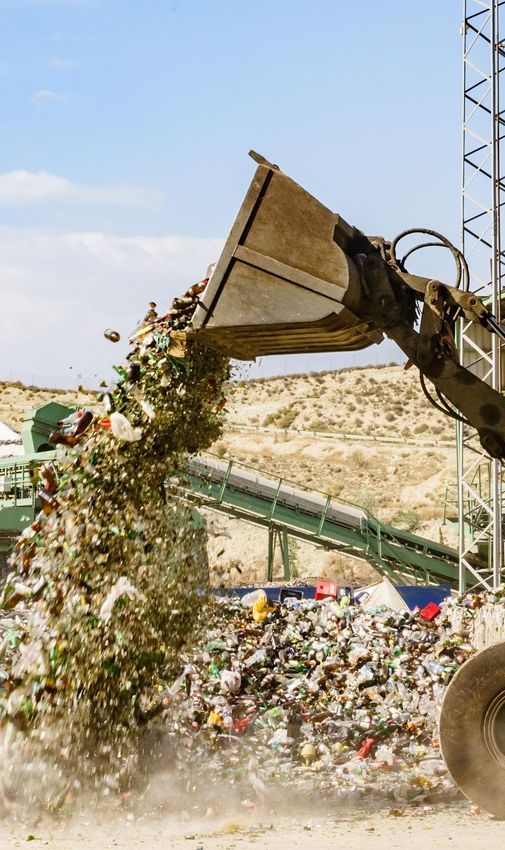
PwC 28Waste management projects
need about € 0.9bn
Estimated Completion year (cumulative)
Number of
Number of projects 13 projects with no
announced
commencement/
10 10
6 completion dates
8 3 3
1
5
7 7 7 7 3
5
2019 2020 2021 2022 2023 N/A
Planned In progress
Source: Press, PwC calculations
• Within 2018, 2 PPPs were signed for waste management projects in
Alexandroupoli and Peloponnese and 1 more is expected to be signed
in Aitoloakarnania
• Also, 5 waste management projects are expected to be completed in
2019 (Grammatiko, Serres, Voiotia, Epirus and the water pipeline of
Aegina)
• The average budget of waste management projects amounts to € 69mn
per project
May 2019
PwC 29Waste Management (Serres) Waste Management
(Alexandroupoli)
Waste management
projects
Waste Management (Ipirus)
Waste Management (Kerkyra)
Waste Management
(Grammatiko)
geographical
Waste Management
Aetoloakarnania
distribution
Municipal waste treatment (2017)
Waste Management (Voiotia)
Switzerland 47% 31% 22% 0%
Sweden 53% 31% 15% 0%
Denmark 53% 27% 19% 1%
Διαχείριση αποβλήτων (Αχαΐα) Germany 32% 49% 18% 1%
Belgium 43% 34% 20% 1%
Finland 59% 27% 13% 1%
Netherlands 44% 26% 28% 1%
Διαχείριση αποβλήτων (Ηλεία) Austria 39% 26% 32% 2%
Luxembourg 44% 28% 21% 7%
United Kingdom 39% 27% 17% 17%
Waste Management France 36% 24% 19% 22%
(Peloponnisos) Waste Management EU - 28 29% 30% 17% 24%
(Rhodes) Italy 21% 30% 22% 26%
Lithuania 19% 24% 24% 33%
Water Pipeline Aegina Centers of Sewage Treatment (Koropi- Poland 24% 27% 7% 42%
Paiania, Rafina - Artemida& Czechia 17% 27% 7% 48%
Marathonas)
Hungary 16% 27% 8% 49%
Portugal 21% 18% 50%
Spain 13% 15% 54%
Slovakia 10% 9% 61%
• In 2015, an updated national waste management plan was adopted which defines the Bulgaria 3% 8% 62%
Croatia 0% 2% 75%
strategy, the policy and the targets of waste management on a national level and also the Greece 1% 4% 80%
Cyprus 0% 2% 82%
general obligations and appropriate measures for the treatment of waste. The National Malta 7% 0% 93%
Waste Management Plan contains sufficient information on criteria for site identification and
Incinerated Composted
on the capacity of future disposal or major recovery installations, on the existing waste
collection schemes and major disposal and recovery installations as well as for the waste Recycled Landfilled
prevention programmes Source: Eurostat
• Regional Management Plans have already been published dealing with an analysis of the current waste management situation as well as the
measures to be taken, providing for an adequate and integrated network of disposal installations. The landfill sites or major waste treatment sites
should be mentioned in the regional waste management plan. However, the specific future sites are not mentioned, so local conflicts arise
• The number of illegal landfills that are still operational or in need of rehabilitation has fallen over the years. However, according to the
European Commission’s 2018 ‘Early Warning Report’, Greece is at risk of not meeting the 2020 municipal waste recycling target of 50%
• On urban waste-water treatment there have been some positive steps, such as the systematic assessment and strategic reorganisation of the
country’s investment needs. These efforts should lead to the necessary infrastructure being installed quickly
PwC 30The current project portfolio is heavy on energy and
transport and short on non electricity connectivity,
tourism and the environment
• The transport and energy sectors account for almost
• The value of 88 infrastructure projects in 91% of the pipeline of all projects and the smooth
progress or planned is standing at € 25bn evolution of those investments will have a very positive
impact in economy
• Projects in progress account for 33% of
estimated investment
• Investments in tourism product upgrade (5%), as well as
• For 39% of the projects, commencement and in waste management and water supply (4%) are
completion dates are not known important for tourism growth and the upgrade of life
quality
May 2019
PwC 314 Funding
Greek
infrastructureInfrastructure
funding and • Projects should be assessed not only on their initial capital investment but
also on the operational cost, maintenance, disposal and value-for-money
project delays across the asset lifecycle
• A poorly designed project may lead to delivery delays, higher costs and
lower financial returns
• Project risk management has to be a core element of project selection,
planning, and design, and it has to be continuous across the entire life
cycle of the project
May 2019
PwC 3332
Infrastructure projects suffer from
systematic slippage both in preparation
and execution
Number and budget of delayed projects
28 months slippage* in 23 months slippage** in
execution/construction preparation
€ 16.0bn
€ 13.2bn
• The average delay of a from
planned commencement is 23
€ 9.6bn 51 months, while their completion
projects date is pushed back on average
37
projects by 28 months
25
projects • On average, at the outset, a
€ 5.0bn project is likely to be 51 months
6 late from its initial completion date
projects
In progress Upcoming
Delayed Projects Total projects Average delay (months)
Projects in progress have already started construction but their completion date has been delayed
Upcoming projects are in the stage of planning or bidding and there is a commencement/completion date
Projects in early planning have not published yet a commencement/completion date
*Average delay in months from the initial completion date until the date a project in our database was officially delivered
**Average delay in months from the initial commencement date until the date a project in our database officially
commenced construction May 2019
The database captures projects since 2014
PwC 3432
Possible delays will reduce
infrastructure spending by as much as
€ 3.8bn in the period to 2024
Remaining budget (in € bn)
8.2
4.9
4.4 • The delays will reduce for the first
3 years the average annual
3.1
investment to 1.2% of GDP from
an expected 2.2%
2.4 2.4 2.4 2.2
1.8 1.6
• € 8.2bn of pipeline are in the
1.2 1.1 planning phase and need to be
1.0 0.8
0.6 assigned a commencement date
0.4 0.3
0.2 0.1 0.0 0.0 0.0 0.1 0.0 0.1
2023
2025
2019
2020
2021
2022
2024
2026
2027
2028
2029
2030 N/A
Remaining budget without delays
Remaining budget with delays*
Budget of projects that have not published commencement/completion dates
*Remaining budget with delays was calculated by applying the delays to each project and then recalculating
each project’s remaining budget
May 2019
PwC 35The current active pipeline, with no delays, is above the
historic rate of infrastructure investment by around € 4bn
€ 15.8bn
€ 12.3bn In planned and work in
progress pipeline
Expected historic rate of without assumed
infrastructure investment delays for the period
for the period 2019 - 2024 2019-2024
If delays are factored in, the investment
over 2019-2024 drops to € 11.9bn with a
lag of around € 4bn. Delays in the
execution of the current pipeline may
undercut GDP growth by ca. 0.8pp
Infrastructure in Greece 2018 May 2019
PwC 3632
Infrastructure investment slippage and
slow preparation undercut economic
growth and demand a different
approach
Commencement and
completion delays to be
contained
Single preparation
mechanism
The current backlog of
infrastructure projects
includes €8.2bn of Full use of
projects in advanced concessionary and
planning stages which private funding
need to move to
execution mode
May 2019
PwC 3732
Unified project planning will reduce delays and facilitate
funding and project control
• There should be a single state organisation mandated with the planning, design and management of all major infrastructure projects
(e.g.> € 20mn) to reduce delays and maximise private funding, as per Special Secretariat of PPP
• Ministries, local authorities and the private sector will submit project concepts at the pre-feasibility level to the IICU for vetting
• If accepted, the IICU will manage the preparation and the funding process
Acceptance 11 1 Project definition
Dispute resolution 10 2 Project planning
Infrastructure
Monitoring and project Investment 3
management 9 Feasibility
Central Unit
(IICU) Technical and environmental
Award
8 4 impact
Bidding process
7 5 Market testing
6
May 2019
PwC Funding structure 38Make use of all financing options
Public-private partnerships (PPPs) EC funding Project Bonds
Private investment in infrastructure, in partnership • Projects of common interest Project Bonds could provide a
with the public sector, increases accountability in (PCI) significantly higher private sector
the delivery, stretches public budget and helps • Juncker plan participation in infrastructure
governments deliver projects faster, cheaper and funding adding a low risk element
ensure that they are properly maintained • Other concessionary facilities in institutional investors’ portfolios
Asset recycling Value capture Better municipal asset
Tax increment financing
management
Value capture leverages the value Municipalities own substantial
Tax increment financing earmarks Asset recycling uses proceeds properties that are often underutilised.
of property made viable by new
incremental property tax revenues from the sale of existing assets to With more proactive asset
infrastructure, such as a subway
to service debt incurred to develop finance new development (e.g. management, cities could extract
line extension, to finance that new
new transit infrastructure Kasteli airport) significant value that can be invested in
infrastructure
infrastructure
Infrastructure in Greece 2018 May 2019
PwC 39Delays are
endemic in Greek • It is essential infrastructure projects are
assessed based on value-for-money across
• Accelerating the preparation of
projects and minimizing slippage
infrastructure their asset lifecycle requires better coordination across the
whole process and full use of
projects and • Infrastructure projects in Greece suffer from
systematic slippage both in preparation and
concessionary and private funding
curtail its positive execution, with an average 23 months of
slippage in preparation/design and 28
• There should be a single state
organisation mandated with the
economic impact months of slippage in
execution/construction
planning, design and funding of all
major infrastructure projects in order to
reduce delays and secure private
• Possible delay factors range from funding
government and contractor issues to
general and environmental problems • PPPs and Project Bonds could provide
a significantly higher private sector
• Estimated delays in the execution of the participation in infrastructure funding,
current pipeline may undercut GDP growth supported by EC funding
by ca. 0.8pp per annum
May 2019
PwC 405
ConclusionsConclusions
• Global infrastructure investment is expected to reach $3.5trln per annum in the period to 2040 or 3.2% of global GDP
• The quality and extent of infrastructure is below our European peers
• In Greece, there is a systematic infrastructure investment gap of 0.7pps of GDP, resulting in a € 13bn permanent shortage over the
past 10 years, created by the deep recession and consequent budgetary constraints
• Infrastructure investments are vital for the Greek economy, having a high economic multiplier (ca. 1.8x) which can boost
consumption and investment in other sectors
• The number of planned and in progress infrastructure projects are not decreasing during the crisis. In 2018, their total cost is
estimated at € 25bn
• € 10.6bn of the remaining budget refers to Energy projects, while € 7.4bn to Railways and € 4.3bn to Motorways. Tourist
infrastructure and Waste management projects account for a small part of the remaining budget taking up only about € 1.3bn and
€ 0.9bn respectively
• The current project portfolio is heavy on energy and transport and short on connectivity, tourism and the environment
• Infrastructure projects in Greece suffer from systematic slippage both in preparation and execution, with an average 23 months of
slippage in preparation/design and 28 months of slippage in execution/construction. Possible delays in execution will lead to a loss of
investment of around € 4bn by 2024 with a 0.8pp p.a. negative impact on GDP, which makes imperative to move the backlog of €
8.2bn of investment in the planning stage forward
• The main factors contributing to the systematic shortfall of infrastructure investment are poor planning, slow process of political
consensus and delays. Delays are endemic in Greek infrastructure and curtail its positive economic impact
• Accelerating the preparation of projects and minimizing slippage requires better coordination across the whole process and full use of
concessionary and private funding
• There should be a single state organisation mandated with the planning, design and management of all major infrastructure
projects to reduce delays and maximise private funding
May 2019
PwC
PwC 42Appendix I– Infrastructure projects* in Greece
13 Energy projects
14 Rail projects
8 Motorway projects
15 Tourist infrastructure projects
16 Waste management projects
* Some projects have been grouped together and thus projects depicted at the
tables do not add up to 88 projects
PwC
PwCEnergy accounts for ca. € 10.6bn of investments
Completion
No Interconnection Projects Capacity (MW) Remaining Budget (€ mn) Start Date
Date*
1 TAP (Trans - Adriatic Pipeline) N/A 1,068 2016 2023
Electricity Interconnectors (Euroasia Interconnector,
2019|N/A| 2023|2022|
2 Ariadne Interconnection, Cyclades, Maritsa East (BG) - 5,070 4,260
2014|2019 2020|2023
Nea Santa (GR))
3 LNGs (Alexandroupolis LNG, Kavala LNG) N/A 655 N/A|2017 N/A|2019
4 Kavala storage facility (Undeground Storage facility) N/A 240 N/A N/A
5 IGB (GR-BG Natural Gas pipeline) N/A 145 2019 2020
Development of natural gas distribution network in
6 the regions of Eastern Macedonia-Thrace, Central N/A 172 2019 2023
Macedonia and Sterea Ellada
7 Gas Compressor Station (Kipoi) N/A 25 2017 2019
Total Budget 6,565
Completion
No Power Generation Capacity (MW) Remaining Budget (€ mn) Start Date
Date
1 Ptolemaida 5 Power Plant (lignite fired) 660 1,028 2015 2021
2 Mytilineos power plant in Voiotia 665 300 2019 2022
3 Wind Parks 1,479 1,723 2018 N/A
4 Amfilochia Hydro-pumped storage 680 502 2019 2023
5 Hybrid Stations in Siteia and Rethymno 139 280 N/A N/A
6 Solar Parks (Kozani, Anthofyto) 212 190 N/A|2018 N/A|N/A
Total Budget 4,023
*Commissioning date
Source: Press, PwC calculations
May 2019
PwC 44Rail projects amount to € 7.4bn, with 66% coming from urban rail projects
Remaining Budget Completion
No Upcoming Projects Details Start Date
(€mn) Date
Extension of Line 3 to Piraeus , New Line 4 ,
1 Attiko Metro 3,300 2012|2019 2021|N/A
Line 4 Extension to Perissos and Lykovrisi
Main line & Extensions to Kalamaria and 2006|2018| 2020|2026|
2 Thessaloniki Metro 1,528
Western suburbs 2014 2021
3 Athens Tram Extension to Piraeus 32 2013 2019
Grand Total 4,860
Remaining Budget Completion
No Upcoming Projects Details Start Date
(€mn) Date
1 Ergose Tithorea Tithorea- Domoko 216 2013 2019
Palaiofarsalos - Kalambaka (electrification of
2 Ergose Palaiofarsalos 54 2019 2022
railways)
3 Ergose Volos Volos – Larissa (electrification of railways) 92 2019 2023
4 Ergose Polikastro Polikastro - Idomeni 48 2007 2021
Connection of the Port of Kavala to the
5 Ergose Port of Kavala 250 N/A N/A
existing Thessaloniki-Alexandroupoli line
Upgrade of the network in Central
6 Ergose Central Macedonia 35 2019 2021
Macedonia
7 Ergose Athens Upgrade of Athens Train Station 41 2019 2022
Upgrade of existing line Thessaloniki-
8 Ergose Promachonas 120 2021 2023
Promachonas
Kiato-Rhododafni, Rhododafni-
9 Ergose Rhododafni Psathopyrgos, Psathopyrgos-Patras and 642 2006 N/A
electrification of railways
10 Ergose Xanthi Thessaloniki-Kavala-Xanthi new line 1.000 N/A N/A
11 Ergose Sepolia Ergose: Upgrade of the network in Sepolia 57 2018 2023
Grand Total 2,556
Source: Press, PwC calculations
May 2019
PwC 45Motorways investment pipeline is about € 4.3bn
Remaining Estimated Average
Total Budget
Νο Upcoming Projects Details Total Klm Budget Start Date Completion investment/
(€ mn)
(€ mn) Date km
Chania - Chersonissos, Chersonissos
1 Crete Northern Highway 300 1,315 1,315 2019 2024 4.4
- Neapoli & Neapoli - Agios Nikolaos
E65 Motorway (Lamia-
2 Lamia - Xyniada & Trikala - Egnatia 96 1,126 594 2008 2022 11.7
Egnatia)
Vertical axes: Ardanio-Ormenio &
3 Egnatia Odos Mandra-Psathades, Serres-Drama- 173 920 910 2011 N/A 5.3
Kavala, Xanthi-Echinos
4 Ionia Odos Aktion-Amvrakia Vertical Axis 49 150 93 2010 2021 3.1
Ring road of Katerini, Thessaloniki-
Doirani, Circumvention of Chalkida, 2013|2011| 2019|2020|
5 Regional roads Circumvention of Lagkadia, 167 774 711 2019|N/A| N/A|N/A| 4.6
Kalamata-Rizomylos-Pylos-Methoni & N/A|N/A N/A|N/A
Kalo Nero - Tsakona
Underwater tunnel Underwater connection of Salamina
6 5 350 350 2019 N/A 71.4
Salaminas and Perama
Underwater connection of Lefkada
7 Underwater tunnel Lefkada 3 50 50 N/A N/A 16.7
and Etoloakarnania
8 Patras-Pyrgos Motorway Patras-Pyrgos 75 293 244 2019 2022 3.9
Total 867 4,978 4,266 5.7
Source: Press, PwC calculations
May 2019
PwC 46For the upgrading of the tourist product around € 1.3bn have been
scheduled
No Projects Remaining Budget (€mn) Start Date Completion Date
1 Kasteli Airport in Heraklion 480 2020 2025
2 Regional Aiports 332 2017 2021
3 OLTH, new dock 150 2018 2022
4 Igoumenitsa Port upgrade 42 2008 2019
5 Macedonia Airport upgrade 96 2005 2020
6 Ioannina Airport upgrade and new terminal 9 2010 2019
7 Port of Patras upgrade 37 2012 2019
8 Key marinas 42 Ν/Α Ν/Α
9 Luxury marines (Mykonos, Argostoli) 9 N/A N/A
10 Upgrading/ Maintenance of Regional Ports 13 2019 N/A
11 Layrio Mega Yacht 4 N/A N/A
Metropolitan Water Airport (Port of
12 0.4 N/A N/A
Thessaloniki)
13 Athens International Airport Small expansion 12 2018 2019
14 Construction of a new marina in Nafplio 9 N/A N/A
15 Upgrading of Marina of Alimos 50 2019 2024
Total Budget 1,284
Source: Press, PwC calculations
May 2019
PwC 47Waste management projects need about € 0.9bn
No Projects Remaining Budget (€mn) Start Date Completion Date
1 Center of Sewage Treatment (Koropi - Paiania) 77 2013 2020
2 Waste management (Aetoloakarnania) 15 2019 N/A
Waste management in Attica (Northeastern Attica -
3 5 2006 2019
Grammatiko)
4 Waste management (Ilia) 38 2019 2021
5 Waste management (Serres) 24 2017 2019
6 Waste Management (Peloponissos) 126 2018 2020
7 Waste management (Alexandroupoli) 58 2019 2020
8 Water Pipeline Aegina 20 2016 2019
9 Waste management (Voiotia) 11 2017 2019
Connection of Pallini and Gerakas Sewage Systems to
10 72 2019 2023
Psyttaleia
11 Center of Sewage Treatment (Marathonas) 130 N/A 2023
12 Center of Sewage Treatment (Rafina-Artemida) 220 2019 2023
13 Waste management (Achaia) 50 N/A N/A
14 Waste management (Epirus) 35 2017 2019
15 Waste management (Kerkyra) 33 2019 2021
16 Waste management (Rhodes) 38 N/A N/A
Grand Total 952
Source: Press, PwC calculations
May 2019
PwC 48Appendix ΙI – Challenges and sources of funding PwC PwC
32
 Each infrastructure side faces different challenges that
 may impact the delivery and the budget of each project
                                      Challenges
                                                                                                                            General
                   Government                          Contractor/concessionaire

Slow process of political consensus         Risk distribution between the state and the contractor   Projects poorly planned

Delays in work clearance/approval           Disputes between the state and the contractor            Risk distribution

Unexpected requirements                     Failure to coordinate sub-contractors                    Site development difficulties

Unexpected design variations                Late payment of workers during construction

Funding problems                            Poor performance/poor project management

                                            Design changes

                                            Inflation/Relative price changes

                                            Land acquisition costs/Expropriation

                                            Demand variations

                                                                                                                                      May 2019
PwC                                                                                                                                        50
32
Public & Private Partnerships
Design, financing, construction, maintenance and operation of the facilities
5 for the integrated waste management system in: Total budget for
Signed* • Western Macedonia, € 49mn
• Serres, € 36.1mn
these projects is
€ 325mn, of
PPPs • Epirus, € 52.4mn
• Peloponnese, € 150mn
which 36% is
state funded
*Projects in operation or under • Ilia, € 38mn
construction
5 waste management projects 2 motorway projects 1 tourist upgrading project
• Corfu, € 40mn • Chersonisson-Neapoli
9
• Marina of Nafplio, €
• Achaia, € 50mn part of Crete Northern 9mn Total budget for
Approved • Etoloakarnania, € 45mn highway, € 290mn
these projects is
• Rhodes, € 38mn • Kalamata-Rizomylos- € 710mn
PPPs • Alexandroupoli, € 58mn Pylos-Methoni road
axis, € 180mn
Source: sdit.mnec.gr
Up to now, PPP projects of € 822mn have been signed since 2009, mostly schools, networks and waste management
projects as well. The pipeline of approved PPPs reaches € 1.7bn
May 2019
PwC 51www.pwc.gr At PwC, our purpose is to build trust in society and solve important problems. We’re a network of firms in 158 countries with more than 250,000 people who are committed to delivering quality in assurance, advisory and tax services. Find out more and tell us what matters to you by visiting us at www.pwc.com. This publication has been prepared for general guidance on matters of interest only, and does not constitute professional advice. You should not act upon the information contained in this publication without obtaining specific professional advice. No representation or warranty (express or implied) is given as to the accuracy or completeness of the information contained in this publication, and, to the extent permitted by law, PwC does not accept or assume any liability, responsibility or duty of care for any consequences of you or anyone else acting, or refraining to act, in reliance on the information contained in this publication or for any decision based on it. ©2019. PricewaterhouseCoopers Business Solutions SA. All rights reserved. PwC refers to the Greece member firm, and may sometimes refer to the PwC network. Each member firm is a separate legal entity. Please see www.pwc.com/structure for further details. PwC
You can also read