Motilal Oswal Nifty 500 Fund - Invest in India's Only Multicap Index Fund 31st January, 2021 - Motilal Oswal Mutual Funds
←
→
Page content transcription
If your browser does not render page correctly, please read the page content below
Motilal Oswal Nifty 500
Fund
Invest in India’s Only Multicap Index Fund

31st January, 2021
Product Suitability

This product is suitable for investors who are seeking*
    Motilal Oswal Nifty 500 Fund

    •    Return that corresponds to the performance of Nifty
         500 Index subject to tracking error

    •    Equity and Equity related securities covered by
         Nifty 500 Index

    •    Long-term capital growth

*Investors should consult their financial advisers if in doubt about whether the product is suitable for them.

2          For Financial Professionals. Not for Public Distribution. PROPRIETARY. Permission to reprint or distribute any content from this
           presentation requires the written approval of Motilal Oswal Asset Management Company.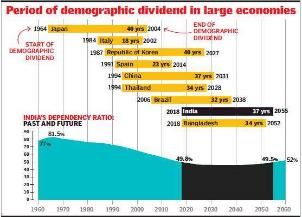
INDIA’S GROWTH STORY
INTACT OVER MEDIUM
TO LONG TERM

 For Financial Professionals. Not for Public Distribution. PROPRIETARY. Permission to reprint or distribute any content from this
 presentation requires the written approval of Motilal Oswal Asset Management Company.
India’s key macro-economic factors
propelling growth
Lowest Repo Rate Brent Crude Oil Prices - 10 Year Daily Chart
10% 30-Jul-08 25-Oct-11
27-Apr-01 Brent Crude Oil (USD)
9.00% 8.50%
9.00%
8% 140
120
6% 100
80
4%
60
21-Apr-09
2% 31-Dec-20 40
4.75%
4.00% 20
0% 0
Dec-11
Dec-10
Dec-12
Dec-13
Dec-14
Dec-15
Dec-16
Dec-17
Dec-18
Dec-19
Dec-20
Jun-11
Jun-12
Jun-13
Jun-14
Jun-15
Jun-16
Jun-17
Jun-18
Jun-19
Jun-20
Apr-03
Apr-06
Apr-09
Apr-01
Apr-02
Apr-04
Apr-05
Apr-07
Apr-08
Apr-10
Apr-11
Apr-12
Apr-13
Apr-14
Apr-15
Apr-16
Apr-17
Apr-18
Apr-19
Apr-20
All time high Forex Reserves; great cushion
• India has solid forex reserve of over $580 bn. A solid buffer
700 in case of global volatility1
01-Dec-20
600 • Low crude prices mean lower Current Account Deficit (CAD)
581
500 (CAD - drastically came down from 5% in 2012 to 0.93% in
USD Billion
400 2019, also crude is expected to be around ~$37 in 2020 and
300 expected to be below $50 in 2021)2
200
• Repo rate is at lowest level over last 20 years. This is
100 expected to reduce cost of financing and thereby fueling
- production and consumption. There by helping GDP growth
Mar-51
Mar-54
Mar-57
Mar-60
Mar-63
Mar-66
Mar-69
Mar-72
Mar-75
Mar-78
Mar-81
Mar-84
Mar-87
Mar-90
Mar-93
Mar-96
Mar-99
Mar-02
Mar-05
Mar-08
Mar-11
Mar-14
Mar-17
Mar-20
rate3
Source/Disclaimer: 1 - rbi.org.in, 2 - www.macrotrends.net, 3 - rbi.org.in. Data as of 31-Dec-2020. The above graph is used to explain the concept and is for illustration purpose only and
should not used for development or implementation of an investment strategy. Past performance may or may not be sustained in future.
4 For Financial Professionals. Not for Public Distribution. PROPRIETARY. Permission to reprint or distribute any content from this
presentation requires the written approval of Motilal Oswal Asset Management Company.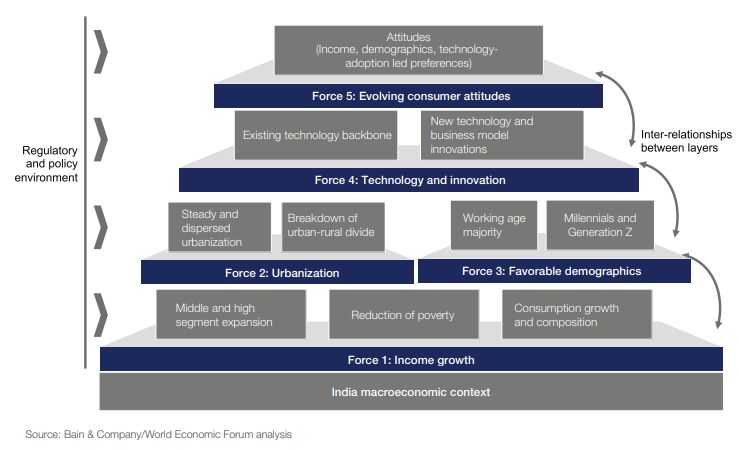
India expected to benefit from young
working age population
•       Economic growth potential that results from
        shift in population’s age structure
•       65% of the population under 35 years4
•       Key determinants of economy’s longer run
        growth rate- Labour (young population) &
        capital (higher saving) inputs
•       Shape aggregate consumption, saving and
        investment decision
•        Structural factors of Indian                                economy
        favourable to catapult growth
          •     Consumption driven economy
                (Domestic consumption powers 60% of
                GDP)5
          •     Relatively high gross savings as % of
                GDP (India ~31%, World Avg.~25%)6

          Source/Disclaimer: 4 – TOI, 2016; 5 - World Economic Forum, Jan-2019; 6 - World Bank, 2019; Both Info graphics - Economic times & UN, 2019; The above
          graph is used to explain the concept and is for illustration purpose only and should not used for development or implementation of an investment strategy. Past
          performance may or may not be sustained in future.

    5     For Financial Professionals. Not for Public Distribution. PROPRIETARY. Permission to reprint or distribute any content from this
          presentation requires the written approval of Motilal Oswal Asset Management Company.
Drivers of future consumption
Source/Disclaimer: World Economic Forum, Jan 2019; The above graph is used to explain the concept and is for illustration purpose only and should not used for
development or implementation of an investment strategy. Past performance may or may not be sustained in future.
6 For Financial Professionals. Not for Public Distribution. PROPRIETARY. Permission to reprint or distribute any content from this
presentation requires the written approval of Motilal Oswal Asset Management Company.Global PE/VC Increasing Investment in
India
• India is emerging as one of the leading destinations for global PE/VC ($48bn inflows in
2019, a 28% increase over 2018 / Following global trend at 1.7% of GDP)7
• Translates to $ 87.5bn of funding between 2017-2019 towards job creation, incremental
capacities, technology, infrastructure etc. - 26 lakh job generated in 2019 by PE/VC backed
startup8
• Investment in core sector - financial (especially Fintech and NBFC) service accounting to
$23.7bn between 2017-2019
Source/Disclaimer: 7 & 8 – PE/VC Agenda India Trend Book 2020. The above graph is used to explain the concept and is for illustration purpose only and should not used for
development or implementation of an investment strategy. Past performance may or may not be sustained in future.
7 For Financial Professionals. Not for Public Distribution. PROPRIETARY. Permission to reprint or distribute any content from this
presentation requires the written approval of Motilal Oswal Asset Management Company.Short term headwinds
• Global economic impact due to the Covid-19 pandemic expected to be broader than the
Great Depression of 19289
• De-Growth projected by World Bank for FY 21 (India- 9.6%)10
• Balancing act between containing outbreak and reducing economic toll
• Weak credit growth (slowed to 5.9% in Dec 2020 from 7.0% in Dec 2019)11
Developed and Emerging Economies
Global GDP Growth Rate
GDP Growth Rate
Source/Disclaimer: 9 - www.imf.org, April 2020; 10- World Bank, Oct 2020; 11 - www.rbi.org.in. The above graph is used to explain the concept and is for illustration purpose only and
should not used for development or implementation of an investment strategy. Past performance may or may not be sustained in future.
8 For Financial Professionals. Not for Public Distribution. PROPRIETARY. Permission to reprint or distribute any content from this
presentation requires the written approval of Motilal Oswal Asset Management Company.Destabilizing world’s factory
• Global anti China sentiment primarily driven by:
• Unfair trade and technology practices
• Territorial Disputes with neighbouring countries
• Accusation by US for supressing early information on the virus
• Great opportunity for India to become a manufacturing hub - India putting together land bank
up to the size of Luxemburg, a special task force to promote make in India12
• Factors in favour of India-
• Considerable improvement in Rank of Ease of Doing Business from 142 in 2014 to 63 in
2020 among 190 countries13
• Young India - Prime age labor being added, will help increase consumption and savings
• Radical reforms - Implementation of GST, Digitisation Drive, Insolvency Code, Easing FDI
Policy Regime, Infrastructure push, Corporate Tax Rate cut to 15%)
Source/Disclaimer: 12 – Business Standard, May 2020; 13 - World Bank, Oct 2019
9 For Financial Professionals. Not for Public Distribution. PROPRIETARY. Permission to reprint or distribute any content from this
presentation requires the written approval of Motilal Oswal Asset Management Company.Destabilizing world’s factory
• Challenges for India -
• Need to fully realize comparative manufacturing advantage
• According to Nomura Securities 56 firms left China between August 2018-August 2019 (2-
Indonesia, 8- Thailand, 11- Taiwan, 26- Vietnam, only 3 came to India)14
• Twin balance sheet problems (Over leveraged companies & banks with bad loans)
• Weak linkage to global value chain
• Although there have been big ticket reforms, policy implementation will be key
Source/Disclaimer: 14 - www.livemint.com, Oct 2019
10 For Financial Professionals. Not for Public Distribution. PROPRIETARY. Permission to reprint or distribute any content from this
presentation requires the written approval of Motilal Oswal Asset Management Company.About Motilal Oswal Nifty 500 Fund
Why is it a good proxy for India’s Listed
Universe

                                                                                                                        Total Market Cap Coverage
                                                                 Total Mcap Coverage
                       Description                                                                                   Nifty 500        India's listed universe ex Nifty 500
                                                                     (INR Crores)
                                                                                                                                         5.7%
      Nifty 500 Index Companies                                1,77,26,730.79             94.3%

      India's Listed Universe Ex Nifty 500
                                                                 10,76,787.81               5.7%
      Companies13

      Total India's Listed Universe                           1,88,03,518.60            100.0%                                                  94.3%

        Nifty 500 Index broadest benchmark index covering ~94% of India’s listed
                                       universe

Source/Disclaimer : Data as of December 31, 2020. 13 - India’s Listed Universe Total Mcap www.bseindia.com; Nifty 500 Index Companies – NSE. The information / data herein
alone is not sufficient and shouldn’t be used for implementation of an investment strategy. It should not be construed as investment advice to any party. All opinions, figures,
estimates and data included in this article are as on date. The article does not warrant the completeness or accuracy of the information and disclaims all liabilities, losses and
damages arising out of the use of this information. The statements contained herein may include statements of Readers shall be fully responsible/liable for any decision taken on the
basis of this article.

12        For Financial Professionals. Not for Public Distribution. PROPRIETARY. Permission to reprint or distribute any content from this
          presentation requires the written approval of Motilal Oswal Asset Management Company.
What you get in Nifty 500
• Offers combination of Large, Mid and
small cap stocks, with overweight to
large cap. • Established
• A multicap index tend to stay stable, conglomerates
yet provide marginally higher returns Largecap
• Stable and Dividend
over largecap during medium to long Paying
term
• Growing Businesses
• Looking for growth
Nifty 500 capital to fund
Midcap expansions by
Index product and
geography
• Young Age Companies
Smallcap • Need capital to fund
and grow business
Source/Disclaimer : MOAMC; The above graph is used to explain the concept and is for illustration purpose only and should not used for development or implementation of an
investment strategy.
13 For Financial Professionals. Not for Public Distribution. PROPRIETARY. Permission to reprint or distribute any content from this
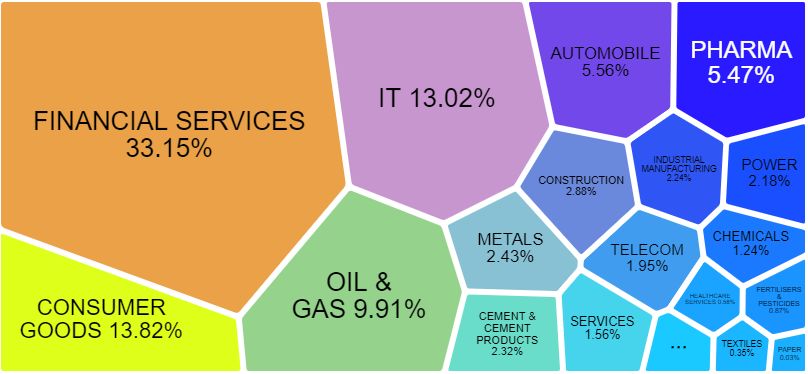
presentation requires the written approval of Motilal Oswal Asset Management Company.Nifty 500 Index: All Sector and All Cap Size
NSE Sector Distribution SEBI Size Coverage
Mid Cap Small Cap Large Cap
13.39
5.90
80.72
The Motilal Oswal Nifty 500 Fund - seeks to offer investors an exposure to a all sector
and all size (large, mid and small) index, which is in line with India’s listed universe,
there are by offering pure beta exposure to Indian listed equity market
Source/Disclaimer : www.niftyindices.comand SEBI/AMFI for Size Classification; Data as of 31-Dec-2020; The sector mentioned herein are for general and comparison purpose only
and not a complete disclosure of every material fact. The charts mentioned above are used to explain the concept and is for illustration purpose only and should not used for
development or implementation of an investment strategy. It should not be construed as investment advice to any party. The stocks may or may not be part of our portfolio/strategy/
schemes. Past performance may or may not be sustained in future.
14 For Financial Professionals. Not for Public Distribution. PROPRIETARY. Permission to reprint or distribute any content from this
presentation requires the written approval of Motilal Oswal Asset Management Company.Diversification
Motilal Oswal Nifty Motilal Oswal Nifty
Motilal Oswal Nifty Motilal Oswal Nifty Motilal Oswal Nifty
Midcap 150 Index Smallcap 250 Index
500 Fund 50 Index Fund Next 50 Index Fund
Fund Fund
No of Companies 500 50 50 150 250
Large, Mid and
Segment Large Cap Large Cap Mid Cap Small Cap
Small Cap
18 Sectors out of
Sectors coverage All 19 Sectors 13 Sectors out of 19 14 Sectors out of 19 All 19 Sectors
19
Top 5 Macro
economic Sector 82.76% 88.43% 80.02% 83.96% 78.16%
allocation
FINANCIAL FINANCIAL FINANCIAL
Largest Macro CONSUMER MANUFACTURING
SERVICES SERVICES SERVICES
economic Sector 28.7% 20.8%
32.2% 37.1% 23%
APOLLO HOSPITAL
AVENUE SUPERMARTS LAURUS LABS
HDFC Bank Ltd. HDFC Bank Ltd. ENTERPRISE
Largest Stock LTD. LIMITED
7.1% 10.0% LIMITED
4.4% 2.4%
2.1%
• The addition of Nifty Midcap 150 and Nifty Smallcap 250 helps to diversify Nifty 50 sector exposure
• The index automatically rebalances sector and size exposure in line with Indian equity market.
Source/Disclaimer : MOAMC, Data as of 31-Jan-2021. Macro Economic Sector / Sectors as identified by AMFI Sector Model. The stocks/sectors mentioned above are used to explain
the concept and is for illustration purpose only and should not used for development or implementation of an investment strategy. The stocks/sectors may or may not be part of our
portfolio/strategy/ schemes. It should not be construed as investment advice to any party. Past performance may or may not be sustained in future.
15 For Financial Professionals. Not for Public Distribution. PROPRIETARY. Permission to reprint or distribute any content from this
presentation requires the written approval of Motilal Oswal Asset Management Company.Comparison between Nifty 500 Index and
Nifty 50 Index
Criteria Nifty 500 Index Nifty 50 Index
Theme Broad Market (Beta) Large Cap
Number of Companies in index 500 50
Covers ~94% of the listed Covers ~57% of the listed
Total Mcap Coverage of index
universe universe
Sectors covered in the index All 19 Sectors Covered 13 Sectors out of 19
Top 10 companies weight in the fund 41.9% 59.2%
Largest Sector (weight) in the fund Financial Services (32.2%) Financial Services (37.1%)
Source/Disclaimer: MOAMC, India’s Listed Universe Total Mcap - www.bseindia.com. Total Mcap coverage as 31 Dec, 2020. Sector/Stock coverage data as of Jan 31, 2021.
Sectors as identified by NSE’s Sector Model. The table/charts mentioned above are used to explain the concept and is for illustration purpose only and should not used for
development or implementation of an investment strategy. It should not be construed as investment advice to any party. The stocks may or may not be part of our
portfolio/strategy/ schemes. Past performance may or may not be sustained in future.
16 For Financial Professionals. Not for Public Distribution. PROPRIETARY. Permission to reprint or distribute any content from this
presentation requires the written approval of Motilal Oswal Asset Management Company.Nifty 500 One of the Most Benchmarked
Index
• Nifty 500 Index is one of the most popular benchmark in the industry.
• It ranks in top 3 benchmarks across all equity benchmarks, whereas it ranks first in
multicap category
Number of
Modified Benchmarks Total AUM
Schemes
NIFTY 50 - TRI 368 10,16,861.94
S&P BSE SENSEX - TRI 170 5,04,439.21
NIFTY 500 - TRI 63 2,15,857.55
Source/Disclaimer : ACE MF Next; ‘All Equity, Hybrid, FoF Funds, ETF and FoF Domestic’ categories considered. Fund Benchmark and AUM as of 31-Dec-2020. Only Active Mutual
Fund Schemes are considered. The table/charts mentioned above are used to explain the concept and is for illustration purpose only and should not used for development or
implementation of an investment strategy. It should not be construed as investment advice to any party. The stocks may or may not be part of our portfolio/strategy/ schemes.
Past performance may or may not be sustained in future.
17 For Financial Professionals. Not for Public Distribution. PROPRIETARY. Permission to reprint or distribute any content from this
presentation requires the written approval of Motilal Oswal Asset Management Company.Motilal Oswal Nifty 500 Fund
Investment Objective:
The Scheme seeks investment return that corresponds to the performance of Nifty 500 Index subject to tracking error.
However, there can be no assurance or guarantee that the investment objective of the Scheme would be achieved.
Fund Info:
• Category- Index Fund
• Date of Allotment (inception) – 06-Sep-2019
• Benchmark – Nifty 500 TR Index
• Minimum Investment (Lumpsum & SIP) – Minimum ₹ 500 & in multiples of ₹ 1 thereafter for every investment.
• Fund Manager – Mr. Swapnil Mayekar-11 years of experience in fund management and product development
• Scheme Statistics- Monthly AAUM: ₹ 93.76 cr , Latest AUM: ₹ 91.41 cr
Portfolio Turnover Ratio: 0.11
• NAV- Direct Growth Plan Option: ₹ 12.7306, Regular Growth Plan Option: ₹ 12.6152
• Total Expense Ratio – Direct – 0.38%; Regular – 1.03%
• Entry Load – Nil
• Exit Load – 1%- If redeemed on or before 15 days from the date of allotment. Nil- If redeemed after 15 days from the date
of allotment.
Source: https://www.motilaloswalmf.com/downloads/mutual-fund/Factsheet, as of 31-Jan-2021;
Total Expense Ratio: https://www.motilaloswalmf.com/downloads/mutual-fund/totalexpenseratio
18 For Financial Professionals. Not for Public Distribution. PROPRIETARY. Permission to reprint or distribute any content from this
presentation requires the written approval of Motilal Oswal Asset Management Company.About: Nifty 500 Index
Index Objective: NIFTY 500 represents the top 500 companies based on full market capitalization from the eligible universe.
The index covers more than 94.3% of listed universe at NSE in terms of total/full market capitalization.
Index Methodology Snapshot:
Eligible Universe
Top 800 companies by average turnover Subject to min Free-float
Trading Frequency >= 90%
and full market capitalization Marketcap
Stock Selection
Companies with Full Mcap Rank 800 Free Float Mcap > 1.5 times
350 included excluded smallest constituent
Reconstitution and Weighting
Reconstitution - Semi Annually in March and
Weighting - Based on Free Float Mcap
September
Source/Disclaimer : www.niftyindices.com/, data as of 31-Dec-2020; for detailed index methodology kindly visit www.niftyindices.com/ . The above chart is used to explain the
concept and is for illustration purpose only and should not used for development or implementation of an investment strategy.
19 For Financial Professionals. Not for Public Distribution. PROPRIETARY. Permission to reprint or distribute any content from this
presentation requires the written approval of Motilal Oswal Asset Management Company.Portfolio Composition: Motilal Oswal Nifty
500 Fund
Company Name Weight
Macro-Economic Sectors (AMFI): Motilal
HDFC Bank Limited 7.1%
Oswal Nifty 500 Fund
Reliance Industries Limited 7.0%
COMMODITIES 6.85 Infosys Limited 5.4%
Housing Development Finance Corporation Limited 5.0%
CONSUMER 18.73
ICICI Bank Limited 4.3%
ENERGY 11.49 Tata Consultancy Services Limited 3.8%
32.23 Kotak Mahindra Bank Limited 2.9%
FINANCIAL SERVICES
Hindustan Unilever Limited 2.4%
HEALTHCARE 5.77 ITC Limited 2.1%
Axis Bank Limited 1.9%
IT 13.47
Total 43.4%
MANUFACTURING 6.66
SERVICES 1.63
Size coverage (AMFI): Motilal Oswal Nifty 500 Fund
79.27
TELECOMMUNICATIONS 2.08
13.66 5.98 1.09
Cash & Equivalent 1.09
Large Cap Mid Cap Small Cap Cash & Equivalent
Source/Disclaimer : MOAMC; Data as of 31-Jan-2021; Sectors - Macro Economic Sectors as per AMFI Industry Classification; the stocks/sectors mentioned above are used to
explain the concept and is for illustration purpose only and it should not be used for development or implementation of an investment strategy. It should not be construed as
investment advice to any party. The stocks may or may not be part of our portfolio/strategy/schemes. Past performance may or may not be sustained in future.
20 For Financial Professionals. Not for Public Distribution. PROPRIETARY. Permission to reprint or distribute any content from this
presentation requires the written approval of Motilal Oswal Asset Management Company.Historical Performance (15 years)
• Performance of Nifty 500 Index is combination of its component indices
• Nifty 500 Index noted least volatility over other indices over long term
Nifty 50 TR Index Nifty Next 50 TR Index Nifty Midcap 150 Index
Nifty Smallcap 250 Index Nifty 500 TR Index
800
700
600
500
400
300
200
100
0
Source/Disclaimer: www.niftyindices.com; All performance data in INR. Performance Data from 31-Jan-2006 – 31-Jan-2021; Hypothetical performance results have many
inherent limitations and no representation is being made that any investor will, or is likely to achieve, performance similar to that shown. The above graph is used to explain the
concept and is for illustration purpose only and should not used for development or implementation of an investment strategy. Past performance may or may not be sustained in
future.
21 For Financial Professionals. Not for Public Distribution. PROPRIETARY. Permission to reprint or distribute any content from this
presentation requires the written approval of Motilal Oswal Asset Management Company.Performance
Nifty Midcap Nifty
Nifty 50 TR Nifty Next 50 Nifty 500 TR
Period 150 TR Smallcap 250 • Typically Nifty 500 Index
Index TR Index Index
Index TR Index
outperforms large cap stocks
1 year 15.2% 13.3% 19.5% 19.4% 15.8% during overall bull market;
whereas it potentially help
3 year 8.7% 2.5% 4.5% -3.4% 6.5%
reduce the drawdown/losses
Annualised
Returns
5 year 14.0% 13.0% 14.6% 9.3% 13.6% as compared to midcap and
7 year 13.6% 16.4% 19.5% 15.9% 14.6%
smallcap stocks during bear
market
10 year 10.8% 12.7% 14.0% 10.1% 11.1%
15 year 12.0% 13.2% 13.1% 10.7% 11.7%
1 year 31.4% 27.3% 27.7% 28.5% 29.6% • The fund is suitable for
investors with moderately-
3 year 21.2% 20.4% 20.5% 21.6% 20.4% high risk appetite and are
Annualised
Volatility
5 year 18.1% 18.4% 18.3% 19.8% 17.6% looking for low cost, pure beta
exposure to Indian Equities.
7 year 17.2% 18.4% 18.0% 20.0% 16.9%
10 year 17.5% 18.3% 17.6% 19.0% 17.0%
15 year 22.8% 24.6% 22.3% 22.5% 22.0%
1 year 0.484 0.485 0.703 0.681 0.534
3 year 0.409 0.121 0.217 -0.157 0.317
Risk Adjusted
Returns
5 year 0.771 0.705 0.798 0.470 0.773
7 year 0.789 0.891 1.080 0.798 0.863
10 year 0.620 0.693 0.793 0.529 0.653
15 year 0.524 0.538 0.587 0.475 0.529
Source/Disclaimer : www.niftyindices.com; All performance data in INR. Performance Data from 31-Jan-2006 – 31-Jan-2021; Hypothetical performance results have many inherent
limitations and no representation is being made that any investor will, or is likely to achieve, performance similar to that shown. The above graph is used to explain the concept and is
for illustration purpose only and should not used for development or implementation of an investment strategy. Past performance may or may not be sustained in future.
22 For Financial Professionals. Not for Public Distribution. PROPRIETARY. Permission to reprint or distribute any content from this
presentation requires the written approval of Motilal Oswal Asset Management Company.Drawdown (15 Years)
Nifty 50 TR Index Nifty Next 50 TR Index Nifty Midcap 150 Index
Nifty Smallcap 250 Index Nifty 500 TR Index
0%
-10%
-20%
-30%
-40%
-50%
-60%
-70%
-80%
Nifty 500 has experienced lower drawdowns compared to midcap and smallcap
Source/Disclaimer : www.niftyindices.com; All performance data in INR. Performance Data from 31-Jan-2006 – 31-Jan-2021; Hypothetical performance results have many
inherent limitations and no representation is being made that any investor will, or is likely to achieve, performance similar to that shown. The above graph is used to explain the
concept and is for illustration purpose only and should not used for development or implementation of an investment strategy. Past performance may or may not be sustained in
future.
23 For Financial Professionals. Not for Public Distribution. PROPRIETARY. Permission to reprint or distribute any content from this
presentation requires the written approval of Motilal Oswal Asset Management Company.SIP Returns: Nifty 500 Index
1 Year 3 Year 5 Year 7 Year 10 Year
Nifty 500 TR Index
53.73% 14.83% 12.59% 11.88% 12.58%
SIP Returns
Amount Invested 1,20,000 3,60,000 6,00,000 8,40,000 12,00,000
Market Value 1,52,224 4,48,484 8,22,581 12,82,281 23,11,022
Data as of close of Jan 31, 2021. For SIP returns, monthly investment of INR 10,000/- invested on the first
business day of every month has been considered. Performance is calculated using Total Return Index, with
zero cost/expenses. Past performance may or may not be sustained in the future.
Source/Disclaimer : www.niftyindices.com; All performance data in INR. Performance Data from 31-Jan-2011 – 31-Jan-2021; Hypothetical performance results have many
inherent limitations and no representation is being made that any investor will, or is likely to achieve, performance similar to that shown. The above is for illustration purpose only.
The SIP amount, tenure of SIP, expected rate of return are assumed figures for the purpose of explaining the concept of advantages of SIP investments. The actual result may vary
from depicted results depending on scheme selected. It should not be construed to be indicative of scheme performance in any manner. Past performance may or may not be
sustained in future.
24 For Financial Professionals. Not for Public Distribution. PROPRIETARY. Permission to reprint or distribute any content from this
presentation requires the written approval of Motilal Oswal Asset Management Company.Valuation Multiples
Nifty 500 Index P/E
50.0
40.0
30.0 40.19
20.0
10.0
-
Nifty 500 Index P/B Nifty 500 Index Div Yield %
4.0 2.0
3.0 1.5
2.0 1.0 1.23
3.65
1.0 0.5
- -
Source/Disclaimer : www.niftyindices.com; Data from 31-Jan-2011 – 31-Jan-2021; Performance results have many inherent limitations and no representation is being made
that any investor will, or is likely to achieve, performance similar to that shown in future. The above graph is used to explain the concept and is for illustration purpose only and
should not used for development or implementation of an investment strategy. Past performance may or may not be sustained in future.
25 For Financial Professionals. Not for Public Distribution. PROPRIETARY. Permission to reprint or distribute any content from this
presentation requires the written approval of Motilal Oswal Asset Management Company.Blending Nifty 500 Index with International Indices For Financial Professionals. Not for Public Distribution. PROPRIETARY. Permission to reprint or distribute any content from this presentation requires the written approval of Motilal Oswal Asset Management Company.
Nifty 500 Index is less correlated with
International Equity
                Indian equities had very low correlation to international equities historically –
                                providing great opportunity for diversification
                                               ^Dow
                         Nifty 500                                ^S&P             ^NASDAQ               ^DAX              ^FTSE              ^Nikkei            ^Hang
                                               Jones
                          Index                                 500Index           100Index              Index            100Index           225 Index         Seng Index
                                               Index
                           (INR)                                  (INR)              (INR)               (INR)              (INR)              (INR)             (INR)
                                               (INR)
Nifty 500
                             1.00               0.22               0.23                0.18               0.36               0.40                0.33               0.51
Index (INR)
^Dow Jones
                                                1.00               0.98                0.89               0.62               0.67                0.20               0.32
Index (INR)
^S&P
500Index                                                           1.00                0.93               0.62               0.66                0.19               0.32
(INR)
^NASDAQ 100
                                                                                       1.00               0.55               0.56                0.14               0.29
Index (INR)
^DAX Index
                                                                                                          1.00               0.87                0.33               0.44
(INR)
^FTSE 100
                                                                                                                             1.00                0.37               0.51
Index (INR)
^Nikkei 225
                                                                                                                                                 1.00               0.53
Index (INR)
^Hang Seng
                                                                                                                                                                    1.00
Index (INR)

Source/Disclaimer : Index Values – www.niftyindices.com/Bloomberg, Forex Rate - RBI/Thomson Reuters. Correlation of daily total returns as of Close of 31-Dec-2005 to 31-
Dec-2020. ^ denotes the index currency conversion. Performance results have many inherent limitations and no representation is being made that any investor will, or is likely
to achieve. Past performance may or may not be sustained in future. The above graph is used to explain the concept and is for illustration purpose only and should not used
for development or implementation of an investment strategy.

27      For Financial Professionals. Not for Public Distribution. PROPRIETARY. Permission to reprint or distribute any content from this
        presentation requires the written approval of Motilal Oswal Asset Management Company.
Blending Nifty 500 Index with US Equities-
Risk-Return Profile
Data Label 1 year 3 year 5 year 7 year 10 year 15 year 20 year
Annualised Returns
Nifty 500 TR Index 17.9% 7.9% 12.7% 14.2% 10.1% 12.2% 15.3%
Nifty500 : SP500 (60 : 40) 18.9% 12.5% 14.8% 15.0% 14.5% 13.9% 14.4%
Nifty500 : NASDAQ100 (60 :
31.8% 18.0% 18.4% 18.6% 17.3% 16.2% 15.3%
40)
Annualised Volatility
Nifty 500 TR Index 29.3% 20.3% 17.7% 16.9% 17.0% 22.0% 22.2%
Nifty500 : SP500 (60 : 40) 27.1% 18.0% 15.3% 14.4% 14.2% 17.4% 17.0%
Nifty500 : NASDAQ100 (60 :
25.7% 18.1% 15.5% 14.7% 14.4% 17.4% 18.0%
40)
Risk Adjusted Returns
Nifty 500 TR Index 0.610 0.391 0.719 0.842 0.593 0.553 0.690
Nifty500 : SP500 (60 : 40) 0.699 0.691 0.968 1.044 1.017 0.801 0.848
Nifty500 : NASDAQ100 (60 :
1.238 0.996 1.190 1.266 1.204 0.930 0.852
40)
Source/Disclaimer : Index Values - www.niftyindices.com/Bloomberg, Forex Rate - RBI/Thomson Reuter and MOFSL; S&P 500 and NASDAQ 100 TR Index Values adjusted in INR.
NASDAQ 100 Index and S&P 500 Index values are adjusted for one day lag movement due to different time zone. Performance as of Close of 31-Dec-2000 to 31-Dec-2020. ^
denotes the index currency conversion. Performance results have many inherent limitations and no representation is being made that any investor will, or is likely to achieve. Past
performance may or may not be sustained in future. The above table/graph is used to explain the concept and is for illustration purpose only and should not used for development
or implementation of an investment strategy.
28 For Financial Professionals. Not for Public Distribution. PROPRIETARY. Permission to reprint or distribute any content from this
presentation requires the written approval of Motilal Oswal Asset Management Company.Blending Nifty 500 Index with US Equities-
During COVID 19 Pandemic
The blended portfolio’s took relatively less hit and recovered faster during recent
market volatility caused due to Covid-19 pandemic
Recent Performance- During COVID 19 Pandemic
Nifty 500 TR Index Nifty500 : SP500 (60 : 40) Nifty500 : NASDAQ100 (60 : 40)
85.8% 83.1%
76.5%
1.1% 2.8% 5.1%
-31.5%
-37.2%-34.4%
Before Covid (31-Dec-19 to Covid Crash (19-Feb-20 to 23- Recovery from Recent Covid
19-Feb-20) Mar-20) Bottom (23-Mar-20 to 31-
Dec-20)
Source/Disclaimer : Index Values - www.niftyindices.com/Bloomberg, Forex Rate - RBI/Thomson Reuter and MOAMC; S&P 500 and NASDAQ 100 TR Index Values adjusted in
INR. NASDAQ 100 Index and S&P 500 Index values are adjusted for one day lag movement due to different time zone. Performance as of Close of 31-Dec-2019 to 31-Dec-2020.
^ denotes the index currency conversion. Performance results have many inherent limitations and no representation is being made that any investor will, or is likely to achieve.
Past performance may or may not be sustained in future. The above table/graph is used to explain the concept and is for illustration purpose only and should not used for
development or implementation of an investment strategy.
29 For Financial Professionals. Not for Public Distribution. PROPRIETARY. Permission to reprint or distribute any content from this
presentation requires the written approval of Motilal Oswal Asset Management Company.Reduced risk in terms of drawdown
During last 20 year, the blended portfolio experienced less drawdowns except during IT
Boom and Burst in 2001-02
Drawdown Chart
Nifty 500 TR Index Nifty500 : SP500 (60 : 40) Nifty500 : NASDAQ100 (60 : 40)
0%
-10%
-20%
-30%
-40%
-50%
-60%
-70%
-80%
Source/Disclaimer : Index Values - www.niftyindices.com/Bloomberg, Forex Rate - RBI/Thomson Reuter and MOAMC; S&P 500 and NASDAQ 100 TR Index Values adjusted in INR.
NASDAQ 100 Index and S&P 500 Index values are adjusted for one day lag movement due to different time zone . Performance as of Close of 31-Dec-1999 to 31-Dec-2020. ^
denotes the index currency conversion. Performance results have many inherent limitations and no representation is being made that any investor will, or is likely to achieve. Past
performance may or may not be sustained in future. The above table/graph is used to explain the concept and is for illustration purpose only and should not used for development or
implementation of an investment strategy.
30 For Financial Professionals. Not for Public Distribution. PROPRIETARY. Permission to reprint or distribute any content from this
presentation requires the written approval of Motilal Oswal Asset Management Company.Motilal Oswal Passive Fund Offerings For Financial Professionals. Not for Public Distribution. PROPRIETARY. Permission to reprint or distribute any content from this presentation requires the written approval of Motilal Oswal Asset Management Company.
Product Pyramid

D
                                                                          Alternates

                                                               Benchmark Agnostic
C                                                        High alpha seekers – large tracking
                                                            error; typically focused funds

                                                               Benchmark Hugging
B                                          Typically outperform or underperform by couple of
                                          percentage; hold large & diversified portfolio of stock

                                                   Benchmark Replicating (Passive)
A                           Replicate index constituents and their weights; aim to generate returns
                                     similar to benchmark at very low total expense ratio

Motilal Oswal AMC has presence in strata A through its passive offerings since 2010, strata C through its QGLP
investing philosophy backed active mutual funds and in strata D through its PMS and AIF offerings.

32    For Financial Professionals. Not for Public Distribution. PROPRIETARY. Permission to reprint or distribute any content from this
      presentation requires the written approval of Motilal Oswal Asset Management Company.
Motilal Oswal Passive Fund Offerings
Managing over ₹5,500 One of the largest AMC Only AMC with funds
crore across all our in India in the across all major
passive funds* International segment segments
International MultiCap Sectoral SmallCap MidCap LargeCap Debt
NASDAQ 100 Nifty Bank Nifty Smallcap Nifty Midcap Nifty 50 Index 5 Year G-Sec
Nifty 500 Fund
FoF Index Fund 250 Index Fund 150 Index Fund Fund ETF
NASDAQ 100 Nifty Midcap Nifty Next 50
ETF 100 ETF Index Fund
S&P 500 Index
M50 ETF
Fund
Source/Disclaimer: *AUM Data as on 31-Dec-2020, MOAMC
33 For Financial Professionals. Not for Public Distribution. PROPRIETARY. Permission to reprint or distribute any content from this
presentation requires the written approval of Motilal Oswal Asset Management Company.Active vs Passive For Financial Professionals. Not for Public Distribution. PROPRIETARY. Permission to reprint or distribute any content from this presentation requires the written approval of Motilal Oswal Asset Management Company.
US: Over Last 10 year Passive Funds AUM
gained market share (year 2018)
Source/Disclaimer : Chart - Morningstar data as of Dec 2018; The above graph is used to explain the concept and is for illustration purpose only and should not used for
development or implementation of an investment strategy. Past performance may or may not be sustained in future.
35 For Financial Professionals. Not for Public Distribution. PROPRIETARY. Permission to reprint or distribute any content from this
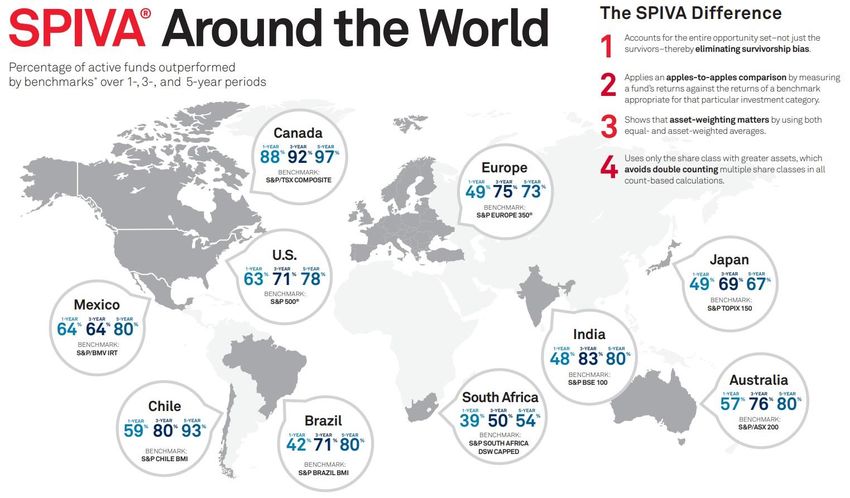
presentation requires the written approval of Motilal Oswal Asset Management Company.Global: Active Passive Score Card
Source/Disclaimer: spdji.com/SPIVA; June 2020; Regional benchmarks included here are large-cap, with the exception of Brazil and Chile where SPIVA results displayed reflect
regional broad market indices. Multiple benchmarks exist in all regions tracked by SPIVA. Visit www.spdji.com/spiva for more information.
36 For Financial Professionals. Not for Public Distribution. PROPRIETARY. Permission to reprint or distribute any content from this
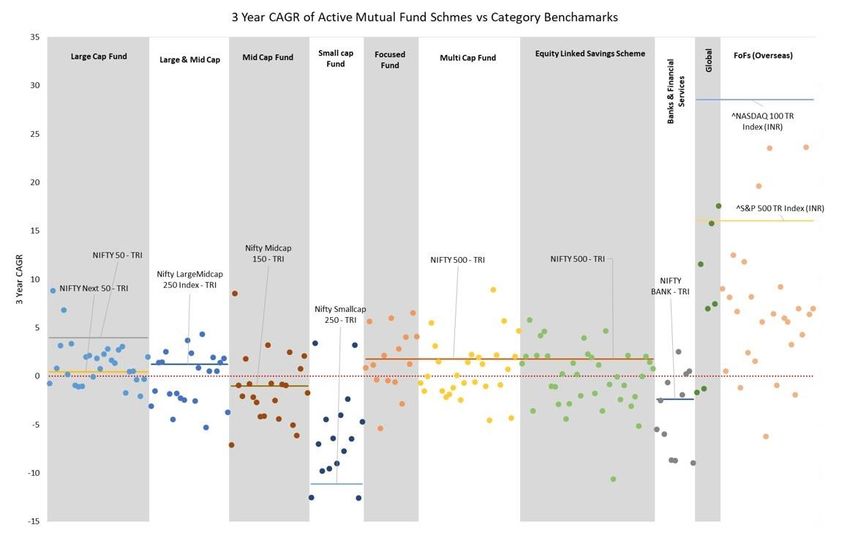
presentation requires the written approval of Motilal Oswal Asset Management Company.Performance of Active Mutual Fund schemes vs
Category Benchmark (3yr CAGR)
Every point (•)
represents 3-yr CAGR
of an active fund for
respective category
Every horizontal line
(—) represents 3-yr
CAGR of a category
benchmark
All points (•) above a
horizontal line (—) have
outperformed
respective category
benchmark
All points (•) below a
horizontal line (—) have
underperformed
respective category
benchmark
Source/Disclaimer: ACE MF Next, MOAMC; 30-Jun-2020. The above graph is used to explain the concept and is for illustration purpose only and should not used for
development or implementation of an investment strategy. Past performance may or may not be sustained in future.
37 For Financial Professionals. Not for Public Distribution. PROPRIETARY. Permission to reprint or distribute any content from this
presentation requires the written approval of Motilal Oswal Asset Management Company.India: Growth of Passive Fund AUM
Passive Equity AUM (₹ crore)
Retirement Funds are mandated to
2,49,519
invest at least 15% of annual
accretion in Equity ETFs/Index
1,70,353 Funds for equity investments
1,09,639
74,117
Categorization and rationalization of
12,528
29,222 Mutual Fund Schemes by SEBI
Dec-15 Dec-16 Dec-17 Dec-18 Dec-19 Dec-20
Passive / Total Equity AUM (%) Benchmarking of funds moved from
Price Return Index (PRI) to Total
Return Index (TRI)
20.0%
16.3%
11.5%
Challenges in generating alpha due
8.8% to improving market efficiency.
5.8%
3.0%
Dec-15 Dec-16 Dec-17 Dec-18 Dec-19 Dec-20
Source/Disclaimer: AMFI, AceMF. All AUM data in INR. Data from 30-Dec-2015 to 30-Dec-2020. The above graph is used to explain the concept and is for illustration purpose
only and should not used for development or implementation of an investment strategy. Past performance may or may not be sustained in future.
38 For Financial Professionals. Not for Public Distribution. PROPRIETARY. Permission to reprint or distribute any content from this
presentation requires the written approval of Motilal Oswal Asset Management Company.Key Take Away
1. Over medium to long term, India’s structural factors look solid,
despite short term headwind especially due to Covid-19 Pandemic
2. Nifty 500 Index covers 94% of India’s listed universe in terms of total
market capitalization making it ideal proxy for Indian equities.
3. Nifty 500 Index one of most benchmarked Index. It offers pure beta
exposure to Large, Mid and Small caps and all 19 Sectors defined by
NSE.
4. Performance of Nifty 500 Index is combination of Large, Mid and
Smallcap
5. Blending Nifty 500 Index with US Equity is expected to improve risk
adjusted returns over medium to long term
39 For Financial Professionals. Not for Public Distribution. PROPRIETARY. Permission to reprint or distribute any content from this
presentation requires the written approval of Motilal Oswal Asset Management Company.Disclaimers & Risk Factors
This presentation has been prepared and issued on the basis of internal data, publicly available information and other sources believed to be reliable. The information contained in this document
is for general purposes only and not a complete disclosure of every material fact and terms and conditions. The information / data herein alone is not sufficient and shouldn’t be used for the
development or implementation of an investment strategy. It should not be construed as investment advice to any party.
All opinions, figures, charts/graphs, estimates and data included in this presentation are as on date and are subject to change without notice. The statements contained herein may include
statements of future expectations and other forward-looking statements that are based on our current views and assumptions and involve known and unknown risks and uncertainties that could
cause actual results, performance or events to differ materially from those expressed or implied in such statements. Readers shall be fully responsible / liable for any decision taken on the basis
of this presentation. Investments in Securities are subject to market and other risks and there is no assurance or guarantee that the objectives of any of the Schemes will be achieved. The scheme
may not be suited to all categories of investors.
The material is based upon information that we consider reliable, but we do not represent that it is accurate or complete, and it should not be relied upon as such. Opinions, if any, expressed are
our opinions as of the date of appearing on this material only. While we endeavor to update on a reasonable basis the information discussed in this material, there may be regulatory,
compliance, or other reasons that prevent us from doing so. Recipient shall understand that the aforementioned statements cannot disclose all the risks and characteristics. The recipient is
requested to take into consideration all the risk factors including their financial condition, suitability to risk return, etc. and take professional advice before investing.
Passive Investments - The Scheme is not actively managed. Since the Scheme is linked to index, it may be affected by a general decline in the Indian markets relating to its underlying index. The
Scheme as per its investment objective invests in Securities which are constituents of its underlying index regardless of their investment merit. The AMC does not attempt to individually select
stocks or to take defensive positions in declining markets.
Index Fund - The Scheme being an index scheme follows a passive investment technique and shall only invest in Securities comprising one selected index as per investment objective of the
Scheme. The Fund Manager would invest in the Securities comprising the underlying index irrespective of the market conditions. If the Securities market declines, the value of the investment
held by the Scheme shall decrease.
Risks associated with overseas investment
To the extent the assets of the scheme are invested in overseas financial assets, there may be risks associated with currency movements, restrictions on repatriation and transaction procedures
in overseas market. Further, the repatriation of capital to India may also be hampered by changes in regulations or political circumstances as well as the application to it of other restrictions on
investment. In addition, country risks would include events such as introduction of extraordinary exchange controls, economic deterioration, and bi-lateral conflict leading to immobilisation of
the overseas financial assets and the prevalent tax laws of the respective jurisdiction for execution of trades or otherwise.
Currency Risk:
The fund may invest in overseas mutual fund / foreign securities as permitted by the concerned regulatory authorities in India. Since the assets will be invested in securities denominated in
foreign currencies, the Indian Rupee equivalent of the net assets, distributions and income may be adversely affected by changes/fluctuations in the value of the foreign currencies relative to the
Indian Rupee.
Country Risk:
The Country risk arises from the inability of a country, to meet its financial obligations. It is the risk encompassing economic, social and political conditions in a foreign country, which might
adversely affect foreign investors’ financial interests.
Mutual Fund Investments are subject to market risks, read all scheme related documents carefully
41 For Financial Professionals. Not for Public Distribution. PROPRIETARY. Permission to reprint or distribute any content from this
presentation requires the written approval of Motilal Oswal Asset Management Company.Disclaimers & Risk Factors
NSE Indices Limited Disclaimer: MOFM50 and MOFM100: MOFM50 and MOFM100 offered by Motilal Oswal Asset Management Company Limited (MOAMC) or its affiliates is not sponsored,
endorsed, sold or promoted by NSE Indices Limited and its affiliates. NSE Indices Limited and its affiliates do not make any representation or warranty, express or implied (including warranties of
merchantability or fitness for particular purpose or use) to the owners of MOFM50 and MOFM100 or any member of the public regarding the advisability of investing in securities generally or in
the MOFM50 and (MOFM100) linked to Nifty 50 Index and Nifty Midcap 100 Index respectively or particularly in the ability of Nifty 50 Index and Nifty Midcap 100 Index to track general stock
market performance in India. Please read the full Disclaimers in relation to the Nifty 50 Index and Nifty Midcap 100 Index in the Scheme Information Document.
The S&P 500 Index is a product of S&P Dow Jones Indices LLC or its affiliates (“SPDJI”) have been licensed for use by Motilal Oswal Asset Management Company Limited (MOAMC) . Standard &
Poor’s® and S&P® are registered trademarks of Standard & Poor’s Financial Services LLC (“S&P”); Dow Jones® is a registered trademark of Dow Jones Trademark Holdings LLC (“Dow
Jones”); Motilal Oswal S&P Index Fund (MOFSP500) is not sponsored, endorsed, sold or promoted by SPDJI, Dow Jones, S&P, their respective affiliates and none of such parties make any
representation regarding the advisability of investing in such product(s) nor do they have any liability for any errors, omissions, or interruptions of the S&P 500 Index.
The S&P 500 Index is a product of S&P Dow Jones Indices LLC or its affiliates (“SPDJI”) have been licensed for use by MOAMC. Standard & Poor’s® and S&P® are registered trademarks of Standard
& Poor’s Financial Services LLC (“S&P”); Dow Jones® is a registered trademark of Dow Jones Trademark Holdings LLC (“Dow Jones”); It is not possible to invest directly in an index. MOFSP500 is
not sponsored, endorsed, sold or promoted by SPDJI, Dow Jones, S&P, any of their respective affiliates (collectively, “S&P Dow Jones Indices”) S&P Dow Jones Indices does not make any
representation or warranty, express or implied, to the owners of the MOFSP500 or any member of the public regarding the advisability of investing in securities generally or in MOFSP500
particularly or the ability of the S&P 500 Index to track general market performance. Past performance of an index is not an indication or guarantee of future results. S&P Dow Jones Indices’ only
relationship to MOAMC with respect to the S&P 500 Index is the licensing of the Index and certain trademarks, service marks and/or trade names of S&P Dow Jones Indices and/or its
licensors. The S&P 500 Index is determined, composed and calculated by S&P Dow Jones Indices without regard to MOAMC or the MOFSP500. S&P Dow Jones Indices have no obligation to take
the needs of MOAMC or the owners of MOFSP500 into consideration in determining, composing or calculating the S S&P 500 Index. S&P Dow Jones Indices is not responsible for and has not
participated in the determination of the prices, and amount of MOFSP500 or the timing of the issuance or sale of MOFSP500 or in the determination or calculation of the equation by which
MOFSP500 is to be converted into cash, surrendered or redeemed, as the case may be. S&P Dow Jones Indices have no obligation or liability in connection with the administration, marketing or
trading of MOFSP500. There is no assurance that investment products based on the S&P 500 Index will accurately track index performance or provide positive investment returns. S&P Dow
Jones Indices LLC is not an investment or tax advisor. A tax advisor should be consulted to evaluate the impact of any tax-exempt securities on portfolios and the tax consequences of making any
particular investment decision. Inclusion of a security within an index is not a recommendation by S&P Dow Jones Indices to buy, sell, or hold such security, nor is it considered to be investment
advice.
NEITHER S&P DOW JONES INDICES NOR THIRD PARTY LICENSOR GUARANTEES THE ADEQUACY, ACCURACY, TIMELINESS AND/OR THE COMPLETENESS OF THE S&P 500 Index OR ANY DATA
RELATED THERETO OR ANY COMMUNICATION, INCLUDING BUT NOT LIMITED TO, ORAL OR WRITTEN COMMUNICATION (INCLUDING ELECTRONIC COMMUNICATIONS) WITH RESPECT
THERETO. S&P DOW JONES INDICES AND SHALL NOT BE SUBJECT TO ANY DAMAGES OR LIABILITY FOR ANY ERRORS, OMISSIONS, OR DELAYS THEREIN. S&P DOW JONES INDICES AND MAKES NO
EXPRESS OR IMPLIED WARRANTIES, AND EXPRESSLY DISCLAIMS ALL WARRANTIES, OF MERCHANTABILITY OR FITNESS FOR A PARTICULAR PURPOSE OR USE OR AS TO RESULTS TO BE OBTAINED BY
MOAMC, OWNERS OF MOFSP500, OR ANY OTHER PERSON OR ENTITY FROM THE USE OF THE S&P 500 Index OR WITH RESPECT TO ANY DATA RELATED THERETO. WITHOUT LIMITING ANY OF THE
FOREGOING, IN NO EVENT WHATSOEVER SHALL S&P DOW JONES INDICES BE LIABLE FOR ANY INDIRECT, SPECIAL, INCIDENTAL, PUNITIVE, OR CONSEQUENTIAL DAMAGES INCLUDING BUT NOT
LIMITED TO, LOSS OF PROFITS, TRADING LOSSES, LOST TIME OR GOODWILL, EVEN IF THEY HAVE BEEN ADVISED OF THE POSSIBLITY OF SUCH DAMAGES, WHETHER IN CONTRACT, TORT, STRICT
LIABILITY, OR OTHERWISE. THERE ARE NO THIRD PARTY BENEFICIARIES OF ANY AGREEMENTS OR ARRANGEMENTS BETWEEN S&P DOW JONES INDICES AND MOAMC, OTHER THAN THE
LICENSORS OF S&P DOW JONES INDICES
42 For Financial Professionals. Not for Public Distribution. PROPRIETARY. Permission to reprint or distribute any content from this
presentation requires the written approval of Motilal Oswal Asset Management Company.Disclaimers & Risk Factors
NASDAQ OMX Group, Inc.
The Product i.e. MOFN100 is not sponsored, endorsed, sold or promoted by The NASDAQ OMX Group, Inc. or its affiliates (NASDAQ OMX, with its affiliates, are referred to as the “Corporations”).
The Corporations have not passed on the legality or suitability of, or the accuracy or adequacy of descriptions and disclosures relating to, the Product. The Corporations make no representation
or warranty, express or implied to the owners of the Product or any member of the public regarding the advisability of investing in securities generally or in the Product particularly, or the ability
of the Nasdaq-100 Index® to track general stock market performance. The Corporations' only relationship to Motilal Oswal Asset Management Company Ltd. (“Licensee”) is in the licensing of the
NASDAQ®, OMX®, NASDAQ OMX®, NASDAQ-100®, and NASDAQ-100 Index® registered trademarks, and certain trade names of the Corporations and the use of the NASDAQ-100 Index® which is
determined, composed and calculated by NASDAQ OMX without regard to Licensee or the Product. NASDAQ OMX has no obligation to take the needs of the Licensee or the owners of the
Product(s) into consideration in determining, composing or calculating the NASDAQ-100 Index®. The Corporations are not responsible for and have not participated in the determination of the
timing of, prices at, or quantities of the Product to be issued or in the determination or calculation of the equation by which the Product is to be converted into cash. The Corporations have no
liability in connection with the administration, marketing or trading of the Product.
THE CORPORATIONS DO NOT GUARANTEE THE ACCURACY AND/OR UNINTERRUPTED CALCULATION OF THE NASDAQ-100 INDEX® OR ANY DATA INCLUDED THEREIN. THE CORPORATIONS MAKE NO
WARRANTY, EXPRESS OR IMPLIED, AS TO RESULTS TO BE OBTAINED BY LICENSEE, OWNERS OF THE PRODUCT(S), OR ANY OTHER PERSON OR ENTITY FROM THE USE OF THE NASDAQ-100 INDEX®
OR ANY DATA INCLUDED THEREIN. THE CORPORATIONS MAKE NO EXPRESS OR IMPLIED WARRANTIES, AND EXPRESSLY DISCLAIM ALL WARRANTIES OF MERCHANTABILITY OR FITNESS FOR A
PARTICULAR PURPOSE OR USE WITH RESPECT TO THE NASDAQ-100 INDEX® OR ANY DATA INCLUDED THEREIN. WITHOUT LIMITING ANY OF THE FOREGOING, IN NO EVENT SHALL THE
CORPORATIONS HAVE ANY LIABILITY FOR ANY LOST PROFITS OR SPECIAL, INCIDENTAL, PUNITIVE, INDIRECT, OR CONSEQUENTIAL DAMAGES, EVEN IF NOTIFIED OF THE POSSIBILITY OF SUCH
DAMAGES.
BSE
The Bombay Stock Exchange Limited (“the Exchange”) has given vide its letter dated February 10, 2011 permission to the Mutual Fund to use the Exchange’s name in this Scheme Information
Document as one of the stock exchanges on which the Mutual Fund’s units are proposed to be listed subject to, the Mutual Fund fulfilling the various criteria for listing. The Exchange has
scrutinized this Scheme Information Document for its limited internal purpose of deciding on the matter of granting the aforesaid permission to the Mutual Fund. The Exchange does not in any
manner:-
1. warrant, certify or endorse the correctness or completeness of any of the contents of this SID;
2. warrant that the Mutual Fund’s units will be listed or will continue to be listed on the Exchange;
3. take any responsibility for the financial or other soundness of the Mutual Fund, its sponsors, its promoters, its management or any scheme or project of this Mutual Fund.
and should not for any reason be deemed or construed that the Scheme Information Document has been cleared or approved by the Exchange. Every person who desires to apply for or
otherwise acquire any units of Motilal Oswal NASDAQ-100 (MOFN100) of this Mutual Fund may do so pursuant to independent inquiry, investigation and analysis and shall not have any claim
against the Exchange whatsoever by reason of any loss which may be suffered by such person consequent to or in connection with such subscription /acquisition whether by reason of anything
stated or omitted to be stated herein or any other reason whatsoever.
43 For Financial Professionals. Not for Public Distribution. PROPRIETARY. Permission to reprint or distribute any content from this
presentation requires the written approval of Motilal Oswal Asset Management Company.Thank You “An investor might be Better off buying the market” - By Warren Buffett Contact Us - Speak: +91-22 40548002 | 8108622222 Write: mfservice@motilaloswal.com Visit: www.motilaloswalmf.com
You can also read