Schwab Indexed Retirement Trust Funds - (SIRT Funds) Collective trust funds maintained by Charles Schwab Bank - Charles Schwab Trust Bank CITs
←
→
Page content transcription
If your browser does not render page correctly, please read the page content below

Schwab Indexed
Retirement Trust
Funds ®
(SIRT Funds)

Collective trust funds maintained by
Charles Schwab Bank
Performance reports as of March 31, 2018
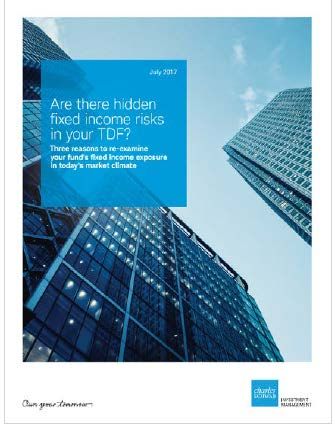
Table of contents

 Schwab target date solutions overview
 Capital markets summary
 SIRT funds performance & attribution review
 Underlying strategy performance
 SIRT funds update
 Appendix

        For institutional use only             Charles Schwab   2
Schwab Target
                                                                                        Date Solutions

*Includes Schwab Managed Retirement Trust Funds (“SMRT”) and Schwab Indexed Retirement Trust Funds (“SIRT”), collective trusts maintained by Charles Schwab Bank, and
Schwab Target Funds and Schwab Target Index Funds, mutual funds maintained by Charles Schwab Investment Management, Inc.

                    For institutional use only                                                                                                       Charles Schwab     3
Schwab’s target date fund solutions

                                      Schwab Managed                         Schwab Indexed
                                         Retirement                          Retirement Trust                     Schwab Target                          Schwab Target
                                        Trust Funds™                              Funds®                             Funds                                Index Funds
                                       (SMRT Funds)                            (SIRT Funds)

                Structure                                  Collective Trust Funds                                                       Mutual Funds

                                                                                                                              Designed for retail investors
           Target market                   Designed exclusively for qualified retirement plans
                                                                                                                        and employer-sponsored retirement plans
                                                                                                                 Proprietary and Sub-
Underlying investments                                         Sub-Advised                                                                                   Proprietary
                                                                                                                  Advised/Third Party

      Oversight structure                Maintained by Schwab Bank as trustee for the funds                                 Maintained and managed by CSIM

        Investment style                    Active/Passive                           Passive                         Active/Passive                            Passive

             AUM ($MM)                           $12,144                             $2,329                              $4,090                                 $557

                Inception                      10/1/2002                            1/05/2009                          7/01/2005                             8/25/2016

                                           0.33%—0.89%                            0.08%                             0.30%—0.77%1                             0.08% 2
            Net expense
                                           Six unit classes                    One unit class                       One share class                       One share class

As of March 31, 2018.
Investment minimums may apply.
1Asof the most recent prospectus, the investment adviser and its affiliates have agreed to limit the total annual fund operating expenses (excluding interest, taxes, and certain non-
routine expenses) of each of the funds to 0.00% for so long as the investment advisor serves as the advisor to the fund. This agreement may only be amended or terminated with
the approval of a fund’s Board of Trustees. This agreement to limit the total annual fund operating expenses is limited to the fund’s direct operating expenses and, therefore, does
not apply to acquired fund fees and expenses (AFFE), which are indirect expenses incurred by the fund through its investments in the underlying funds.
2Asof the most recent prospectus, the investment adviser and its affiliates have agreed to limit the total annual fund operating expenses (including acquired fund fees and
expenses (AFFEs), but excluding, taxes and certain non-routine expenses) of each of the funds 0.08% for so long as the investment adviser serves as adviser to the funds. This
agreement may only be amended or terminated with the approval of a fund’s Board of Trustees. AFFEs are indirect expenses incurred by the fund through its investments in the
underlying funds.

                        For institutional use only                                                                                                                  Charles Schwab       4
Investment management teams share accountability
Collaborative management by dedicated teams coupled with institutional oversight.
CSIM Multi-Asset Strategic Leadership
· Collaborates with investment teams
· Prioritizes strategic portfolio needs and research agenda
Asset Allocation Research Portfolio Management Sub-Advisor Oversight1
· Annual capital markets · Evaluates research and · Thorough ongoing due
assumptions develops recommendations diligence by experienced
· Glide path review · Implements decisions, analysts with a dedicated
maintains allocations, focus
· Asset class review
rebalancing and cash flow · Utilize quantitative and
· Scenario modeling, stress management qualitative criteria to
tests, real data comparison identify best in class
· Accountable for adherence
to objectives and guidelines strategies
and fund performance · Present strategies that best
fit portfolio needs
Investment Risk Oversight Investment Committees2
· An objective set of eyes, specifically · Oversee all decisions to ensure that
focused on identifying and reducing risk processes are properly followed
1Sub-Advisor Oversight provides direct oversight of all sub-advised and third-party strategies.
2Forcollective trust funds, recommendations are given to the Charles Schwab Bank’s Collective Trust Fund Administrative Committee and Investment Committee for final decision
and implementation. (0117-SAPY)
For institutional use only Charles Schwab 5An experienced investment management team
Our approach combines a set of diverse perspectives that aligns your interests with a
robust and scalable investing process.
CSIM Multi-Asset Strategic Leadership
Omar Aguilar Brett Wander Jon de St. Paer John Sturiale Jake Gilliam
PhD, SVP, CIO CFA, SVP, CIO SVP, Head of Strategy, CFP, SVP CFA, AIF, Director
Equities & Multi- Fixed Income Governance and Head of Sales & Senior Multi-Asset
Asset Strategies Product Management Client Relations Class Portfolio Strategist
Asset Allocation Research Portfolio Management1 Sub-Advisor Oversight2
· Emre Erdogan, PhD, CFA · John Greves, CFA · Tracy Pike, CFA
· Natallia Yazhova · Zifan Tang, PhD, CFA · Matt Flood, CFA
· Elijah DePalma, PhD · Tony Creasy, CFA · Andrew King, CFA
· Genta Bordoniqi · Patrick Kwok, CFA · Don Kowalchik
· Dan Piquet, CFA · Stephen McCulloch, CFA
· Drew Hayes, CFA
Investment Risk Oversight Investment Committees3
· Patrick Cassidy, SVP, CFA · CSIM Asset Allocation Committee, CSIM
· Mark Lundin, PhD Sub-Advisor Oversight Committee, CSIM
and Schwab Bank Investment Committees
1 Zifan Tang, Patrick Kwok, and Drew Hayes manage both the Schwab Target Funds and Schwab Target Index Funds. Tony Creasy and Dan Piquet manage the SMRT and SIRT
Funds.
2Sub-Advisor Oversight provides direct oversight of all sub-advised and third-party strategies.
3For collective trust funds, recommendations are given to the Charles Schwab Bank’s Collective Trust Fund Administrative Committee and Investment Committee for final decision
and implementation. For institutional use only Charles Schwab 6
(0117-SAPY)Our glide path has been designed with retirement plan
participants in mind
SIRT Funds glide path (and underlying asset classes)
< Starting allocation
95% Equity
Target date
40% Equity
> Final allocation
25% Equity
>
5% Fixed Income 53% Fixed Income 66% Fixed Income
0% Cash Equivalents 7% Cash Equivalents 9% Cash Equivalents
100%
World Bond
90%
Inflation-Protected Bond
80%
Cash Equivalents
70% Short-Term Bond
60%
More stability Intermediate-Term Bond
50%
potential Commodities Broad Basket
40% Global Real Estate
30% Diversified Emerging Markets
International Equity
20%
More growth potential
Small Cap (Domestic)
10%
Large Cap (Domestic)
0%
45 40 35 30 25 20 15 10 5 0 +5 +10 +15 +20 +25
Initialization Transition Target Retirement Phase
Accumulation Phase
Phase Phase Date (years after target date)
The values of the funds will fluctuate up to and after the target dates. There is no guarantee the funds will provide adequate income at or through retirement. Asset
diversification and allocation strategies do not ensure a profit and cannot protect against losses in a declining market.
Equity asset classes include Domestic Equity, International Equity, Diversified Emerging Markets, Global Real Estate and Commodities. Fixed Income asset classes include
Intermediate-Term Bond, Short-Term Bond, Cash Equivalents, Inflation-Protected Bond and World Bond.
(0218-81FH)
For institutional use only Charles Schwab 7Key risks are potentially reduced as retirement
approaches and beyond
Less As retirement approaches More
Equity
Portfolio > Domestic Small Cap Domestic Large Cap
International Domestic
Emerging Markets International (Developed)
Commodities Domestic
>
Fixed Credit Risk Inflation-Protection (U.S. TIPS)
Income/Cash
Equivalents Duration Short-Term Bonds & Cash Equivalents
Portfolio
International Domestic
For institutional use only Charles Schwab 8SIRT Funds underlying asset classes
TOTAL
UNDERLYING
ASSET CLASS CORRESPONDING INDEX FUND INVESTMENT
FUND AUM
($MM)1
EQUITY
Domestic Equity (Large Cap) Russell 1000 Index BNY Mellon Large Cap Stock Index Fund Instl $15,181
Domestic Equity (Small Cap) Russell 2000 Index BNY Mellon Small Cap Stock Index Fund Instl $3,531
International Equity MSCI EAFE Index (Net) BNY Mellon Intl Stock Index Fund Instl $23,740
Diversified Emerging Markets MSCI Emerging Markets Index (Net) SSgA Emerging Markets Index Fund A $61,693
Global Real Estate FTSE EPRA/NAREIT Developed Index (Net) BlackRock Developed Real Estate Index Fund E $2,730
Commodities Broad Basket Bloomberg Commodity Index BlackRock Commodity Index Daily Fund E $1,720
FIXED INCOME
Bloomberg Barclays U.S. Government/Credit: 1-3
Short-Term Bond SSgA U.S. Short-Term Government/Credit Bond Index Fund A $3,880
Years Index
Intermediate-Term Bond Bloomberg Barclays U.S. Aggregate Bond Index BNY Mellon U.S. Aggregate Bond Index Fund Instl $29,385
Inflation-Protected Bond Bloomberg Barclays U.S. Treasury Inflation
BlackRock U.S. TIPS Index Fund E $52,600
(U.S. TIPS) Protected Securities (TIPS) Index
Bloomberg Barclays Global Aggregate Bond ex-US
World Bond BlackRock Global Aggregate Bond Fund Ex-USD $2,489
Hedged Index
CASH EQUIVALENTS
Cash Equivalents Citigroup 3 Month T-Bill Index State Street U.S. Government Short Term Investment Fund $11,790
Total $208,739
Investment
Managers >
As of December 31, 2017.
1Includes firm assets in mutual funds, collective trust funds, and separate accounts as of December 31, 2017.
For institutional use only Charles Schwab 9The DOL has provided general guidance for selecting and
monitoring TDFs
“Non-proprietary TDFs could also offer advantages by including
component funds that are managed by fund managers other than the
TDF provider itself, thus diversifying participants’ exposure to one
investment provider.” DOL
Guidance
-U.S. DOL, 20131 Highlights
Objectively comparing and selecting TDFs
Evaluation Evaluating non-proprietary or custom TDFs
Using resources to evaluate the selected TDFs
Understanding the TDF’s investments
Plan’s TDF
Review fees and investment expenses
Investment
Periodic review of selected TDFs
Communications Develop effective employee communications
Recordkeeping Documenting the process
1Source:
U.S. Department of Labor, “Target Date Retirement Funds – Tips for ERISA Plan Fiduciaries,” February 2013. The complete fact sheet is available at
www.dol.gov/ebsa/newsroom/fstdf.html.
For institutional use only Charles Schwab 10Capital
Markets
Review
For institutional use only Charles Schwab 11Capital markets summary—1st quarter 2018
Rocky Road
2 The quarter started off in positive territory, with a number of indices peaking on
>
1.42 Russell 1000 TR USD January 26th, however, volatility appeared in February and continued throughout
Equity March which resulted in many major equity and fixed income indices ending the
1
quarter down. Overall, the MSCI Emerging Markets Index was the top performing
Russell 2000 TR USD index while the Bloomberg Barclays US Aggregate Bond Index ended lower than most
0 domestic equity indices. During the quarter, investors became jittery due to ongoing
-0.08 negative political news, surfacing global trade issues, rising inflation fears and
-0.40 MSCI EAFE NR USD continuing tightening of monetary policy by the Federal Reserve. At the last Federal
-0.69
-1 Open Market Committee meeting, the new Fed chair Jerome Powell, indicated that a
continual pace of rate hikes were likely based on the Committee’s positive economic
MSCI EM NR USD predictions. While the markets were unsteady, the U.S. economy did not show signs
-1.53
-2 of slowing down. Leading economic indicators continued upward trends, corporate
earnings remained strong and global merger and acquisition deals recorded the third
FTSE EPRA/NAREIT
-3
biggest month ever in March. For the quarter, most major domestic equity indices
Developed NR USD
ended down led by global REITs, developed international markets and domestic large
cap equities.
Bloomberg Commodity TR
-4 USD Within the U.S., large cap equities impacted by global trade concerns underperformed
small cap equities and growth continued to outperform value. Within sectors,
-4.53
-5 technology was the best performing sector while dividend-paying sectors performed
poorly as a result of rising rates. Commodities ended the quarter in negative territory
due to falling livestock prices in the U.S. and falling industrial metal prices.
2
>
Overseas markets like the U.S. started the quarter off well, positive macroeconomic,
Fixed Bloomberg Barclays US geopolitical and strong corporate conditions continued from 2017. However, as in
Income Govt/Credit 1-3 Yr TR USD U.S., February and March turned out to be a challenge for international equities;
0.94 investors grew negative based on rising concerns of increased inflation and interest
1
rates and most importantly fears of a global trade war. Overall, smaller cap equities,
Bloomberg Barclays US Agg
Bond TR USD which are less dependent upon foreign trade and the global economy, outperformed
0.35 larger cap equities and growth outpaced value. While developed equities ended the
quarter in the red, emerging markets ended the quarter strong largely due to optimism
Bloomberg Barclays Global
0 about economic progress in Brazil, modest gains in China and Mexico and a falling
Agg Ex USD TR Hdg USD
dollar. Global REITs fared the worst in the quarter, negative returns were driven by
-0.20
rising U.S. rates which put pressure on prices of U.S. REITs. U.S. REITs make up
Bloomberg Barclays US nearly half of the global REIT index.
Treasury US TIPS TR USD
-0.79 Volatility also found its way into the fixed income markets. Fears of rising inflation and
-1
the rising rate environment caused many domestic bond indices to end the quarter in
Citi Treasury Bill 3 Month
USD
negative territory. The Bloomberg Barclays U.S. Aggregate Index experienced its first
-1.46 negative quarter in over a year. Conversely, lower duration bonds, benefitting from the
rising rate environment, performed well. Likewise, global bonds also performed well
-2 due to a more accommodating monetary policy by Banks overseas, more robust
global growth projections and a weakening U.S. dollar.
Past performance is no guarantee of future results. Indexes are unmanaged, do not incur management fees, costs and expenses, and cannot be invested in directly.
Source: Return data provided by Morningstar, Inc. Content comes from a variety of sources including, but not limited to, Morningstar, CSIM, external investment managers. See
Disclosures for additional detail.
For institutional use only Charles Schwab 12Capital markets summary—1-year as of March 31, 2018
>
30
Equity
Russell 1000 TR USD
24.93
25
Russell 2000 TR USD
20
MSCI EAFE NR USD
14.80
15 13.98
MSCI EM NR USD
11.79 Markets still up
10
FTSE EPRA/NAREIT Developed
For 1 year period, equities and fixed income remained in the green regardless of a
NR USD volatile and jittery first quarter. Emerging Markets ended the period in the top
spot, posting about a 25% return, followed by developed international markets
5 3.71 Bloomberg Commodity TR USD and large cap domestic equities. Growth outperformed value and large cap
3.23
equities outperformed small cap equities. In general, passively managed strategies
continued to outperform actively managed strategies. Within U.S. sectors,
0
information technology was the clear winning returning over 27%, followed by
4 financials and consumer discretionary. Conversely, telecom, consumer staples and
energy did not perform as well and ended the period in negative territory.
Fixed
Income > 3
3.38 Bloomberg Barclays US
Govt/Credit 1-3 Yr TR USD
Commodities and global REITs posted positive returns for the 1-year period;
however they continued to lag domestic and international equities. Within fixed
income, solid global demand and low inflation helped bonds overall, particularly
Bloomberg Barclays US Agg global bonds.
Bond TR USD
Bloomberg Barclays Global
2
Agg Ex USD TR Hdg USD
1.20 1.07 Bloomberg Barclays US
Treasury US TIPS TR USD
1 0.92
Citi Treasury Bill 3 Month
0.24 USD
0
Past performance is no guarantee of future results. Indexes are unmanaged, do not incur management fees, costs and expenses, and cannot be invested in directly.
Source: Return data provided by Morningstar, Inc. Content comes from a variety of sources including, but not limited to, Morningstar, CSIM, Schwab Center for Investment
Research and external investment managers. See Disclosures for additional detail.
For institutional use only Charles Schwab 13Performance
and Attribution
Review
For institutional use only Charles Schwab 14Performance summary: 1Q2018
Performance
Category
vs. Custom Key Comments
Fund Performance
Index1
Percentile
Ranking2
(+/-) %
SIRT 2010 Fund Cl I -0.84 0.04 70 For the 1st quarter, the funds ranked in the 56th percentile on average
versus peers. Performance versus custom blended indices was in line
with expectations.
SIRT 2015 Fund Cl I -0.83 0.06 61
Dispersion for the Funds ranged from 4 bps to 17 bps and was primarily a
result of fair value pricing. On a non-Fair Value Pricing basis, dispersion
SIRT 2020 Fund Cl I -0.66 0.07 39
was within tracking error expectations.
SIRT 2025 Fund Cl I -0.65 0.11 45
Glide Path Impact:
SIRT 2030 Fund Cl I -0.68 0.11 41 Equities outperformed fixed income during the quarter despite the market
sell-off that started in February. This led to mixed results across the glide
SIRT 2035 Fund Cl I -0.70 0.12 56 path. Longer dated funds which have higher allocations to equities
benefitted and performed well. Conversely, the shorter dated funds did
not perform as well due to the lower allocation to equities.
SIRT 2040 Fund Cl I -0.71 0.13 53
SIRT 2045 Fund Cl I -0.73 0.16 61 Asset Allocation:
The funds’ strategic asset allocation was also mixed. A higher allocation
SIRT 2050 Fund Cl I -0.74 0.17 59 to REITs which significantly underperformed equities and a lower
allocation relative to peers to emerging markets, which outperformed
most other equity markets, detracted from performance throughout all
SIRT 2055 Fund Cl I -0.75 0.16 67
the funds. In the shorter dated funds, a higher allocation to cash and
short duration fixed income, which benefited from rate increases,
SIRT 2060 Fund Cl I -0.82 0.12 69 contributed to performance.
As of March 31, 2018.
Past performance is no guarantee of future results. Investment return and principal value will fluctuate, and shares, when redeemed, may be worth more or less than original
cost. Fund performance includes the reinvestment of all income and is presented net of all fees. The values of the target date fund will fluctuate up to and after the target date.
There is no guarantee the funds will provide adequate income at or through retirement.
1The custom indices are composite blended indices developed by Charles Schwab Investment Management, Inc. based on each fund’s asset allocation. The components that make
up a custom index may vary over time. See Disclosures for more detail.
2The percentile rank is the fund’s total-return percentile rank relative to all funds that have the same Morningstar Category. The highest (or most favorable) percentile rank is 1 and
the lowest (or least favorable) is 100.
Source: Charles Schwab Investment Management, Inc. and Morningstar, Inc.
For institutional use only. Charles Schwab 15Performance summary: 1-year
Performance
Category
vs. Custom Key Comments
Fund Performance
Index1
Percentile
Ranking2
(+/-) %
SIRT 2010 Fund Cl I 5.66 0.00 63 The funds underperformed the peer group, ranking on average in the 69th
percentile. Performance versus the funds’ custom blended indices was in line
with expectations.
SIRT 2015 Fund Cl I 5.93 0.00 76
Dispersion for the 2010 to 2060 funds ranged from 0 bps to 14 bps.
SIRT 2020 Fund Cl I 7.37 0.00 66
Glide Path Impact:
SIRT 2025 Fund Cl I 8.96 0.07 62 Relative performance from the glide path was mixed for the 1-year period
due to strong outperformance of equities relative to fixed income. Longer
SIRT 2030 Fund Cl I 10.09 0.07 66 dated funds which have a higher allocation to equities benefited from the
strong equity markets. Conversely, shorter dated funds lagged due to a lower
allocation to equities. Returns for SIRT Class I were between 13.20% in the
SIRT 2035 Fund Cl I 11.03 0.09 72 later dated funds to 5.66% in the nearer dated funds.
SIRT 2040 Fund Cl I 11.93 0.10 72
Asset Allocation:
SIRT 2045 Fund Cl I 12.51 0.13 76 The funds’ strategic asset allocation detracted from performance during the
year primarily due to exposure to REITs, which while posting positive returns,
underperformed most major equity markets. Additionally, a lower allocation
SIRT 2050 Fund Cl I 12.86 0.14 69 relative to peers to emerging markets and developed foreign equities which
outperformed domestic equities also detracted from returns. A lower
SIRT 2055 Fund Cl I 13.19 0.14 65 allocation to TIPs relative to peers contributed positively to returns for the
shorter dated funds.
SIRT 2060 Fund Cl I 13.20 0.05 68
As of March 31, 2018.
Past performance is no guarantee of future results. Investment return and principal value will fluctuate, and shares, when redeemed, may be worth more or less than original
cost. Fund performance includes the reinvestment of all income and is presented net of all fees. The values of the target date fund will fluctuate up to and after the target date.
There is no guarantee the funds will provide adequate income at or through retirement.
1The custom indices are composite blended indices developed by Charles Schwab Investment Management, Inc. based on each fund’s asset allocation. The components that make
up a custom index may vary over time. See Disclosures for more detail.
2The percentile rank is the fund’s total-return percentile rank relative to all funds that have the same Morningstar Category. The highest (or most favorable) percentile rank is 1 and
the lowest (or least favorable) is 100.
Source: Charles Schwab Investment Management, Inc. and Morningstar, Inc.
For institutional use only. Charles Schwab 16SIRT Funds’ performance vs. Morningstar category peers
Morningstar Percentile Ranks vs. Peers
As of March 31, 2018(Net of fees)
RANK IN
MORNINGSTAR FUNDS IN CATEGORY
CATEGORY2,3
% PEER
FUND % EQUITY1 1 YR 3 YR 5 YR 1 YR 3 YR 5 YR
EQUITY
SIRT 2010 37% 39% 63 70 67 129 110 87
Morningstar Category: Target-Date 2000-2010 MF
SIRT 2015 39% 43% 76 72 67 133 105 74
Morningstar Category: Target-Date 2015 MF
SIRT 2020 46% 46% 66 51 35 245 200 159
Morningstar Category: Target-Date 2020 MF
SIRT 2025 59% 57% 62 39 30 215 173 136
Morningstar Category: Target-Date 2025 MF
SIRT 2030 68% 68% 66 42 29 235 190 149
Morningstar Category: Target-Date 2030 MF
SIRT 2035 76% 75% 72 46 33 210 168 131
Morningstar Category: Target-Date 2035 MF
SIRT 2040 83% 82% 72 42 28 235 190 149
Morningstar Category: Target-Date 2040 MF
SIRT 2045 88% 86% 76 45 22 210 168 131
Morningstar Category: Target-Date 2045 MF
SIRT 2050 91% 87% 69 37 21 231 185 144
Morningstar Category: Target-Date 2050 MF
SIRT 2055 94% 88% 65 37 -- 208 159 --
Morningstar Category: Target-Date 2055 MF
SIRT 2060 95% 88% 68 -- -- 162 -- --
Morningstar Category: Target-Date 2060+ MF
Past performance is no guarantee of future results. Investment return and principal value will fluctuate, and shares, when redeemed, may be
worth more or less than original cost. Fund performance includes the reinvestment of all income and is presented net of all fees.
1% Equity represents the 2018 Policy Allocation and includes all assets not classified as cash or fixed income.
1-25 Top quartile
2
The percentile rank is the fund’s total-return percentile rank relative to all funds that have the same Morningstar Category. The highest (or most
26-50 Second quartile
favorable) percentile rank is 1 and the lowest (or least favorable) is 100. The top-performing fund in a category will always receive a rank of 1%.
Rank in Category is based on total returns which include reinvested dividends and capital gains, if any, and exclude sales charges. 51-75 Third quartile
3 76-100 Bottom quartile
Ranks are for Unit Class I. Dashed indicate performance and rank data is not available.
Source: Morningstar, Inc.
For institutional use only. Charles Schwab 17SIRT Funds – Rankings Summary
Average 3 and 5 Year Category Rankings as of March 31, 2018.
0%
25%
50%
75%
100%
Jan-13 Aug-13 Mar-14 Oct-14 May-15 Dec-15 Jun-16 Jan-17 Aug-17 Mar-18
3-Year 5-Year
Ranks are for Unit Class I.
For institutional use only Charles Schwab 18SIRT Funds Performance
Annualized Returns (%)
(not annualized if less than 1 year)
As of March 31, 2018 3 Month 3 Month % YTD YTD % 1 Year 1 Year % 3 Year 3 Year % 5 Year 5 Year %
SIRT 2010 -0.84 70 -0.84 70 5.66 63 3.95 70 4.94 67
2010 Custom Index -0.88 -- -0.88 -- 5.66 -- 4.04 -- 5.06 --
Morningstar Category: Target-Date 2000-2010 MF -0.71 -- -0.71 -- 5.94 -- 4.11 -- 5.06 --
SIRT 2015 -0.83 61 -0.83 61 5.93 76 4.13 72 5.35 67
2015 Custom Index -0.89 -- -0.89 -- 5.93 -- 4.22 -- 5.46 --
Morningstar Category: Target-Date 2015 MF -0.74 -- -0.74 -- 6.87 -- 4.43 -- 5.55 --
SIRT 2020 -0.66 39 -0.66 39 7.37 66 4.86 51 6.40 35
2020 Custom Index -0.73 -- -0.73 -- 7.37 -- 4.94 -- 6.52 --
Morningstar Category: Target-Date 2020 MF -0.81 -- -0.81 -- 7.60 -- 4.65 -- 5.74 --
SIRT 2025 -0.65 45 -0.65 45 8.96 62 5.77 39 7.40 30
2025 Custom Index -0.76 -- -0.76 -- 8.89 -- 5.82 -- 7.49 --
Morningstar Category: Target-Date 2025 MF -0.75 -- -0.75 -- 9.10 -- 5.42 -- 6.69 --
SIRT 2030 -0.68 41 -0.68 41 10.09 66 6.38 42 8.13 29
2030 Custom Index -0.79 -- -0.79 -- 10.02 -- 6.43 -- 8.22 --
Morningstar Category: Target-Date 2030 MF -0.75 -- -0.75 -- 10.37 -- 6.07 -- 7.36 --
SIRT 2035 -0.70 56 -0.70 56 11.03 72 6.91 46 8.78 33
2035 Custom Index -0.82 -- -0.82 -- 10.94 -- 6.93 -- 8.84 --
Morningstar Category: Target-Date 2035 MF -0.61 -- -0.61 -- 11.73 -- 6.73 -- 8.16 --
SIRT 2040 -0.71 53 -0.71 53 11.93 72 7.36 42 9.27 28
2040 Custom Index -0.84 -- -0.84 -- 11.83 -- 7.40 -- 9.35 --
Morningstar Category: Target-Date 2040 MF -0.66 -- -0.66 -- 12.42 -- 7.04 -- 8.48 --
SIRT 2045 -0.73 61 -0.73 61 12.51 76 7.67 45 9.59 22
2045 Custom Index -0.89 -- -0.89 -- 12.38 -- 7.70 -- 9.67 --
Morningstar Category: Target-Date 2045 MF -0.54 -- -0.54 -- 13.18 -- 7.38 -- 8.89 --
SIRT 2050 -0.74 59 -0.74 59 12.86 69 7.82 37 9.79 21
2050 Custom Index -0.91 -- -0.91 -- 12.72 -- 7.87 -- 9.88 --
Morningstar Category: Target-Date 2050 MF -0.62 -- -0.62 -- 13.25 -- 7.41 -- 8.91 --
SIRT 2055 -0.75 67 -0.75 67 13.19 65 8.01 37 -- --
2055 Custom Index -0.91 -- -0.91 -- 13.05 -- 8.03 -- -- --
Morningstar Category: Target-Date 2055 MF -0.52 -- -0.52 -- 13.61 -- 7.61 -- -- --
SIRT 2060 -0.82 69 -0.82 69 13.20 68 -- -- -- --
2060 Custom Index -0.94 -- -0.94 -- 13.15 -- -- -- -- --
Morningstar Category: Target-Date 2060+ MF -0.60 -- -0.60 -- 13.72 -- -- -- -- --
Past performance is no guarantee of future results. Investment return and principal value will fluctuate, and shares, when redeemed, 1-25 Top quartile
may be worth more or less than original cost. Fund performance includes the reinvestment of all income and is presented net of all fees.
26-50 Second quartile
SIRT Fund returns reflect Unit Class I. 51-75 Third quartile
Source: Morningstar, Inc. 76-100 Bottom quartile
For institutional use only. Charles Schwab 19Underlying
Strategy
Performance
For institutional use only Charles Schwab 20Performance of SIRT Funds underlying investment strategies
Annualized Return Net of Fees1
As of March 31, 2018
Date
Added Since
1 Month 3 Month YTD 1 Year 3 Year 5 Year 10 Year
to Inception
>
SIRT Funds
Domestic BNY Mellon Large Cap Stock Index Fund Instl (Inception: Fund-3/13/09) 11/21/13 -2.27 -0.70 -0.70 13.97 10.37 13.15 --
Equity Russell 1000® Index -2.27 -0.69 -0.69 13.98 10.39 13.17 9.61
Morningstar Category: Large Blend -2.12 -0.98 -0.98 12.82 8.89 11.72 8.58
BNY Mellon Small Cap Index Fund Instl (Inception: Fund-8/31/86) 11/21/13 1.30 -0.08 -0.08 11.75 8.31 -- --
Russell 2000® Index 1.29 -0.08 -0.08 11.79 8.39 11.47 9.84
>
Morningstar Category: Small Blend 1.08 -0.93 -0.93 9.68 7.21 10.29 9.15
International BNY Mellon International Stock Index Fund Instl (Inception: Fund-10/16/09) 11/24/09 -0.76 -0.90 -0.90 15.54 5.99 6.72 --
Equity MSCI EAFE Index (Net) -1.80 -1.53 -1.53 14.80 5.55 6.50 2.74
Morningstar Category: Foreign Large Blend -0.81 -0.86 -0.86 15.20 5.75 6.21 2.64
SSgA Emerging Markets Index Fund A 12/31/13 -0.73 1.85 1.85 25.45 8.71 4.82 --
MSCI Emerging Markets Index (Net) -1.86 1.42 1.42 24.93 8.81 4.99 3.02
>
Morningstar Category: Diversified Emerging Markets -0.73 2.01 2.01 22.90 8.23 4.45 3.03
Real BlackRock Developed Real Estate Index Fund E 7/31/09 2.42 -4.38 -4.38 3.90 2.15 4.64 --
Assets FTSE EPRA/NAREIT Developed Index (Net) 2.34 -4.53 -4.53 3.23 1.52 4.10 3.41
Morningstar Category: Global Real Estate 2.44 -2.81 -2.81 8.06 2.85 4.54 3.32
BlackRock Commodity Index Daily Fund E 6/30/10 -0.66 -0.48 -0.48 3.29 -3.61 -8.67 --
Bloomberg Commodity Index -0.62 -0.40 -0.40 3.71 -3.21 -8.32 -7.71
Morningstar Category: Commodities Broad Basket 0.21 0.17 0.17 5.68 -2.23 -7.94 -8.41
Fixed
Income > SSgA U.S. Short-Term Government/Credit Bond Index Fund A
Bloomberg Barclays 1-3 Year US Government Credit Index
1/1/15 0.16
0.16
-0.24
-0.20
-0.24
-0.20
0.11
0.24
0.55
0.66
--
0.76
--
1.56
Morningstar Category: Short-Term Bond 0.09 -0.34 -0.34 0.73 1.07 1.00 2.18
BNY Mellon U.S. Aggregate Bond Index Fund Instl 3/25/09 0.64 -1.49 -1.49 1.07 1.06 1.69 --
Bloomberg Barclays U.S. Aggregate Bond Index 0.64 -1.46 -1.46 1.20 1.20 1.82 3.63
Morningstar Category: Intermediate-Term Bond 0.43 -1.31 -1.31 1.31 1.27 1.73 3.80
BlackRock Global Aggregate Bond Fund Ex-USD 1/1/15 1.01 0.92 0.92 3.20 2.37 -- --
Bloomberg Barclays Global Aggregate Bond ex-US Hedged Index 1.02 0.94 0.94 3.38 2.54 3.68 4.16
>
Morningstar Category: World Bond 0.75 1.13 1.13 5.85 2.80 1.43 3.05
Cash State Street U.S. Government Short Term Investment Fund 1/5/09 0.14 0.35 0.35 1.08 0.51 0.33 0.35
Equivalents
>
Citigroup 3 Month T-Bill Index 0.13 0.35 0.35 1.07 0.49 0.31 0.31
Real BlackRock U.S. TIPS Index Fund E 1/5/09 1.06 -0.78 -0.78 0.94 1.28 0.01 --
Assets Bloomberg Barclays U.S. Treasury Inflation Protected Securities (TIPS) Index 1.05 -0.79 -0.79 0.92 1.30 0.05 2.93
Morningstar Category: Inflation Protected Bond 0.82 -0.71 -0.71 0.77 1.03 -0.22 2.41
Past performance is no guarantee of future results. Investment return and principal value will fluctuate, and shares, when redeemed, may be worth more or less than original cost.
1Performance data is measured from the first full month following the date each strategy was added to the SIRT Funds, except for mutual funds and Schwab Bank Collective Trust
Funds. Schwab Bank Collective Trust Funds data reflects the first full month following the Fund's inception date.
Sub-advised strategy returns are net of sub-advisor management fees.
Source: Morningstar, Inc. See the Disclosures at the end of the document for important information.
For institutional use only
Charles Schwab 21SIRT Funds
Update
For institutional use only Charles Schwab 22Thought leadership and insights on the target date
industry.
Behavior-driven glide path Passive target date funds: Are there hidden fixed
design Separating myth from income risks in your TDF?
• Discusses improving reality • Provides three
investor outcomes • Reviews the many reasons to re-
through a active decisions that examine your fund’s
behaviorally driven go into passive fund fixed income
asset allocation design. exposure in today’s
approach in target http://www.schwabbankfunds market climate
date funds. .com/public/file/P- http://www.schwabbankf
http://www.schwabbankfund 11284257/Passive-target-
date-fund-
unds.com/public/file/P-
s.com/public/file/P- 11284265/Hidden_fees_
10456249/Behavior- myths.electronic.pdf
Driven_Glide_Path_Design.p
to_fixed_income.pdf
df
Click on each link for access to the white papers
For institutional use only Charles Schwab 23SIRT Funds Update
On January 16th, Charles Schwab Bank announced the release of the SIRT Funds 2018 policy allocations. There are no changes to
the funds’ intended glide path strategy, and each of the funds will continue to transition from equity to fixed income and cash
equivalents.
Charles Schwab Bank reviews the strategic asset allocation framework and capital market expectations on an annual basis, seeking
opportunities to further enhance the funds on a long-term basis for investors.
In 2018, the funds will make the following adjustments within the equity allocation of each portfolio: non-U.S. developed and
emerging markets equities will be increased through a like reduction in U.S. equities and commodities. The shift ranges from 0.5% in
the earlier dated funds to 5.5% in the later dated funds. All other strategic asset allocations positions and our planned annual
adjustments from equity into fixed income remain consistent with our long term strategic strategy.
For more information, please see the full policy allocation announcement on the Charles Schwab Bank website:
http://www.schwabbankfunds.com/public/file/P-11081353/FINAL-2018_Policy_Allocation_Announcement.pdf
For institutional use only Charles Schwab 24Appendix
Glide path capital market expectations
Custom index allocation
Schwab Bank Collective Trust Funds offering
For institutional use only Charles Schwab 25Capital market expectations
LONG TERM
FORECAST BASE CASE ASSUMPTIONS
ASSUMPTIONS
ASSET CLASS
Approx. Annual
Approx. Age Deferral Employer
standard salary
return range % match
deviation increase
Inflation 2-2.5% -- 25-35 4% 2% 4%
Cash Equivalents 1.5-2% 0-0.5% 36-45 5% 2.5% 4%
Short-Term Bond 2-2.5% 2-2.5% 46-55 6% 3% 3%
World Bond1 1-2% 3-3.5% 56-65 7% 3.5% 2%
Inflation-Protected Bond (US TIPS) 2-3% 5.5-7%
Intermediate-Term Bond 2.5-3% 3.5-4%
Commodities1 3.5-5% 17-20%
Domestic Equity (Large Cap) 5.5-7% 14-17%
Global Real Estate2 6-7% 18-22%
International Equity 6-9% 17-19%
Domestic Equity (Small Cap) 6-8% 19-22%
Diversified Emerging Markets 7.5-10% 22-25%
1The Schwab Target Index Funds do not hold World Bond or Commodities strategies. The Schwab Target Funds do not hold a Commodities strategy.
2Global Real Estate is used as a proxy for Real Estate within the Schwab Target Index Funds.
Expected returns are compounded annual returns. Actual returns may be higher or lower.
Employer match contribution is assumed to be 50% of employee deferral. Social Security and post-retirement income is not included in base case assumptions.
Assumptions are reviewed and revised at least annually.
Source: Charles Schwab Investment Management, Inc.
For institutional use only Charles Schwab 26SIRT Funds 2018 policy allocation by asset class
ASSET CLASS UNDERLYING INVESTMENT 2060 2055 2050 2045 2040 2035 2030 2025 2020 2015 2010
Equity 95.0 93.5 91.0 88.1 83.0 76.0 68.4 59.1 46.3 38.9 36.5
Domestic Equity BNY Mellon Large Cap Stock Index Fund Instl 49.8 49.3 48.4 47.4 45.5 42.6 39.3 34.8 28.1 24.6 23.4
Domestic Equity BNY Mellon Small Cap Stock Index Fund Instl 6.8 6.6 6.3 5.9 5.3 4.5 3.6 2.9 2.0 1.6 1.5
International Equity BNY Mellon Intl Stock Index Fund Instl 26.1 25.7 24.9 24.1 22.7 20.7 18.7 16.1 12.7 10.8 9.8
Emerging Markets SSgA Emerging Markets Index Fund A 6.3 6.1 5.6 5.2 4.4 3.5 2.6 1.7 0.7 0.0 0.0
Global Real Estate BlackRock Developed Real Estate Index Fund E 4.8 4.7 4.5 4.4 4.2 3.8 3.4 3.0 2.3 1.9 1.8
Commodities BlackRock Commodity Index Daily Fund E 1.2 1.2 1.2 1.1 1.1 1.0 0.8 0.7 0.5 0.0 0.0
Fixed Income 4.5 5.9 8.1 10.7 15.3 21.6 28.4 36.8 48.0 54.3 56.3
Short-Term Bond SSgA U.S. Short-Term Government/Credit Bond Index Fund A 0.5 0.7 0.9 1.3 1.9 2.8 3.9 5.5 7.8 9.3 9.8
Intermediate-Term Bond BNY Mellon U.S. Aggregate Bond Index Fund Instl 3.3 4.2 5.8 7.7 10.9 15.3 20.0 25.3 32.5 36.6 37.9
Inflation-Protected Bond (U.S. TIPS) BlackRock U.S. TIPS Index Fund E 0.0 0.0 0.0 0.0 0.0 0.0 0.0 1.4 4.2 6.1 6.3
World Bond BlackRock Global Aggregate Bond Fund Ex-USD 0.8 1.0 1.3 1.8 2.5 3.5 4.5 4.6 3.4 2.4 2.3
Cash Equivalents 0.5 0.7 0.9 1.2 1.7 2.4 3.2 4.2 5.7 6.7 7.2
Cash Equivalents State Street U.S. Government Short Term Investment Fund 0.5 0.7 0.9 1.2 1.7 2.4 3.2 4.2 5.7 6.7 7.2
Percentages may not total 100% due to rounding.
The above represent policy allocations for 2018, effective January 31, 2108; actual allocations may differ slightly from policy allocation at any point in time.
For institutional use only Charles Schwab 272018 custom index allocations
SIRT Funds
2060 2055 2050 2045 2040 2035 2030 2025 2020 2015 2010
2018 Custom Index Allocations
Russell 1000 Index 49.8 49.3 48.4 47.4 45.5 42.6 39.3 34.8 28.1 24.6 23.4
Russell 2000 Index 6.8 6.6 6.3 5.9 5.3 4.5 3.6 2.9 2.0 1.6 1.5
MSCI EAFE Index (Net) 26.1 25.7 24.9 24.1 22.7 20.7 18.7 16.1 12.7 10.8 9.8
MSCI Emerging Markets Index (Net) 6.3 6.1 5.6 5.2 4.4 3.5 2.6 1.7 0.7 0.0 0.0
FTSE EPRA/NAREIT Developed Index (Net) 4.8 4.7 4.5 4.4 4.2 3.8 3.4 3.0 2.3 1.9 1.8
Bloomberg Commodity Index 1.2 1.2 1.2 1.1 1.1 1.0 0.8 0.7 0.5 0.0 0.0
Bloomberg Barclays U.S. 1-3 Year Government/Credit Bond Index 0.5 0.7 0.9 1.3 1.9 2.8 3.9 5.5 7.8 9.3 9.8
Bloomberg Barclays U.S. Aggregate Bond Index 3.3 4.2 5.8 7.7 10.9 15.3 20.0 25.3 32.5 36.6 37.9
Bloomberg Barclays U.S. Treasury Inflation Protected Securities
0.0 0.0 0.0 0.0 0.0 0.0 0.0 1.4 4.2 6.1 6.3
(TIPS) Index
Bloomberg Barclays Global Aggregate Bond ex-U.S. Hedged Index 0.8 1.0 1.3 1.8 2.5 3.5 4.5 4.6 3.4 2.4 2.3
Citigroup 3 Month T-Bill Index 0.5 0.7 0.9 1.2 1.7 2.4 3.2 4.2 5.7 6.7 7.2
The above represent target policy allocations for 2018, effective January 31, 2018. Percentages listed may not total 100% due to rounding.
The custom index is a custom blended index developed by Charles Schwab Investment management, Inc. based on each fund’s asset allocation glide schedule and will become
more conservative as time elapses.
Source: Charles Schwab Investment Management, Inc.
For institutional use only Charles Schwab 28Schwab Bank Collective Trust Funds offering
Revenue Minimum Investment/
Funds Unit Class Expense
Credit Availability
I 0.89% 0.44%
II 0.69% 0.24%
No minimum
III 0.54% 0.09%
SMRT Fund Series IV 0.45% 0.00%
$100MM initial investment
V 0.35% 0.00%
or plan assets >$400MM
VI 0.33% 0.00% $1Billion
SIRT Fund Series I 0.08% 0.00% No minimum
Schwab Large Cap Value ITF Select 0.42% 0.00% No minimum
Retirement 0.74% 0.20%
Schwab Large Cap Growth ITF No minimum
Institutional 0.54% 0.00%
Retirement 1.04% 0.25%
Schwab Diversified International ITF No minimum
Institutional 0.79% 0.00%
I 0.55% 0.25%
Schwab Core Plus Fixed Income ITF No minimum
III 0.35% 0.05%
For institutional use only Charles Schwab 29Disclosures
Past performance is no guarantee of future results. Investment return and principal value will fluctuate, and shares, when redeemed, may be worth more or less than original
cost. Fund performance includes the reinvestment of all income and is presented net of all fees.
The values of the target fund will fluctuate up to and after the target date. There is no guarantee the funds will provide adequate income at or through retirement.
The material in this presentation is based on information from a variety of sources we consider reliable, but we do not represent that the information is accurate or complete. Errors
and omissions can occur. None of the information constitutes a recommendation or a solicitation of an offer to buy or sell any security by Schwab Bank or any of its affiliates.
Please review the trust and participation agreement, Schwab Bank Fund Fact Sheet and other disclosure materials before making any decision to invest in the Funds. Performance
data quoted is past performance and is no indication (or "guarantee") of future results. Current performance may be lower or higher. Investment return and principal value will
fluctuate, and shares, when redeemed, may be worth more or less than original cost.
©2018 by Morningstar, Inc. All rights reserved. The information contained herein is the proprietary information of Morningstar, Inc., and may not be copied or redistributed for any
purpose and may only be used for non-commercial, personal purposes. The information contained herein is not represented or warranted to be accurate, correct, complete or
timely. Morningstar, Inc. shall not be responsible for investment decisions, damages or other losses resulting from use of this information. Past performance is no guarantee of
future performance. Morningstar, Inc. has not granted consent for it to be considered or deemed an "expert" under the Securities Act of 1933.
Collective Trust Funds Disclosures
The Schwab Managed Retirement Trust Funds™, Schwab Indexed Retirement Trust Funds® and Schwab Institutional Trust Funds® are collective trust funds maintained by Charles
Schwab Bank (Schwab Bank), as trustee of the Funds. They are available for investment only by eligible retirement plans and entities. Schwab Bank Collective Trust Funds (Funds)
are not insured by FDIC or any other type of deposit insurance; are not deposits or other obligations of, and are not guaranteed by Schwab Bank or any of its affiliates; and involve
investment risks, including possible loss of principal invested. The Funds are not mutual funds and are exempt from registration and regulation under the Investment Company Act
of 1940 (the “1940 Act”), and their units are not registered under the Securities Act of 1933, or applicable securities laws of any state or other jurisdiction. Unit holders of the Funds
are not entitled to the protections of the 1940 Act. The decision to invest in the Funds should be carefully considered. The Funds’ unit values will fluctuate and may be worth more
or less when redeemed, so unit holders may lose money. The Funds are not sold by prospectus and are not available for investment by the public; Fund prices are not quoted in
newspapers.
Fund Affiliations
The Charles Schwab Corporation provides services to retirement and other employee benefit plans and participants through its separate but affiliated companies and subsidiaries:
Charles Schwab Bank (Schwab Bank); Charles Schwab & Co., Inc.; Charles Schwab Investment Management, Inc. (CSIM); and Schwab Retirement Plan Services, Inc. Trust and
custody products and service are offered by Schwab Bank. Brokerage products and services are offered by Charles Schwab & Co., Inc. (Member SIPC). Schwab Retirement Plan
Services, Inc. provides recordkeeping and related services to retirement plans. CSIM provides investment research, advisory and fund administration services to Schwab Bank and
the Funds. CSIM is an investment advisers registered with the Securities and Exchange Commission.
The Schwab Bank Collective Trust Funds select investments based on advice received from, or products offered by industry-recognized investment management firms ("sub-
advisors"). The Funds access investment strategies through various investment vehicles including, but not limited to, collective trust funds, mutual funds, and/or exchange-traded
funds and may also access strategies through sub-advisors engaged by Charles Schwab Bank to advise one or more separate accounts of a Fund. Exposure to some strategies may
be indirect through investment in other Schwab Bank Collective Trust Funds. The SMRT Funds invest in the Schwab Institutional Large Cap Value Trust Fund, Schwab Institutional
Large Cap Growth Trust Fund, Schwab Institutional Small Cap Fund, Schwab Institutional International Diversified Trust Fund, and Schwab Institutional Core Plus Fixed Income
Trust Fund.
Sub-Advised Strategies – Disclosures
Prior to April 2009, the BNY Mellon Large Cap Index Fund Insl invested in a securities-lending strategy. As of April 2009, the Fund changed to a non-lending strategy. Data reflects
performance of the non-lending strategy.
For institutional use only Charles Schwab 30Disclosures
Significant Risks of the Funds
Investment returns will fluctuate and are subject to market volatility, so that an investor’s shares, when redeemed or sold, may be worth more or less than their original cost.
Cash Equivalents Risk. Cash Equivalents investments are cash management strategies that seek to prevent the loss of an investment's total value. Although a cash management
product may seek to maintain a stable or constant net asset value, there can be no assurance it will do so.
Commodities Risk. Since a commodity fund is typically not diversified and focuses its investments in a single commodity or basket of commodities, the fund may involve a greater
degree of risk than an investment in other mutual funds with greater diversification.
Diversified Funds Risk. Diversification strategies do not ensure a profit and do not protect against losses in declining markets. Schwab Bank’s portfolio management process
includes an effort to monitor and manage risk, but should not be confused with and does not imply either low risk or the ability to control risk.
Fixed Income Risk. Fixed income securities are subject to increased loss of principal during periods of rising interest rates and to various other risks including changes in credit
quality, market valuations, liquidity, prepayments, early redemption, corporate events, and tax ramifications.
Inflation-Protected Security Risk. Treasury Inflation Protected Securities (TIPS) are inflation-linked securities issued by the U.S. Government whose principal value is adjusted
periodically in accordance with the rise and fall in the inflation rate. Thus, the dividend amount payable is also impacted by variations in the inflation rate as it is based upon the
principal value of the bond. It may fluctuate up or down. Repayment at maturity is guaranteed by the U.S. Government and may be adjusted for inflation to become the greater of
either the original face amount at issuance or that face amount plus an adjustment for inflation.
Interest Rate Risk. Interest rates will rise and fall over time. During periods when interest rates are low, an underlying strategy's yield and total return also may be low. Changes in
interest rates also may affect the strategy's share price: a sharp rise in interest rates could cause the strategy's share price to fall. The longer the strategy's duration, the more
sensitive to interest rate movements its share price is likely to be.
International Risk. International investments involve additional risks, which include differences in financial accounting standards, currency fluctuations, political instability, foreign
taxes and regulations, and the potential for illiquid markets. Investing in emerging markets may accentuate these risks.
Global Real Estate Risk. International investing does pose special risks including currency fluctuation, economic and political risks not found in investments that are solely
domestic. Risks of the REIT's are similar to those associated with direct ownership of real estate, such as changes in real estate values and property taxes, interest rates, cash flow
of underlying real estate assets, supply and demand, and the management skill and credit worthiness of the issuer.
Securities Lending Risk. Each Fund’s Declaration of Trust authorizes securities lending and the Funds may invest in underlying funds that participate in securities lending. There are
various risks associated with securities lending including but not limited to the risk that a borrower fails to return some or all of the securities in a timely manner and investments
acquired with cash collateral may decline in value. Charles Schwab Bank, in coordination with each Fund’s underlying investment sub-advisors, actively monitors any securities
lending activity to minimize any potential impact to the Funds.
Target Date Funds Risk. Diversification and asset allocation strategies do not ensure a profit and cannot protect against losses in a declining market. The Funds are subject to
market volatility and risks associated with the underlying investments. Risks include exposure to international and emerging markets, small company and sector equity securities,
and fixed income securities subject to changes in inflation, interest rates, market valuations, liquidity, prepayments, and early redemption. The funds are built for investors who
expect to start gradual withdrawals of fund assets on the target date, to begin covering expenses in retirement. The principal value of the funds is not guaranteed at any time, and
will continue to fluctuate up to and after the target date. There is no guarantee the funds will provide adequate income at or through retirement.
For institutional use only Charles Schwab 31Disclosures
Index Descriptions
Indexes are unmanaged, do not incur management expenses and cannot be invested in directly.
The Bloomberg Barclays 1-3 Year US Government Credit Index is a subset of US Government/Credit Index that is the non-securitized component of the US Aggregate Index. The
index includes US Treasuries, Government-Related issues (e.g., US agency, sovereign, supranational, and local authority debt), and USD Corporates with a remaining maturity of 1-
3 years.
The Bloomberg Barclays 1-5 Year U.S. Aggregate Bond Index is an unmanaged sub-index of securities with maturities of 1-5 years based on the Barclays Capital U.S. Aggregate
Bond Index. The Barclays Capital U.S. Aggregate Bond Index represents securities that are SEC registered, taxable, and dollar denominated. The index covers the U.S. investment
grade fixed rate bond market, with index components for government and corporate securities, mortgage pass-through securities, and asset backed securities.
The Bloomberg Barclays Global Aggregate Bond ex-US Hedged Index is a is a subset of the flagship Global Aggregate Index that measures multi-currency global investment grade
debt but excludes those denominated in USD. This multi-currency benchmark includes fixed-rate treasury, government-related, corporate and securitized bonds from both
developed and emerging markets issuers. The Global Aggregate ex USD Index is largely comprised of the regional Pan-European Aggregate and Asian-Pacific Aggregate Indices. In
addition to securities from these two benchmarks, the index also includes investment grade Euro-Yen and Canadian securities.
The Bloomberg Barclays U.S. Aggregate Bond Index represents securities that are SEC registered, taxable, and dollar denominated. The index covers the U.S. investment grade
fixed rate bond market, with index components for government and corporate securities, mortgage pass-through securities, and asset backed securities.
The Bloomberg Barclays U.S. Government/Credit Index is the non-securitized component of the U.S. Aggregate Index. includes Treasuries (i.e., public obligations of the U.S.
Treasury that have remaining maturities of more than one year), Government-Related issues (i.e., agency, sovereign, supranational, and local authority debt), and Corporates.
The Bloomberg Barclays U.S. Treasury Inflation-Protected Securities (TIPS) Index is a market value-weighted index that tracks inflation-protected securities issued by the U.S.
Treasury. To prevent the erosion of purchasing power, TIPS are indexed to the non-seasonally adjusted Consumer Price Index for All Urban Consumers, or the CPI-U (CPI).
The Bloomberg Commodity Index is calculated on an excess return basis and composed of futures contracts on 22 physical commodities. It reflects the return of underlying
commodity futures price movements.
The Citigroup U.S. 3-month Treasury Bill Index is an index that measures monthly total return equivalents of yield averages that are not marked to market. The Three-Month
Treasury Bill Index consists of the last three three-month Treasury bill issues.
The CRSP (Center for Research in Security Prices) US Mid Cap Index is an index that targets inclusion of the U.S. companies that fall between the top 70%-85% of investable
market capitalization.
The FTSE EPRA/NAREIT Developed Index (Net) is designed to track the performance of listed real estate companies and REITS worldwide. This series approximates the minimum
possible dividend reinvestment.
The MSCI All Country World (ACWI) ex USA Index (Net) is a free float-adjusted market capitalization index that is designed to measure equity market performance in the global
developed and emerging markets with the exclusion of the U.S.-based companies. This series approximates the minimum possible dividend reinvestment. The MSCI All Country
World (ACWI) ex USA Value Net Index and MSCI All Country World (ACWI) ex USA Growth Net Index are based on the MSCE All Country World (ACWI) ex USA Net Index.
The MSCI All Country World (ACWI) ex USA Small Cap Index (Net) is a free float-adjusted market capitalization index that is designed to measure equity market performance of
small capitalization global developed and emerging markets with the exclusion of the U.S.-based companies. This series approximates the minimum possible dividend
reinvestment. The MSCI All Country World (ACWI) ex USA Small Cap Growth Net Index is based on a traditional market cap weighted parent index, the MSCI World ex USA Small
Cap Index.
For institutional use only Charles Schwab 32Disclosures
Index Descriptions (continued)
The MSCI EAFE® (Europe, Australasia, Far East) Index (Net) is a free float-adjusted market capitalization index that is designed to measure developed market equity performance,
excluding the US & Canada. This series approximates the minimum possible dividend reinvestment.
The MSCI Emerging Markets Index (Net) is a free float-adjusted market capitalization index that is designed to measure emerging markets equity performance. This series
approximates the minimum possible dividend reinvestment.
The MSCI US Mid Cap 450 Index represents the universe of medium capitalization companies in the US equity market. This index targets for inclusion 450 companies and
represents, as of October 29, 2004, approximately 15% of the capitalization of the US equity market.
The MSCI World ex USA Small Cap Index (Net) captures small cap representation across 23 of 24 Developed Markets (DM) countries (excluding the United States). With 2,485
constituents, the index covers approximately 14% of the free float-adjusted market capitalization in each country. The MSCI World ex USA Small Cap Value Weighted Index is
based on a traditional market cap weighted parent index, the MSCI World ex USA Small Cap Index.
The Russell indices are market-capitalization weighted and subsets of the Russell 3000® Index, which contains the largest 3,000 companies incorporated in the United States and
represents approximately 98% of the investable U.S. equity market. The Russell 2000® Index is composed of the 2000 smallest companies in the Russell 3000 Index. The Russell
2000® Growth Index contains those Russell 2000 securities with a greater-than-average growth orientation. The Russell 2000® Value Index contains those Russell 2000 securities
with a less-than-average growth orientation. The Russell 1000® Index is composed of the 1000 largest companies in the Russell 3000® Index. The Russell 1000® Growth Index
contains those Russell 1000 securities with a greater-than-average growth orientation. The Russell 1000® Value Index contains those Russell 1000 securities with a less-than-
average growth orientation.
Definitions
Sharpe Ratio: Developed by Professor William F. Sharpe, a measure of reward per unit of risk - the higher the Sharpe Ratio, the higher return per unit of risk. It is a portfolio’s
excess return over the risk-free rate divided by the portfolio’s standard deviation. The portfolio’s excess return is its geometric mean return minus the geometric mean return of the
risk-free instrument (by default, t-bills).
Standard Deviation (%): A widely recognized measure of volatility of an investment portfolio, or how widely monthly returns vary from a portfolio’s long-term average annual total
return.
©2018 Charles Schwab Bank. All rights reserved. For institutional use only. (0418-8803) MKT91920-09
00210795
For institutional use only Charles Schwab 33Disclosures—Schwab Funds*
*Schwab Funds are the Schwab Target Funds and Schwab Target Index Funds, mutual funds maintained by Charles Schwab Investment Management, Inc.
Investors should consider carefully information contained in the prospectus, including investment objectives, risks, charges and
expenses. You can request a prospectus by visiting csimfunds.com. Please read the prospectus carefully before investing.
Target date index fund asset allocations are subject to change over time in accordance with each fund’s prospectus. The principal value of the funds is not guaranteed at any
time, and will continue to fluctuate up to and after the target date. There is no guarantee the funds will provide adequate income at or through retirement. The funds are built
for investors who expect to start gradual withdrawals of fund assets on the target date, to begin covering expenses in retirement.
The investment risks of the funds will change as asset allocations change. Investors should consider risk tolerance and personal financial conditions along with age and retirement
date when investing in the funds. Investment returns will fluctuate and are subject to market volatility, so that an investor’s shares, when redeemed or sold, may be worth more or
less than their original cost.
The funds are subject to market volatility and risks associated with the underlying investments. Risks include exposure to international and emerging markets, small company and
sector equity securities, and fixed income securities subject to changes in inflation, market valuations, liquidity, prepayments, and early redemption.
Charles Schwab Investment Management, Inc. (CSIM), the investment advisor for Schwab Funds, and Charles Schwab & Co., Inc. (Schwab), Member SIPC, the distributor for
Schwab Funds, are separate but affiliated companies and subsidiaries of The Charles Schwab Corporation.
This information is being furnished as educational and is not intended to constitute investment advice. This material is intended solely for institutional use. Readers are expected to
consult with their legal or financial advisors as applicable.
The material in this presentation is based on information from a variety of sources we consider reliable, but we do not represent that the information is accurate or complete. Errors
and omissions can occur. None of the information constitutes a recommendation by Charles Schwab Investment Management , Charles Schwab Bank, or their affiliates or a
solicitation of an offer to buy or sell any securities.
©2018 by Morningstar, Inc. All rights reserved. The information contained herein is the proprietary information of Morningstar, Inc., and may not be copied or redistributed for any
purpose and may only be used for non-commercial, personal purposes. The information contained herein is not represented or warranted to be accurate, correct, complete or
timely. Morningstar, Inc. shall not be responsible for investment decisions, damages or other losses resulting from use of this information. Past performance is no guarantee of
future performance. Morningstar, Inc. has not granted consent for it to be considered or deemed an "expert" under the Securities Act of 1933.
For institutional use only Charles Schwab 34You can also read