SHAREHOLDER & INVESTOR PRESENTATION - AUGUST 2020 - Investor Relations

Page created by Esther Mccoy
 
CONTINUE READING
SHAREHOLDER & INVESTOR PRESENTATION - AUGUST 2020 - Investor Relations
SHAREHOLDER & INVESTOR
PRESENTATION
AUGUST 2020
SHAREHOLDER & INVESTOR PRESENTATION - AUGUST 2020 - Investor Relations
Important Information
This presentation has been prepared by The Carlyle Group Inc. (together with its affiliates, “Carlyle”) and may only be used for informational purposes only. This presentation may not be referenced, quoted or linked by website, in whole or in part except
as agreed to in writing by Carlyle.
On January 1, 2020, we completed our conversion from a Delaware limited partnership named The Carlyle Group L.P. into a Delaware corporation named The Carlyle Group Inc. Unless the context suggests otherwise, references in this report to "Carlyle",
the "Company", "we", "us", and "our" refer (i) prior to the consummation of the conversion, to The Carlyle Group L.P. and its consolidated subsidiaries and (ii) from and after the consummation of the conversion, to The Carlyle Group Inc. and its
consolidated subsidiaries. References to our common stock in periods prior to the conversion refer to the common units of The Carlyle Group L.P. References to our dividends in periods prior to the conversion refer to the distributions of The Carlyle
Group L.P.
This presentation provides an overview of Carlyle and is not intended to be taken by, and should not be taken by, any individual recipient as investment advice, a recommendation to buy, hold or sell any security, or an offer to sell or a solicitation of
offers to purchase any security. An offer or solicitation for an investment in any investment fund managed or sponsored by Carlyle or its affiliates (“Fund”) will occur only through an offering memorandum and related purchase documentation, and
subject to the terms and conditions contained in such documents and in such Fund’s operative agreements. The offering memorandum relating to any Fund contains additional information about the investment objective, terms and conditions of such
Fund, tax information and risk disclosure that should be reviewed prior to making an investment decision regarding a Fund. This presentation is qualified in its entirety by such offering memorandum, which should be read completely before making any
investment. An investment in a Fund would be speculative and would involve significant risks. Nothing in this presentation is intended to be taken by, and should not be taken by, any individual recipient as investment advice, a recommendation to buy,
hold or sell any security, or an offer to sell or a solicitation of offers to purchase any security.
Although the information presented in this presentation has been obtained from sources that Carlyle believes to be reliable, Carlyle makes no representations as to its accuracy, validity, timeliness or completeness for any purpose. The information set
forth herein does not purport to be complete and Carlyle is not responsible for errors and/or omissions with respect to the information contained herein. Unless otherwise expressly stated herein any analysis or outlook relating to the matters discussed
herein express Carlyle’s views only as of August 10, 2020.
Statements contained in this presentation that are not historical facts are based on current expectations, estimates, projections, opinions and/or beliefs of Carlyle. Such statements involve known and unknown risks, uncertainties and other factors, and
undue reliance should not be placed thereon. Certain information contained in this presentation constitutes “forward-looking statements,” which can be identified by the use of forward-looking terminology such as “may,” “will,” “should,” “seek,” “expect,”
“anticipate,” “forecast,” “project,” “estimate,” “intend,” “continue,” “target,” or “believe” or the negatives thereof or other variations thereon or comparable terminology. These statements are subject to risks, uncertainties and assumptions, including those
described under the section entitled “Risk Factors” in our Annual Report on Form 10‐K for the year ended 12/31/2019 filed with the SEC on February 12, 2020, as such factors may be updated from time to time in our periodic filings with the SEC, which are
accessible on the SEC’s website at www.sec.gov. These factors should not be construed as exhaustive and should be read in conjunction with the other cautionary statements that are included in this release and in our filings with the SEC. We undertake
no obligation to publicly update or review any forward‐looking statements, whether as a result of new information, future developments or otherwise, except as required by applicable law.
The fund return information reflected in this presentation is not indicative of the performance of The Carlyle Group Inc. and is also not necessarily indicative of the future performance of any particular fund. There can be no assurance that any of Carlyle’s
funds or its other existing and future funds will achieve similar returns. See “Risk Factors — Risks Related to Our Business Operations — The historical returns attributable to our funds, including those presented in this report, should not be considered as
indicative of the future results of our funds or of our future results or of any returns expected on an investment in our common units” in the Annual Report. As used throughout this document, and unless otherwise indicated, “Gross IRR” represents the
annualized internal rate of return for the period indicated on limited partner invested capital based on contributions, distributions and unrealized value before management fees, expenses and carried interest, which will reduce returns and, in the
aggregate are substantial. “Net IRR” represents the annualized internal rate of return for the period indicated on limited partner invested capital based on contributions, distributions and unrealized value after management fees, expenses and carried
interest (but not taxes borne by investors). “Gross MOIC” represents total fair value, before management fees, expenses and carried interest, divided by cumulative invested capital. An investment is considered realized when the investment fund has
completely exited, and ceases to own an interest in, the investment. An investment is considered partially realized when the total proceeds received in respect of such investment, including dividends, interest or other distributions and/or return of capital
represents at least 85% of invested capital and such investment is not yet fully realized. In considering investment performance information contained in this presentation, prospective investors should bear in mind that past performance is not necessarily
indicative of future results and there can be no assurance that Carlyle or any Fund will achieve comparable results. Actual realized value of currently unrealized investments will depend on, among other factors, future operating results, the value of the
assets and market conditions at the time of disposition, any related transaction costs and the timing and manner of sale, all of which may differ from the assumptions and circumstances on which the current unrealized valuations are based. Accordingly,
the actual realized values of unrealized investments may differ materially from the values indicated herein. Unless otherwise specified, LTM, or last twelve months refers to the period of Q3 2019 through Q2 2020, and the prior rolling 12-month period
refers to the period Q3 2018 to Q2 2019.
This presentation includes comparisons of certain private equity indices to various indexes including certain MSCI indexes (MSCI) and the S&P 500 and other indexes. The private equity indices do not represent the performance of any Fund or family of
Funds. Recipients should not infer that any Fund is top quartile. There are significant differences between the types of securities and assets typically acquired by U.S. and global buyout funds, the investments covered by the MSCI, S&P 500 and other
indexes. Specifically, U,S. and global buyout funds typically make investments in securities and other assets that have a greater degree of risk and volatility, and less liquidity, than those securities included in these indexes and companies included in the
indexes are not subject to certain of the management fees, carried interest or expenses to which investors in U.S. and global buyout funds are typically subject. Comparisons between private equity funds, Carlyle sponsored funds, the MSCI, S&P 500 and
other indexes are included for informational purposes only. The private equity returns do not represent the performance of any Fund or family of Funds. Recipients should not infer that any Fund is top quartile.
Detailed information about Carlyle’s management fees and performance revenues is available in Carlyle’s public filings. Please note that certain metrics and projections contained in this Presentation include the Legacy Energy Funds and funds advised
by NGP Energy Capital Management. Please note that the Legacy Energy Funds (as defined in Carlyle’s public filings), are managed with Riverstone Holdings LLC and its affiliates. Affiliates of both Carlyle and Riverstone act as investment advisers to each
of the Legacy Energy Funds. Currently, Carlyle is only entitled to carried interest and management fees in certain funds advised by NGP Energy Capital Management. The NGP Energy Capital Management funds which solely earn management fees are
referred to herein as “NGP predecessor funds.”
For purposes of the non-financial operating and statistical data included in this presentation, including the aggregation of our non-U.S. dollar denominated investment funds, foreign currencies have been converted to U.S. dollars at the spot rate as of
the last trading day of the reporting period when presenting period end balances, and the average rate for the period has been utilized when presenting activity during such period. With respect to capital commitments raised in foreign currencies, the
conversion to U.S. dollars is based on the exchange rate as of the date of closing of such capital commitment.
This presentation includes certain Non-GAAP financial measures, Distributable Earnings (“DE”) and Distributable EBITDA. These Non-GAAP financial measures should be considered only as supplemental to, and not as superior to, financial measures
prepared in accordance with GAAP. Please refer to the Appendix of this presentation for a reconciliation of the non-GAAP financial measures included in this presentation to the most directly comparable financial measured prepared in accordance with
GAAP. Please see Carlyle’s public filings for the definition of “carry funds,” “Fee-earning assets under management” or “Fee-earning AUM,” (FEAUM), and “Assets under management” or “AUM.”

                                                                                                                                                                                                                                                                 2
SHAREHOLDER & INVESTOR PRESENTATION - AUGUST 2020 - Investor Relations
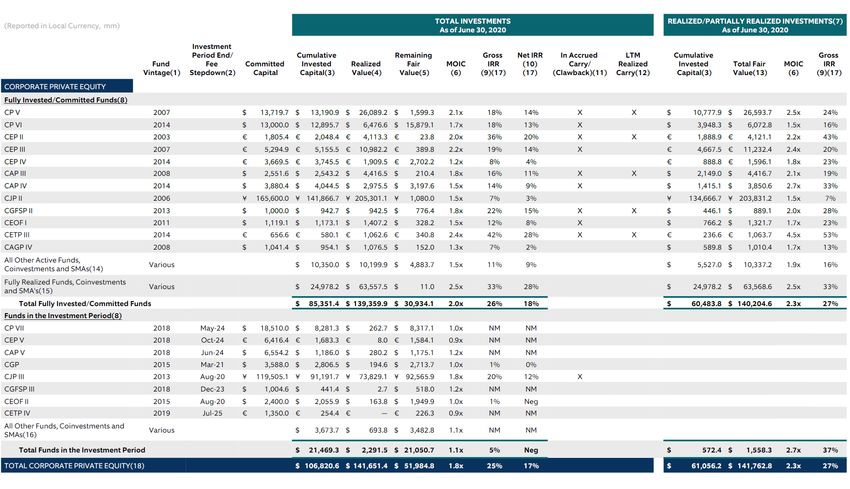
CARLYLE IS A LEADING GLOBAL
     INVESTMENT FIRM
SHAREHOLDER & INVESTOR PRESENTATION - AUGUST 2020 - Investor Relations
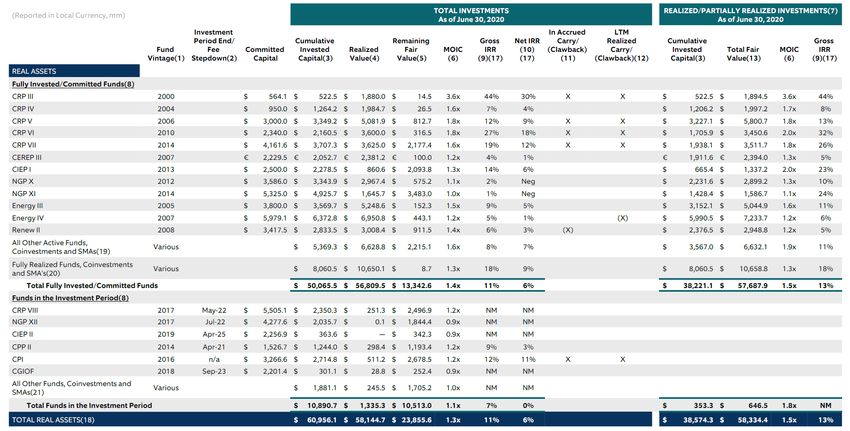
The Carlyle Group Overview

•      The Carlyle Group was founded in 1987 in Washington DC
     Today we have more than 1,800 employees across 31 offices on 6 continents

•      Carlyle is a global leader in private capital investment management, one of the fastest growth
       areas of financial services

•      Carlyle manages $221 billion in Assets Under Management across four main segments on
       behalf of our fund investors
     Durable Fee-earning AUM of $162 billion is up 40% from 3 years ago
     $73 billion of available capital across all segments and geographies

•      Carlyle has generated $373 million in Distributable Earnings in 2020, or $1.01 per common
       share after tax
     We generated $256 million in Fee Related Earnings year to date, accounting for 69% of Distributable Earnings

•      Completed our conversion to a Corporation as of January 1, 2020.
     Carlyle’s new corporate structure has a single share class with one share/one vote governance
     $1.00 fixed annual dividend

Note: Data as of June 30, 2020.                                                                                      4
SHAREHOLDER & INVESTOR PRESENTATION - AUGUST 2020 - Investor Relations
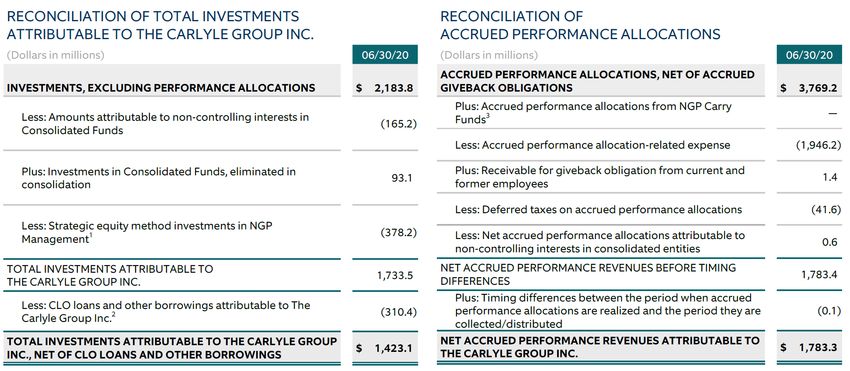
Carlyle Is A Global Leader In Private Capital Investing
                                                                   Carlyle is diversified across sectors with
                                                                          industry leading positions

      Investment Solutions                                                                                                                                        Corporate Private Equity

   Private Equity and                                                       $47                                                                                   Buyout
   Real Estate                                                                                                                                                    Long dated P/E
    - Funds                                                                                  Total AUM:                                                           Middle Market and
    - Secondaries
    - Co-investments
                                                                                             $221 billion                                             $84           Growth Capital

              Global Credit                                                                  Available Capital:
                                                               $50                              $73 billion
   Structured Credit
   Direct Lending                                                                                                                                                       Real Assets1
   Distressed Credit
                                                                                                                                                                  Real Estate
   Opportunistic Credit                                                                                           $40                                             Natural Resources
   Carlyle Aviation Partners
   Insurance
Note: Data as of June 30, 2020. See The Carlyle Group Inc.’s filings with the U.S. Securities and Exchange Commission for more information on fund performance.
1) Includes three Legacy Energy funds jointly advised with Riverstone Holdings, L.L.C. and eight funds advised by NGP Energy Capital Management.                                             5
SHAREHOLDER & INVESTOR PRESENTATION - AUGUST 2020 - Investor Relations
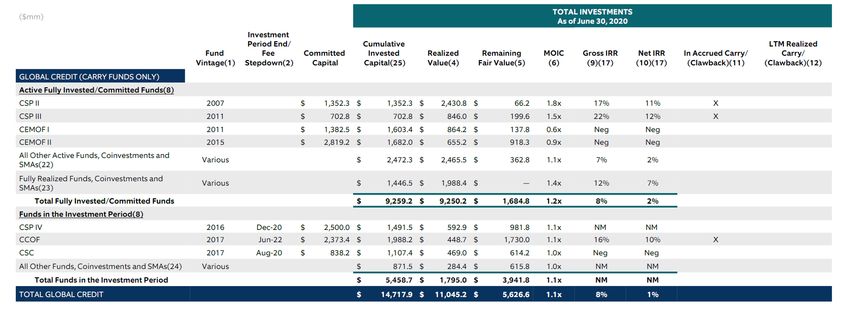
Carlyle Entered 2020 With Good Momentum And in a Position of Strength

   Focused on Growing                                                               $453 million in 2019, more than double
   Fee Related Earnings                                                             2017 (margin up to 28% from 17% in 2017)

   Fee-earning AUM                                                                  98% of FEAUM in long term, locked up
   Sticky & Long Term                                                               fee structures

  Substantial Dry Powder
  To Address Opportunity                                                            $73 billion of available capital

    Well Positioned For Future                                                      $1.8 billion in net accrued carry as of
    Performance Revenue                                                             Q2 2020

   Global Credit Business                                                           $50 billion of Global Credit AUM
   Well Positioned                                                                  (+17% CAGR over past 3 years)

Note: Data as of June 30, 2020. There is no guarantee these trends will continue.                                              6
Fee-earning AUM Has Accelerated Over Time With Significant Fundraising Success

FEE-EARNING AUM ($BN)                                                                                              •       Fee-earning AUM of $162 billion across
                                                                                                                           Corporate Private Equity, Real Assets,
   $200                            Core FEAUM CAGR: 10%                                                                    Global Credit & Investment Solutions
                                       Total FEAUM CAGR: 4%
    $175
                                                                          $160      $161     $162                  •       Strong Core Fee-earning AUM1 CAGR of
    $150
                                                                                                                           10% since 2012
                          $140                                                     $153      $156
                                    $136                                  $149
                                             $131
    $125
                 $123                                           $125
                                                                                                                   •       98% of Fee-earning AUM in locked up,
                                                       $115
                                                                                                                           long term fund structures not subject to
    $100                                                         $111
                                                                                                                           quarterly redemption
                                             $101      $99
                           $96      $95
     $75         $79                                                                                               •       LTM Total Fee Revenue of $1.6 billion up
                                                                                                                           47% compared to 3 years ago
     $50

                                                                                                                   •       $8.5 billion in Pending Fee-earning AUM
     $25
                                                                                                                           will activate fees upon fund initiation or
       $0                                                                                                                  capital deployment2
                                                                                             2Q20
                2012

                          2013

                                   2014

                                             2015

                                                       2016

                                                                2017

                                                                          2018

                                                                                   2019

                                       Core                         Legacy

Note: Data as of June 30, 2020. There is no guarantee these trends will continue.
1) Core excludes Legacy FEAUM which consists of Hedge Funds, Legacy Energy, and Legacy APG / PGGM FEAUM.
2) Pending Fee-earning AUM of $8.5 billion as of June 30, 2020 includes approximately $2.3 billion in fund commitments that will activate as new funds turn on fees. The remaining amount will generally become
   fee-earning as the commitments are invested.                                                                                                                                                                   7
Strong Recent Growth Trajectory In Fee Related Earnings and Margins;
Expect Upward Trend to Continue Longer Term

Fee Related Earnings growth                                                                       FRE & MARGIN TRENDS1
accelerated over the last few                                                                                                                                                           $440-475
                                                                                                                                  $500                                                                           35%
years                                                                                                                                                                    $453
                                                                                                                                  $450
                                                                                                                                                                                                                 30%
                                                                                                                                  $400
We are confident in our ability to

                                                                                                     Fee Related Earnings ($mm)
                                                                                                                                                    $350                                                         25%
                                                                                                                                  $350
grow Fee Related Earnings over

                                                                                                                                                                                                                      FRE Margin (%)
                                                                                                                                  $300
the long term through:                                                                                                                                                                                           20%
                                                                                                                                  $250
   • Scaling of existing businesses                                                                                                                                                                              15%
                                                                                                                                  $200   $192
   • Pursuing opportunistic growth
                                                                                                                                  $150              $318
                                                                                                                                                                                                                 10%
   • Carefully managing expenses
                                                                                                                                  $100
                                                                                                                                                                                                                 5%
                                                                                                                                   $50   $124

   We expect to generate FRE in a                                                                                                   $0                                                                           0%
   range of $440-475 million for                                                                                                         2017        2018                2019           2020 Target

   2020                                                                                                                                                  Insurance recoveries
                                                                                                                                                         FRE (ex recoveries)
                                                                                                                                                         FRE Margin

Note: Data as of June 30, 2020. Reflects management’s views as of August 10, 2020. Please see “Important Information” slides for information about the use of and reliance on projections.
1) 2017 Fee Related Earnings were $192 million, and $124 million net of $68 million in net insurance recoveries. 2018 Fee Related Earnings were $350 million, and $318 million net of $32 million in insurance
   recoveries. FRE Margins are based on Fee Related Earnings excluding the impact of insurance recoveries.                                                                                                                        8
Significant Fair Value & Accrued Carry Recovery in Q2 2020
 Our Carry Fund portfolio rebounded sharply in Q2 2020 with portfolio valuation recovering significantly from Q1
  2020 in many areas (CPE up 13% and Global Credit up 8% QoQ)
 As a result, the Net Accrued Performance Revenue balance increased nearly 50% to $1.8 billion from $1.2 billion
  in the prior quarter
 Fair value of investments in traditional carry funds of $81 billion well above long-term average
 We expect realization activity to remain muted in the near term, but our portfolio is well constructed and we
  remain confident in our ability generate significant Net Realized Performance Revenue over time
 Insignificant net accrued clawback at June 30, 2020 of $8 million

      NET ACCRUED PERFORMANCE REVENUE                                                                                          FAIR VALUE OF INVESTMENTS ($BN)
      ($BN)

                                                       $1.72                 $1.78
                                $1.68                                                                                   Credit & Other
          $1.48                                                                                                        (Non-Carry Fund)
                                                                                                                                                $38

                                                                                                                                                           $148bn                  $81
                                                                                                                                                                                               Traditional
                                                                                                                                                                                                 Carry
                                                                                                                                                                                                 Funds
                                                                                                                                  Inv
                                                                                                                               Solutions
                                                                                                                                                  $29
                                                                                                                                Carry
                                                                                                                                Funds

     2012 - 2017                 2018                  2019                  2Q20
        (Avg)
Note: Data as of June 30, 2020. Reflects management’s views as of August 10, 2020. Please see “Important Information” slides for information about the use of and reliance on projections. There is no guarantee
these trends will continue.                                                                                                                                                                                        9
Significant Opportunity in Global Credit

 Growing our Global Credit platform remains                                                                                                GLOBAL CREDIT
                                                                                                                                           TOTAL AUM ($BN)
 a key strategic focus for the firm
                                                                                                                                                                 +17%                          $50
                                                                                                                                                                 CAGR
 Total AUM has grown at an 17% CAGR over
 the past 3 years                                                                                                                                            $31

 Global Credit Fee Related Earnings have
 expanded to almost $70 million over the LTM                                                                                                          3 Years Ago                          Q2 2020

                                                                                                                                           GLOBAL CREDIT
 Launched or acquired new strategies which
                                                                                                                                           FEE RELATED EARNINGS1 ($MM)
 are performing well:
 •        Opportunistic Credit                                                                                                                                                                       $68

 •        Carlyle Aviation Partners                                                                                                                                                     $48
                                                                                                                                                                      $40

 Current environment presents tactical
 deployment and fundraising opportunity                                                                                                            $14

                                                                                                                                                  2017                2018              2019         LTM
Note: Data as of June 30, 2020. There is no guarantee these trends will continue.
1)    2017 and 2018 Fee Related Earnings for Global Credit exclude the positive impact of $68 million and $32 million of non-recurring insurance recoveries in the respective period.                      10
Fortitude Platform Enables Strategic Growth Opportunities

Fortitude is a leading Bermuda-based run-                                                                                         Broad Income Generation Capacity
off reinsurer with more than $43 billion in
                                                                                                                                                               Earn recurring management
total assets                                                                                                                                                   fees on equity raised for
                                                                                                                                                               Fortitude transaction and assets
                                                                                                                         Fee Revenue                           rotated into Carlyle funds and
Carlyle and our partners now own                                                                                                                               vehicles from Fortitude, as well
approximately 97% of Fortitude                                                                                                                                 as transaction and capital
                                                                                                                                                               markets fees

Our investment in Fortitude helps us extend                                                                                                                    Earn investment income over
our investment capabilities into the                                                                                      Investment                           time from dividends from
                                                                                                                                                               Fortitude, realized when
insurance sector                                                                                                            Income                             distributed from Fortitude to
                                                                                                                                                               its investors
Fortitude is a source of long-term capital for
Carlyle products
                                                                                                                                                               Earn performance fees on
                                                                                                                                                               assets invested into Carlyle
                                                                                                                         Performance
We believe Fortitude is well-positioned to                                                                                 Revenue
                                                                                                                                                               funds and vehicles which have
                                                                                                                                                               the capacity for performance
grow through the acquisition of additional                                                                                                                     fee generation
run-off blocks of insurance

Note: For illustrative purposes only. Information about Fortitude Re provided by the company. Carlyle and our partners completed the acquisition of 76.6% of Fortitude Re from AIG on June 2, 2020.   11
Breadth Of Fundraising Resources And Capabilities Drive Capability To Raise
Capital Across Various Market Environments

• Team of more than 100 Investor Relations employees across all regions
• More than 2,600 fund investors from 94 countries
• More than 380 new fund investors over the past 3 years have committed approximately $8.4
  billion
• 76% of fund investor capital is invested across six or more carry funds, up from 50% in 2006

                                                                                                                  CROSS SELLING ACROSS FUNDS1
DIVERSE SOURCE OF CAPITAL COMMITMENTS                                                                             % OF $ COMMITMENTS ACROSS MULTIPLE FUNDS

                          Banks Other
                                 4%                                                                                          > 20 funds               6%
                 Insurance 3%
                     6%                                                                                                                              16%
        Corporations                                                                                                      11 – 20 funds
            1%                                                            Public Pensions                                                                                             42%
                                                                            & Agencies
     Fund of Funds                                                              47%
          6%                                                                                                                6 – 10 funds             28%

                                                                                                                                                                                      16%
        High Net
         Worth
          13%
                                                                                                                             2 – 5 funds                                              18%
                                                                                                                                                     41%
      Endowments
           2%                                                                                                                                                                         18%
   Corporate Pensions
          4%                                                                                                                 1 fund                   9%                              6%
                                Sovereign
                               Wealth Funds
                                                                                                                                                     2006                       6/30/2020
                                   12%
Note: Data as of June 30, 2020.
Number of fund investors for prior years is shown as of September 30th of each year.
1) Percentage of capital committed by investors to active carry funds, segmented by the number of active carry funds in which the investors were committed as of 12/31/2006 and 6/30/2020.   12
Carlyle Presents An Attractive Investment Opportunity
       Platform Growth &                                                                                Value1                                                               Technical Improvement
         Diversification

FEE RELATED EARNINGS
|($MM)                                                                           PRICE TO 2021E                                                                        •      Carlyle converted to a
                                                                                                                                                                              Full C-Corp effective
                                $453                                            20.6x 19.0x
                 $350
                                                                                            18.1x 18.0x 18.0x                                                                 January 1, 2020
                                                                                                                                   13.2x
                                            $256
    $192                                                                                                                                                               •      $1 per share fixed
                                                                                                                                                                              dividend (3.6% current
                                                                                                                                                                              yield)
   2017          2018         2019          YTD                                  S&P Peer 1 Peer Peer Peer CG
                                                                                 500         2    3    4                                                               •      One share / one vote
                                                                                                                                                                              governance structure
% OF DISTRIBUTABLE                                                               Dividend Yield
EARNINGS FROM FRE                                                                (NTM)                                                                                 •      CG dollar volume trading
                                                                                      Fixed                      Variable                                                     liquidity up 330%+ YTD
                               70%           69%                                     Dividend                    Dividend                                                     2020 vs 2019 driving
                 52%                                                          4.3% 3.7%                        4.4% 4.1%                                                      more efficient ownership
                                                                                               1.6%                                      1.9%
    29%
                                                                                                                                                                       •      YTD trading volume/day
                                                                                                                                                                              of 2.5 mm shares/day, or
                                                                                        CG

                                                                                               Peer 2

                                                                                                                Peer 3

                                                                                                                         Peer 4
                                                                               Peer 1

                                                                                                                                         S&P 500

                                                                                                                                                                              $68 mm/day)
  2017          2018          2019          YTD

Note: As of June 30, 2020. Valuation and trading data as of August 9, 2020. Source: Factset. Presented for illustrative purposes only. Please see “Important Information” slides for information about the use of and
reliance on projections.
1) Peers include Apollo, ARES, Blackstone, KKR..                                                                                                                                                                        13
We Are A Well Positioned Global Leader In Private Capital Investment

• Carlyle is a global leader in the growing private capital industry

• We are committed to delivering strong results for all of our stakeholders
  (including fund investors, shareholders, employees and our communities)

• Well positioned to manage through the impact of COVID-19 on our portfolio
  and to invest in new opportunities as they emerge

• Fee Related Earnings have strengthened over the past few years and provides
  significant support to Distributable Earnings

• Currently have $1.8 billion of accrued performance revenues underpinning
  significant future net realized performance revenue growth

• Attractive dividend yield and relative earnings valuation

Note: Reflects management views as of August 10, 2020. Information provided as of June 30, 2020.   14
SEGMENT SUMMARIES
Corporate Private Equity: Scaled Market Leader With Superior Long Term
   Performance
  TOTAL AUM ($BN)                                              FEE-EARNING AUM ($BN)
                                                                                                                                                                Key Points
                         $81       $86        $84
               $73                                                                   $62        $62        $57
    $51
                                                                                                                                Superior, diversified track record
                                                                $36        $36
                                                                                                                                          • 2.3x MOIC on realized and partially realized
                                                                                                                                            investments

   2016        2017      2018     2019        Q2                2016       2017      2018      2019        Q2                             • Experience across multiple deployment and
                                             2020                                                         2020                              exit cycles
                      Japan Buyout                                                   Japan Buyout
                                                                                                                                Recent successor funds significantly
                          $3.7                                Financial Services
Financial Services                                                                   $0.6
                                                                    $1.6
      $2.2                     Other                                                      Other
                                CPE¹
                                $5.6
                                                         Global Partners
                                                              $2.6
                                                                                          CPE¹                                   scaled CPE platform
 US Growth                                                                                $4.5
    $3.0                                                     US Growth                                                                    • US/Asia/Europe buyout fundraising scaled
                                            US Buyout           $2.2                                     US Buyout
     Global            Asia     $84b          $40.3                             Asia
                                                                               Buyout
                                                                                            $57b           $26.1                            latest funds by more than 50%
    Partners
      $6.0
                      Buyout
                                                                                $9.5                                                      • $32 bn of Available Capital
                       $11.4
                           Europe Buyout                                             Europe Buyout
                                                                                         $10.2
                                                                                                                                          • Deployment of $4.2 bn LTM
                               $12.0

                                                                                                                                Positioned to deliver future
                                       Financial Metrics ($mm)                                                                   performance fees
                                             2017         2018             2019            YTD Q2 2020
                                                                                                                                          • $52 bn Remaining Fair Value
     Fee Related Earnings                     $26          $124            $261                   $146
                                                                                                                                          • Successful recent IPO activity
     Net Realized
                                              459           221             67                      52                                    • $1.4 bn of Net Accrued Performance
     Performance Revenues
                                                                                                                                            Revenue
     Distributable Earnings                   488           350            297                     203

   Note: Data as of June 30, 2020. See The Carlyle Group Inc.’s filings with the U.S. Securities and Exchange Commission for more information on fund performance.
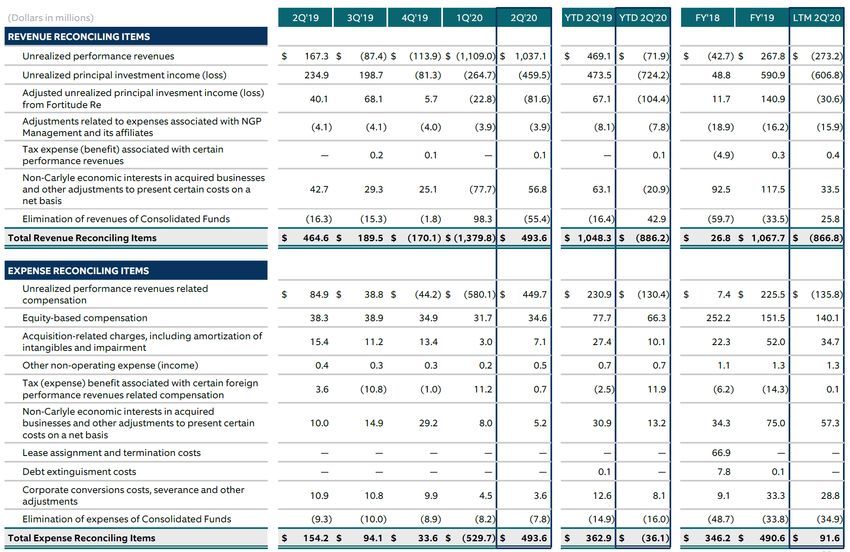
   1) Comprised of South America Buyout, Europe Growth, Asia Growth, Sub-Saharan Africa Buyout, CPE Platform Accounts, Peru Buyout, Ireland Buyout and MENA Buyout.                        16
Carlyle’s Private Equity Funds Have Historically Performed Well Through Volatile
   Periods

                                                                                                           Total Investments                                       Realized/Partially Realized

                                                                      Investing
      Fund                                                              Period                           MOIC                      Gross IRR                           MOIC                            Gross IRR
      Carlyle Partners IV                                          2004 – 2007                             2.4X                         16%                              2.4X                               16%

      Carlyle Partners V                                           2007 – 2013                             2.1X                         18%                              2.5X                               24%

      Carlyle Partners VI                                          2014 – 2018                             1.7X                         18%                              1.5X                               16%

      Carlyle Europe Partners II                                   2003 – 2007                             2.0X                         36%                              2.2X                               43%

      Carlyle Europe Partners III                                  2007 – 2013                             2.2X                         19%                              2.4X                               20%

      Carlyle Europe Partners IV                                   2014 – 2018                             1.2X                           8%                             1.8X                               23%

      Carlyle Asia Partners II                                     2006 – 2008                             1.9X                         11%                              1.9X                               11%

      Carlyle Asia Partners III                                    2008 – 2013                             1.8X                         16%                              2.1X                               19%

      Carlyle Asia Partners IV                                     2014 – 2018                             1.5X                         14%                              2.7X                               33%

Note: Data as of June 30, 2020. Past performance is not indicative of future results and there is no guarantee these trends will continue.
Investment period begins at fund inception date. Total Investments represents both realized as well as unrealized fund investments, while Realized/Partially Realized only represents fully realized investments or
investments when total proceeds received represent at least 85% of invested capital and such investment is not fully realized. MOIC is multiple of invested capital. See “Important Information” for more information on
the calculation of gross IRRs, gross MOIC, and realized and partially realized investments. See The Carlyle Group Inc.’s filings with the U.S. Securities and Exchange Commission for more information on the
performance of the firm’s significant funds.                                                                                                                                                                               17
Global Credit: Well Positioned To Take Advantage of Market Dislocations Across
Our Diversified Global Credit Platform
TOTAL AUM ($BN)                                                FEE-EARNING AUM ($BN)
                                                                                                                                                          Key Points
                                  $49        $50                                                   $38        $42
                       $44                                                              $35
$29         $33                                                   $24       $27                                                     Focused on enhancing and scaling
                                                                                                                                     Global Credit platform
                                                                                                                                            • Private credit accelerating as an asset class
2016       2017       2018       2019        Q2                 2016       2017        2018        2019       Q2
                                            2020                                                             2020                           • New credit teams capable of managing
                                                                                                                                              higher AUM with limited new investment
                Insurance $2.4                                                    Insurance $2.1                                            • Growth via organic/inorganic means to
                  Direct         Carry                                         Direct
                                                                                                                                              address significant white space
                                                                                              Carry
                Lending          Funds                                        Lending         Funds
                  $5.0
                                                                                                                                    Solid core platform
                                 $10.0                                          $3.5           $7.0
           Aviation                                                     Aviation
            $5.9
                       $50b                                              $4.9
                                                                                     $42b                                                   • Leading US/Europe CLO business

                             CLOs
                                                                                                                                            • $10 bn carry fund platform across Aviation,
                                                                                           CLOs
                             $26.7                                                         $24.4                                              Opportunistic Credit, Distressed, Structured
                                                                                                                                              Credit and Energy Mezzanine
                                                                                                                                            • Growing Direct Lending platform with $5.0 bn
                                      Financial Metrics ($mm)                                                                                 of AUM

                                            2017           2018           2019                YTD Q2 2020
                                                                                                                                    Well positioned to invest into
 Fee Related Earnings1                       $82            $72             $48                       $43
                                                                                                                                     dislocated investment opportunities
 Net Realized
 Performance Revenues
                                              40              5               1                        14                            across broad based platform inclusive
 Distributable Earnings1                      127            78              48                       60                             of large SMA capabilities

Note: Data as of June 30, 2020.
1) 2017 and 2018 include net (charges)/recoveries of $68 million and $32 million, respectively, associated with our commodities business.                                                     18
Real Assets: High Performing Real Estate Platform & Global Scale in Natural
Resources
TOTAL AUM ($BN)                                             FEE-EARNING AUM ($BN)
                                                                                                                                              Key Points
            $43        $46         $43                                            $33       $33
                                              $40                       $32                                $32
$34                                                           $28
                                                                                                                             US Real Estate business delivering
                                                                                                                              strong performance
2016       2017        2018        2019     Q2               2016      2017       2018      2019           Q2
                                                                                                                                 • Strong performance and substantial scaling
                                           2020                                                           2020                     in opportunistic funds
                                                                                                                                 • Focus on demographic driven sectors
            Legacy Energy                                               Legacy Energy
                $1.6                                                        $1.5
                                                                                                                                   reduces market volatility
 Infrastructure
                                                           Infrastructure
      $4.3
                                                                $4.0
                                                                                                                                 • Core Plus market an attractive opportunity
                                                                                          US Real
                                    US Real                                                Estate
                                                                                                                                   to leverage USRE expertise
                                     Estate                                                 $9.8
         NGP Energy    $40b          $15.9
                                                                               $32b
           $9.6
                                                                    NGP Energy
                                                                      $9.8                                                   Natural Resources carefully deploying
                    Int'l Energy
                                                                                                                              capital in challenging environment
                                                                                    Int'l Energy        Int'l Real Estate
                         $6.4                                                            $4.6                  $1.9
                                      Int'l Real Estate
                                             $2.4                                                                                • Invested Capital of $3.1 bn LTM

                                      Financial Metrics ($mm)
                                           2017           2018        2019              YTD Q2 2020
 Fee Related Earnings                         $52         $121         $127                    $47
 Net Realized
                                              50           84            90                        48
 Performance Revenues
 Distributable Earnings                       25          207           283                        88

Note: Data as of June 30, 2020..                                                                                                                                                19
Investment Solutions: Consistently Strong Investment Performance
TOTAL AUM ($BN)                                                FEE-EARNING AUM ($BN)
                                                                                                                                                                  Key Points
$43        $46        $46         $45        $47
                                                                           $30                                $32
                                                                $27                    $29       $28
                                                                                                                                   AlpInvest has great investment
                                                                                                                                    performance with performance fee
                                                                                                                                    upside
2016       2017       2018       2019        Q2                2016        2017        2018      2019          Q2
                                            2020                                                              2020                           • 12% net IRR since inception & 1.6x MOIC with
                                                                                                                                               LTM appreciation of 3%2

               Metropolitan                                                Metropolitan
                                                                                                                                             • Performance revenues well positioned to
                   $2.4                                                        $2.2                                                            improve as post-acquisition European
                                                                                                                                               waterfall funds mature
             AlpInvest -                                                 AlpInvest -
               Co-Inv                                                                           AlpInvest -
                                    AlpInvest -                            Co-Inv
                $9.1                                                                            Primary &
                                    Primary &                               $5.8
                      $47b                                                         $32b
                                                                                                  Other¹
                                                                                                                                   Effective management fee rate should
                                      Other¹
                                                                                                   $12.7
                                       $21.1
              AlpInvest -
              Secondary
                                                                             AlpInvest -                                            rise over time
                                                                             Secondary
                 $14.3                                                          $11.1                                                        • New commitments from third party investors
                                                                                                                                               have higher fee yield than prior AUM

                                      Financial Metrics ($mm)                                                                                • Expect older/low fee commitments to drive
                                                                                                                                               FEAUM runoff over next few years
                                            2017          2018            2019               YTD Q2 2020
 Fee Related Earnings                        $32           $34             $17                      $20
 Net Realized
                                               3             10              6                        5
 Performance Revenues
 Distributable Earnings                       30             39             19                       22
Note: Data as of June 30, 2020. See The Carlyle Group Inc.’s filings with the U.S. Securities and Exchange Commission for more information on fund performance.
1) Includes Mezzanine funds.
2) Includes impact from foreign exchange gain/loss in underlying fund investments.                                                                                                         20
SECOND QUARTER 2020
     EARNINGS
Carlyle Second Quarter 2020 U.S. GAAP Results
    • Net income (loss) attributable to The Carlyle Group Inc. common stockholders in Q2 2020 was $145.9
      million
                       (Dollars in millions, except per share amounts)                                                                2Q'19               2Q'20                YTD 2Q'19           YTD 2Q'20
                       REVENUES
                         Fund management fees                                                                                    $      390.9        $      371.8          $      744.3        $      727.7
                         Incentive fees                                                                                                   8.8                 9.0                  16.9                17.9
                         Investment income (loss), including performance allocations                                                    589.6               679.2               1,240.5              (511.7)
                         Revenue from consolidated entities                                                                              45.8                55.2                  98.2               108.2
                         All other revenues                                                                                              26.0                15.8                  48.2                43.2
                             Total Revenues                                                                                           1,061.1             1,131.0               2,148.1               385.3
                       EXPENSES
                         Cash-based compensation and benefits                                                                           221.4               212.5                 431.9               416.8
                         Equity-based compensation                                                                                       35.2                30.5                  71.2                59.6
                         Performance allocations and incentive fee related compensation                                                 113.6               535.6                 299.0                93.1
                         General, administrative and other expenses                                                                     110.7                80.2                 223.2               149.8
                         Expenses from consolidated entities                                                                             27.5                39.3                  65.6                84.9
                         Interest and other non-operating expenses (income)                                                              19.9                26.4                  39.9                50.5
                             Total Expenses                                                                                             528.3               924.5               1,130.8               854.7
                       Net investment gains (losses) of consolidated funds                                                                9.2                50.3                  (5.0)              (62.8)
                       Income (loss) before provision for income taxes 1                                                                542.0               256.8               1,012.3              (532.2)
                       Provision (benefit) for income taxes                                                                              15.5                52.3                  39.5               (27.7)
                       Net income (loss)                                                                                                526.5               204.5                 972.8              (504.5)
                       Net income (loss) attributable to non-controlling interests in consolidated entities                              39.8                58.6                  35.3               (38.4)
                       Net income (loss) attributable to Carlyle Holdings                                                               486.7               145.9                 937.5              (466.1)
                       Net income (loss) attributable to non-controlling interests in Carlyle Holdings                                  332.6                  —                  640.5                  —
                       Net income (loss) attributable to The Carlyle Group Inc.                                                         154.1               145.9                 297.0              (466.1)
                       Net income attributable to Series A Preferred Unitholders                                                          5.9                  —                   11.8                  —
                       Net income (loss) attributable to The Carlyle Group Inc. Common Stockholders                              $      148.2        $      145.9          $      285.2        $     (466.1)
                       Net income (loss) attributable to The Carlyle Group Inc. per common share
                          Basic                                                                                                  $       1.34        $       0.42          $       2.60        $      (1.34)
                          Diluted                                                                                                $       1.23        $       0.41          $       2.41        $      (1.34)
                       Income (loss) before provision for taxes margin 2                                                                 51.1 %              22.7 %                47.1 %            (138.1)%

• Our U.S. GAAP results for Q2 2020 include a loss in principal investment income (loss) of $(621) million related to the closing of the transaction in which a Carlyle-affiliated investment fund purchased additional interests
  in Fortitude from AIG. The loss is driven by the contribution of our existing 19.9% investment in Fortitude into the fund, and the subsequent accounting for our investment based on the net asset value of our limited
  partnership interest in the fund rather than a direct interest in Fortitude. This loss is more than offset by additional accrued performance allocations of $1,192 million recognized as a result of the appreciation in our funds
  during the quarter.

On January 1, 2020, The Carlyle Group L.P. (the "Partnership") completed its conversion from a Delaware limited partnership to a Delaware corporation, The Carlyle Group Inc. Information reported for periods prior to the
Conversion on January 1, 2020 reflect the results of the Partnership. References to The Carlyle Group Inc., our common stock and our dividends in periods prior to the Conversion refer to The Carlyle Group L.P., its
common units and distributions. For periods subsequent to Conversion, Net income (loss) attributable to Carlyle Holdings refers to the Net income (loss) of The Carlyle Group Inc. and its consolidated subsidiaries, net of
non-controlling interests in consolidated entities. LTM results for the provision (benefit) for income taxes and net income (loss) attributable to Carlyle Holdings are not meaningful due to the change in our structure in 22
connection with the Conversion. See Notes at end of document.
Carlyle Second Quarter 2020 Total Segment Operating Results
     (Dollars in millions, except per share amounts)                                                                 2Q'19                 2Q'20                      YTD 2Q'19             YTD 2Q'20

     SEGMENT REVENUES
       Fund management fees                                                                                   $         414.5       $         386.4               $         796.1       $         767.9
       Transaction and portfolio advisory fees, net and other                                                            14.9                  18.3                          24.9                  25.1
        Total segment fee revenues                                                                                      429.4                 404.7                         821.0                 793.0
       Realized performance revenues                                                                                     41.9                 152.2                          91.1                 323.8
        Realized principal investment income3                                                                            73.9                  22.1                          78.0                  38.0
        Interest income                                                                                                    5.5                   3.2                         11.5                    8.5
         Total Segment Revenues                                                                               $         550.7       $         582.2               $       1,001.6       $       1,163.3
     SEGMENT EXPENSES
       Compensation and benefits
        Cash-based compensation and benefits                                                                  $         207.1       $         210.1               $         409.4       $         413.9
        Realized performance revenues related compensation                                                               21.1                  81.3                          63.3                 204.7
          Total compensation and benefits4                                                                              228.2                 291.4                         472.7                 618.6
        General, administrative and other expenses                                                                       80.0                  58.1                         155.7                 106.4
        Depreciation and amortization expense                                                                             9.6                   9.2                          19.9                  16.6
        Interest expense                                                                                                 19.5                   25.1                         39.1                  48.3
            Total Segment Expenses                                                                            $         337.3       $         383.8               $         687.4       $         789.9

     Total Segment Revenues                                                                                   $         550.7       $         582.2               $       1,001.6       $       1,163.3
     Total Segment Expenses                                                                                             337.3                 383.8                         687.4                 789.9
     (=) Distributable Earnings                                                                               $         213.4       $         198.4               $         314.2       $         373.4
         (-) Realized Net Performance Revenues                                                                           20.8                  70.9                          27.8                 119.1
         (-) Realized Principal Investment Income                                                                        73.9                  22.1                          78.0                  38.0
         (+) Net Interest                                                                                                14.0                  21.9                          27.6                  39.8
     (=) Fee Related Earnings                                                                                 $         132.7       $         127.3               $         236.0       $         256.1

     After-tax Distributable Earnings, per common share1                                                      $           0.57      $           0.53              $          0.82       $          1.01
     Dividend per common share2                                                                               $           0.43      $           0.25              $          0.62       $          0.50

 (1) A reconciliation of Distributable Earnings to After-tax Distributable Earnings per common share is provided on page 42.
 (2) Our dividend policy as a Corporation is to pay dividends in an initial amount of $0.25 per share of common stock ($1.00 annually), beginning with the 4Q'19 dividend paid to stockholders in February 2020.
     See Notes at the end of the document for our Dividend Policy.
 (3) Realized principal investment income in 2Q'19 and YTD 2Q'19 includes $72 million of gain upon the final resolution of French tax litigation concerning a European Real Estate fund, reversing in part a loss
     that was recognized in 2015.
 (4) Total Segment compensation and benefits exclude equity-based compensation, detailed below and as shown on page 43. These amounts include equity-based compensation reflected in (i) principal
     investment income and (ii) general, administration and other expense in our U.S. GAAP statement of operations, and excludes amounts related to shares issued in conjunction with a previous acquisition.

     Equity-based compensation                                                                                $           38.3      $            34.6             $           77.7      $           66.3            23
Distributable Earnings

• Distributable Earnings were $198 million in Q2 2020 and $373 million YTD
     – Fee Related Earnings accounted for 64% of Distributable Earnings in the quarter and 69% for the YTD period

• Realized Net Performance Revenues were $71 million in Q2 2020 and $119 million YTD
     – Corporate Private Equity and Real Assets contributed 43% and 40% of Realized Net Performance Revenue,
       respectively for the YTD period

• Realized Principal Investment Income was $22 million in Q2 2020 and $38 million YTD

                                                                                                                    24
Fee Related Earnings
 • Fee Related Earnings were $127 million in Q2 2020, down from $133 million in Q2 2019, with the decrease driven by lower catch-up
   management fees, and partially offset by higher transaction fees and lower general & administrative expenses. YTD Fee Related Earnings of
   $256 million were 9% higher compared to $236 million in the prior YTD period
 • Management Fees were $386 million in Q2 2020, down 7% from $415 million in Q2 2019, and included catch-up management fees of $2
   million in Q2 2020 compared to $28 million in Q2 2019. This quarter's management fees were negatively affected by the net deferral of $4
   million of subordinated fees in our structured credit business. YTD management fees of $768 million were down from $796 million in the prior
   YTD period. Transaction fees of $14 million in Q2 2020 were driven by the closing of our recent Fortitude transaction and increased from $10
   million in Q2 2019
 • Cash-based compensation & benefits were $210 million in Q2 2020, a 1% increase from $207 million in Q2 2019. YTD cash-based
   compensation & benefits of $414 million were also 1% higher compared to the prior YTD period
 • General & administrative expenses were $58 million in Q2 2020, a decline of 27% from Q2 2019 reflecting lower travel and other general &
   administrative expenditures, as well as $8 million in expense recoveries related to the Fortitude transaction
 • FRE margin was 31% in Q2 2020 and 32% YTD

 FRE              31%            27%   26%     33%         31%                            25%                28%               32%
Margin1
 See Notes at end of document.                                                                                                                25
Performance Revenues
• Net Accrued Performance Revenues1 were $1.8 billion as of Q2 2020, up 49% from $1.2 billion last quarter due largely to
  strong appreciation in our sixth U.S. Buyout fund, and up 4% YTD

• Realized Net Performance Revenues were $71 million in Q2 2020 and $119 million YTD

          – Q2 2020 Realized Net Performance Revenues were primarily driven by exit activity in our U.S. Real Estate and
            European Technology funds

                                                 $1,783
     $1,720

                                                                                                                     Corporate
                                                                      Real                                           Private
                                                                      Assets                                         Equity
                                                                                            $119mm

                                                                               Investment
                                         2                                     Solutions         Global Credit

See Notes at end of document.                                                                                               26
Total Assets Under Management

• Total Assets Under Management1 of $221 billion at June 30, 2020 increased 2% from the prior quarter
  and decreased (1)% YTD
• Available Capital2 of $73 billion at June 30, 2020 decreased from $74 billion in the prior quarter

                                                                          3
                                 YTD
                                Change
                                 (1)%
                                           Credit & Other                                                   $47     $221
                                           (Non-Carry Fund)
                                 4%
                                                                                                    $50
                                 1%

                                                              $221bn                       $40
                                 (7)%    Investment
                                         Solutions                                   $84
                                         Carry
                                         Funds

                                 (2)%                                  Traditional
                                                                       Carry Funds

                                                                                        Fair Value  Available Capital

See Notes at end of document.                                                                                              27
Fair Value of Investments
• Fair Value of Investments4 of $148 billion at June 30, 2020 increased 3% from $143 billion in the prior quarter, and is down (5)% YTD

• Fair value in traditional carry funds of $81 billion increased 6% from 1Q 2020 and is down (7)% YTD. The in-carry ratio of 40%
  increased from 36% in Q1 2020, largely due to our Credit Opportunities fund moving back into a carry position

• Fair value of our public portfolio increased to 14% of the traditional carry fund value from 8% in Q1 2020 due to an IPO in our U.S.
  Buyout funds and appreciation in the value our previous public portfolio

                                                             3                             Traditional Carry Funds

                                                                                                                        In-Carry Ratio5

                                                                                                                             40%
                                                                                                          Natural
                                                                                                          Resources
                                                                    Corporate
                                                                    Private
                                                                    Equity                                              Publicly Traded
                                                                                  $81bn                                       14%

                                                                                                          Real Estate
                                                                                                                        Aged 4+ Years6
                                                                                                 Legacy
                                                                                        Global   Energy                       28%
                                                                                        Credit

See Notes at end of document. Totals may not sum due to rounding.                                                                         28
Fee-earning Assets Under Management
• Fee-earning Assets Under Management7 of $162 billion increased 3% from the prior quarter and 1% YTD, with growth in
  Global Credit (10% YTD) and Investment Solutions (12% YTD) partially offset by runoff in Corporate Private Equity and Real
  Assets

• Pending Fee-earning AUM8 was $8.5 billion as of June 30, 2020, down from $12.5 billion in the prior quarter as our latest
  Secondaries (Investment Solutions) and Aviation (Global Credit) funds activated fees during Q2 2020

                                                                                                             3
                                                                     YTD
                                                                    Change
                                                                                     Credit
                                                                     1%              (Non-Carry
                                                                                     Fund)

                                                                     12%

                                                                     10%
                                                                             Investment
                                                                             Solutions            $162bn
                                                                             Carry Funds
                                                                     (5)%

                                                                     (7)%
                                                                                                                 Traditional
                                                                                                                 Carry Funds

See Notes at end of document. Totals may not sum due to rounding.                                                              29
Key Metrics Activity

  • Fundraising was $4.8 billion in Q2 2020 driven by activity in Investment Solutions and Global Credit, and $12.4 billion YTD

  • Invested Capital in carry funds was $2.9 billion in Q2 2020 and $5.9 billion YTD, with a higher relative level of activity in
    Investment Solutions and Real Assets on a YTD basis

  • Realized Proceeds in carry funds was $5.7 billion in Q2 2020 driven by exit activity in Corporate Private Equity, and $10.2
    billion YTD

                                                          Fundraising                   Invested Capital               Realized Proceeds
                                                                                          Carry Funds                      Carry Funds

                                                                YTD      LTM                 YTD            LTM               YTD         LTM
($bn)                                       2Q'20              2Q'20            2Q'20       2Q'20          2Q'20   2Q'20     2Q'20       2Q'20
                                                                        2Q'20

Total                                         $4.8             $12.4    $21.3   $2.9         $5.9          $16.4   $5.7      $10.2       $21.0

Corporate Private Equity                       $—               $0.5    $3.8    $0.5         $1.3          $4.2    $2.6       $4.7       $7.1

Real Assets1                                  $0.5              $1.7    $2.7    $0.8         $1.6          $5.1    $1.1       $1.7       $5.3

  Real Estate                                  $0.2              $0.7    $1.1    $0.5         $0.7          $1.9    $0.8      $1.3         $3.4

  Natural Resources                            $0.3              $0.9    $1.6    $0.3         $0.8          $3.1    $0.1      $0.1         $1.2

Global Credit                                 $2.9              $4.5    $7.7    $0.5         $1.3          $2.7    $0.4       $0.7       $2.0

Investment Solutions                          $1.4              $5.8    $7.1    $1.0         $1.7          $4.5    $1.5       $3.0       $6.6

  See Notes at end of document. Totals may not sum due to rounding.                                                                          30
SUPPLEMENTAL DETAILS
Carlyle Second Quarter 2020 Total Segment Results
     (Dollars in millions, except per share amounts)                                2Q'19            3Q'19           4Q'19           1Q'20           2Q'20             YTD 2Q'19        YTD 2Q'20

     SEGMENT REVENUES
       Fund management fees                                                     $ 414.5          $ 384.6         $ 390.2         $ 381.5         $ 386.4            $ 796.1         $ 767.9
       Transaction and portfolio advisory fees, net and other                      14.9             11.1            17.5             6.8            18.3               24.9            25.1
        Total segment fee revenues                                                429.4            395.7           407.7           388.3           404.7              821.0           793.0
       Realized performance revenues                                               41.9            118.3           164.9           171.6           152.2               91.1           323.8
       Realized principal investment income                                        73.9              7.3             1.7            15.9            22.1               78.0            38.0
         Interest income                                                               5.5             6.5              6.4             5.3             3.2               11.5              8.5
         Total Segment Revenues                                                 $ 550.7          $ 527.8         $ 580.7         $ 581.1         $ 582.2            $ 1,001.6       $ 1,163.3
     SEGMENT EXPENSES
       Compensation and benefits
        Cash-based compensation and benefits                                    $ 207.1          $ 194.1         $ 188.6         $ 203.8         $ 210.1            $ 409.4         $ 413.9
        Realized performance revenues related compensation                         21.1             60.6            86.3           123.4            81.3               63.3           204.7
           Total compensation and benefits1                                       228.2            254.7           274.9           327.2           291.4              472.7           618.6
         General, administrative and other expenses                                80.0             81.0            94.6            48.3            58.1              155.7           106.4
         Depreciation and amortization expense                                      9.6             11.8            16.5             7.4             9.2               19.9            16.6
         Interest expense                                                             19.5            19.6            23.0            23.2             25.1               39.1             48.3
             Total Segment Expenses                                             $ 337.3          $ 367.1         $ 409.0         $ 406.1         $ 383.8            $ 687.4         $ 789.9

     Total Segment Revenues                                                       550.7            527.8           580.7           581.1           582.2             1,001.6         1,163.3
     Total Segment Expenses                                                       337.3            367.1           409.0           406.1           383.8               687.4           789.9
     (=) Distributable Earnings                                                 $ 213.4          $ 160.7         $ 171.7         $ 175.0         $ 198.4            $ 314.2         $ 373.4
         (-) Realized Net Performance Revenues                                     20.8             57.7            78.6            48.2            70.9                27.8           119.1
         (-) Realized Principal Investment Income                                  73.9              7.3             1.7            15.9            22.1                78.0            38.0
         (+) Net Interest                                                          14.0             13.1            16.6            17.9            21.9                27.6            39.8
     (=) Fee Related Earnings                                                   $ 132.7          $ 108.8         $ 108.0         $ 128.8         $ 127.3            $ 236.0         $ 256.1

     After-tax Distributable Earnings, per common share                         $     0.57       $    0.41       $    0.47       $    0.48       $     0.53         $     0.82      $      1.01
     Dividend per common share2                                                 $     0.43       $    0.31       $    0.25       $    0.25       $     0.25         $     0.62      $      0.50

 Note: Historical quarterly results by segment available in Q2 2020 financial supplement on Carlyle's investor relations website
 (1) Total Segment compensation and benefits exclude equity-based compensation, detailed below and as shown on page 43. These amounts include equity-based compensation reflected in (i) principal
     investment income and (ii) general, administrative and other expense in our U.S. GAAP statement of operations, and exclude amounts related to shares issued in conjunction with a previous
     acquisition.

     Equity-based compensation                                                 $     38.3       $     38.9      $     34.9      $     31.7      $     34.6         $      77.7      $      66.3
 (2) Our dividend policy as a Corporation is to pay dividends in an initial amount of $0.25 per share of common stock ($1.00 annually), beginning with the 4Q'19 dividend paid to shareholders in February
     2020. See Notes at the end of the document for our Dividend Policy.                                                                                                                                     32
Total Segment Balance Sheet Highlights

• Balance sheet assets attributable to Carlyle stockholders (including net cash and equivalents, net accrued
  performance revenue and investments) totaled $2.1 billion at June 30, 2020
• Balance sheet cash totaled $0.6 billion as of June 30, 2020, with no balance drawn on our $775 million
  revolving credit line

Key Balance Sheet Items1($mn)                                                    6/30/2020             KEY BALANCE SHEET ITEMS ($BN)
Cash and Cash Equivalents                                                           $554.5

Net accrued performance revenues2
(net of related accrued compensation                                              $1,783.3
and accrued giveback)
                                                                                                                                       Net
Investments attributable to Carlyle                                               $1,423.1                                             Accrued
stockholders3                                                                                                                          Performance
                                                                                                                                       Revenues2

Debt obligations4                                                                 $1,616.9

Drawn revolving credit line
                                                                                      $0.0
($775 million remaining capacity)                                                                                                      Investments3

(1) Balance sheet amounts presented exclude the effect of U.S. GAAP consolidation eliminations on
    investments and accrued performance revenue, as well as cash and debt associated with Carlyle's
    consolidated funds.

(2) See page 45 for a reconciliation of net accrued performance revenues as of June 30, 2020 to U.S.                                   Cash/Equivalents
    GAAP.
                                                                                                                                       less Debt4
(3) Investments exclude the equity investments by Carlyle in NGP Energy Capital Management and the
    portion of CLO and CCS investments attributable to Carlyle stockholders that were financed with
    debt. Refer to page 45 for a reconciliation to U.S. GAAP.

(4) Excludes approximately $327 million of loans used to finance CLO and CCS investments and $267
    million of lease liabilities.

                                                                                                                                                      33
AUM and Fee-earning AUM Roll Forward

                                                                            Total AUM Roll Forward (Unaudited)
($mm)                                                        Three Months Ended June 30, 2020                                          Six Months Ended June 30, 2020
                                            Corporate                                                                    Corporate
                                             Private          Real             Global    Investment                       Private      Real        Global    Investment
                                             Equity          Assets            Credit     Solutions5       Total          Equity      Assets       Credit     Solutions5         Total
Balance, Beginning of Period              $ 80,383         $ 39,794          $ 48,802    $   47,954    $ 216,933     $    86,429     $ 43,355    $ 49,412    $    45,246      $ 224,442

Inflows1                                           —             536            2,615         1,445        4,596             492        1,650       3,873          5,714         11,729

Outflows (including realizations)2            (2,177)           (780)          (2,019)       (1,659)       (6,635)        (3,555)      (1,257)     (2,533)         (3,214)      (10,559)

Market Activity & Other3                       5,727             501             395         (1,694)       4,929             999       (3,552)      (777)           (881)        (4,211)

Foreign Exchange4                                357             125             199           828         1,509             (75)         (20)        17                9           (69)

 Balance, End of Period                   $ 84,290         $ 40,176          $ 49,992    $   46,874    $ 221,332     $    84,290     $ 40,176    $ 49,992    $    46,874      $ 221,332

                                                               Fee-earning AUM Roll Forward (Unaudited)
($mm)                                                        Three Months Ended June 30, 2020                                          Six Months Ended June 30, 2020
                                            Corporate                                                                    Corporate
                                             Private         Real              Global    Investment                       Private      Real        Global        Investment
                                             Equity         Assets10           Credit     Solutions       Total           Equity      Assets10     Credit         Solutions       Total
Balance, Beginning of Period              $ 61,088         $ 30,891          $ 38,065    $   28,202    $ 158,246     $    61,660     $ 33,151    $ 37,862    $     28,384     $ 161,057

Inflows6                                          45             759            3,457         5,410        9,671              88        1,516       4,517           6,447        12,568

Outflows (including realizations)7            (3,845)                (66)       (412)        (1,542)      (5,865)          (4,102)     (2,861)     (1,310)         (2,248)      (10,521)

Market Activity & Other8                        (346)                (88)         61           (824)      (1,197)           (346)        (224)        270            (868)       (1,168)

Foreign Exchange9                                281                 73          659           521         1,534              (77)        (13)        491              52           453

 Balance, End of Period                   $ 57,223         $ 31,569          $ 41,830    $   31,767    $ 162,389     $    57,223     $ 31,569    $ 41,830    $     31,767     $ 162,389

 Totals may not sum due to rounding. See Notes at end of document.                                                                                                                  34
Corporate Private Equity Fund Performance

See Notes at end of document.               35
Real Assets Fund Performance

See Notes at end of document.   36
Global Credit Fund Performance (Carry Funds Only)

See Notes at end of document.                       37
Investment Solutions Fund Performance

See Notes at end of document.           38
RECONCILIATION & DISCLOSURES
Reconciliation for Distributable Earnings Per Share (Unaudited)
(Dollars in millions,                                              2Q'19           3Q'19            4Q'19           1Q'20            2Q'20             YTD 2Q'20          LTM 2Q'20         QoQ           YoY         LTM
except per share data and where noted)

FEE RELATED EARNINGS                                           $   132.7       $    108.8       $   108.0       $   128.8        $   127.3         $     256.1        $     472.9            (1)%         (4)%        (5)%

DISTRIBUTABLE EARNINGS                                         $   213.4       $    160.7       $   171.7       $   175.0        $   198.4         $     373.4        $     705.8            13%          (7)%        (4)%

DISTRIBUTABLE EARNINGS, TAX AND PER SHARE INFORMATION 1

      Distributable Earnings                                   $   213.4       $    160.7       $   171.7       $   175.0        $   198.4         $     373.4        $     705.8

      Less: Estimated current corporate, foreign, state               8.8             8.5              5.2             7.7            10.7                18.4               32.1
      and local taxes 2
      Less: Preferred share distributions                             5.9             7.3               —               —                —                  —                  7.3

DISTRIBUTABLE EARNINGS, NET                                    $   198.7       $    144.9       $   166.5       $   167.3        $   187.7         $     355.0        $     666.4
attributable to common stockholders

DISTRIBUTABLE EARNINGS, NET                                    $     0.57      $     0.41       $    0.47       $     0.48       $    0.53         $      1.01        $      1.89
per common share outstanding

Dividend per common share*                                     $     0.43      $     0.31       $    0.25       $     0.25       $    0.25         $      0.50        $      1.06

TOTAL OUTSTANDING SHARES (in millions)                             341.2            346.7           347.2           348.4            348.7               348.7              348.7

Shares eligible for dividend (in millions)**                       116.1            117.8           349.4           348.7            353.3               353.3              353.3

  *   Our dividend policy as a Corporation is to pay dividends in an initial amount of $0.25 per share of common stock ($1.00 annually), beginning with the 4Q'19 dividend paid to shareholders in February 2020. See
      Notes at the end of the document for our Dividend Policy.
  ** Shares eligible for dividend include 4.6 million common shares that will be issued in May 2020 in connection with the vesting of restricted stock units. For purposes of this calculation, these common shares have
      been added to the common shares outstanding as of March 31, 2020 because they will participate in the dividend paid on common shares in May 2020.
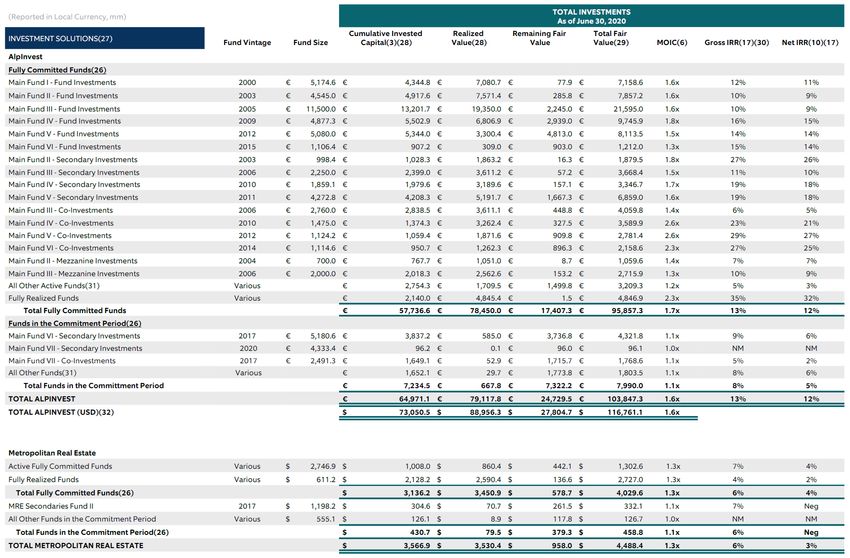
  Totals may not sum due to rounding. Information reported for periods prior to the Conversion on January 1, 2020 reflect the results of the Partnership. See Notes at end of document.                                  40
Reconciliation of GAAP to Total Segment Information

  (Dollars in millions)                                             2Q'19          3Q'19          4Q'19         1Q'20          2Q'20         YTD 2Q'19     YTD 2Q'20          FY'18          FY'19       LTM 2Q'20

  INCOME (LOSS) BEFORE PROVISION FOR INCOME
  TAXES                                                          $ 542.0        $ 261.4       $   (40.3)     $ (789.0)      $ 256.8         $ 1,012.3      $ (532.2)       $ 360.2        $ 1,233.4     $ (311.1)
  Adjustments:

      Net unrealized performance revenues                            (82.4)        126.2           69.7         528.9         (587.4)         (238.2)         (58.5)           50.2          (42.3)        137.4

      Unrealized principal investment (income) loss1               (234.9)        (198.7)          81.3         264.7          459.5          (473.5)         724.2            (48.8)       (590.9)        606.8

      Adjusted unrealized principal investment (income) loss
      from Fortitude Re                                              (40.1)        (68.1)          (5.7)         22.8           81.6            (67.1)        104.4            (11.7)       (140.9)          30.6

      Equity-based compensation2                                     38.3           38.9           34.9          31.7           34.6            77.7           66.3           252.2          151.5         140.1

      Acquisition related charges, including amortization of
      intangibles and impairment                                     15.4           11.2           13.4            3.0           7.1            27.4           10.1            22.3           52.0           34.7

      Other non-operating expense (income)                             0.4           0.3            0.3            0.2           0.5              0.7           0.7              1.1           1.3               1.3

      Tax (expense) benefit associated with certain foreign
      performance revenues                                             3.6         (10.8)          (1.0)         11.2            0.7             (2.5)         11.9             (1.5)        (14.3)              0.1

      Net (income) loss attributable to non-controlling
      interests in consolidated entities                             (39.8)        (10.5)           9.2          97.0          (58.6)           (35.3)         38.4            (33.9)        (36.6)          37.1

      Lease assignment and termination costs                            —             —              —             —              —               —              —             66.9             —                —

      Debt extinguisment costs                                          —             —              —             —              —               0.1            —               7.8           0.1               —

      Corporate conversion costs, severance and other
      adjustments                                                    10.9           10.8            9.9            4.5           3.6            12.6            8.1              9.1          33.3           28.8

  DISTRIBUTABLE EARNINGS                                         $ 213.4        $ 160.7       $ 171.7        $ 175.0        $ 198.4         $ 314.2        $ 373.4         $ 673.9        $ 646.6       $ 705.8

      Realized net performance revenues    3                         20.8           57.7           78.6          48.2           70.9            27.8          119.1           319.7          164.1         255.4

      Realized principal investment income     3                     73.9            7.3            1.7          15.9           22.1            78.0           38.0            48.1           87.0           47.0

      Net interest                                                   14.0           13.1           16.6          17.9           21.9            27.6           39.8            44.3           57.3           69.5

  FEE RELATED EARNINGS                                           $ 132.7        $ 108.8       $ 108.0        $ 128.8        $ 127.3         $ 236.0        $ 256.1         $ 350.4        $ 452.8       $ 472.9

(1) The U.S. GAAP results for 2Q'20 include a loss in principal investment income (loss) of $(621) million related to the closing of the transaction in which a Carlyle-affiliated investment fund purchased
     additional interests in Fortitude from AIG. The loss is driven by the contribution of our existing 19.9% investment in Fortitude into the fund, and the subsequent accounting for our investment based on
     the net asset value of our limited partnership interest in the fund rather than a direct investment in Fortitude.
(2) Equity-based compensation includes amounts reflected in principal investment income and general, administrative and other expense in our U.S. GAAP statement of operations, as well as amounts
     related to shares issued in conjunction with a previous acquisition. 2018 includes amounts related to the IPO.
(3) The most directly comparable U.S. GAAP measures are net performance revenues (performance revenues less performance revenues related compensation expense) and principal investment income
     (loss). See Notes at end of document for a description of adjustments to these measures to arrive at realized net performance revenues and realized principal investment income.
Information reported for periods prior to January 1, 2020 reflect the results of the Partnership.                                                                                                                      41
Reconciliation of GAAP to Total Segment Information, continued
                                 Total Reportable           Consolidated          Reconciling             Carlyle               Total Reportable           Consolidated          Reconciling              Carlyle
(Dollars in millions)               Segments                   Funds                Items              Consolidated1               Segments                   Funds                Items               Consolidated1
                                                      Three Months Ended June 30, 2019                                                                      Year to Date June 30, 2019
Revenues                        $           550.7       $          45.8       $        464.6       $       1,061.1       2      $        1,001.6       $          98.2       $      1,048.3        $       2,148.1      2

Expenses                        $           337.3       $          36.8       $        154.2       $         528.3       2      $          687.4       $          80.5       $         362.9       $       1,130.8      2

Other income (loss)             $               —       $           9.2       $            —       $            9.2      3      $              —       $           (5.0)     $            —        $          (5.0)     3

Distributable Earnings          $           213.4       $          18.2       $        310.4       $         542.0       4      $          314.2       $          12.7       $         685.4       $       1,012.3      4

                                                    Three Months Ended September 30, 2019                                                                   Year to Date June 30, 2020
Revenues                        $           527.8       $          51.3       $        189.5       $         768.6       2      $        1,163.3       $         108.2       $        (886.2)      $         385.3      2

Expenses                        $           367.1       $          44.1       $          94.1      $         505.3       2      $          789.9       $         100.9       $         (36.1)      $         854.7      2

Other income (loss)             $               —       $          (1.9)      $            —       $           (1.9)     3      $              —       $         (62.8)      $            —        $         (62.8)     3

Distributable Earnings          $           160.7       $           5.3       $          95.4      $         261.4       4      $          373.4       $         (55.5)      $        (850.1)      $        (532.2)     4

                                                    Three Months Ended December 31, 2019                                                                Year Ended December 31, 2018
Revenues                        $           580.7       $          49.7       $       (170.1)      $         460.3       2      $        2,185.9       $         214.5       $          26.8       $       2,427.2      2

Expenses                        $           409.0       $          41.0       $          33.6      $         483.6       2      $        1,512.0       $         213.3       $         346.2       $       2,071.5      2

Other income (loss)             $               —       $         (17.0)      $            —       $          (17.0)     3      $              —       $            4.5      $            —        $           4.5      3

Distributable Earnings          $           171.7       $          (8.3)      $       (203.7)      $          (40.3)     4      $          673.9       $            5.7      $        (319.4)      $         360.2      4

                                                      Three Months Ended March 31, 2020                                                                 Year Ended December 31, 2019
Revenues                        $           581.1       $          53.0       $     (1,379.8)      $        (745.7)      2      $        2,110.1       $         199.2       $      1,067.7        $       3,377.0      2

Expenses                        $           406.1       $          53.8       $       (529.7)      $          (69.8)     2      $        1,463.5       $         165.6       $         490.6       $       2,119.7      2

Other income (loss)             $               —       $        (113.1)      $            —       $        (113.1)      3      $              —       $         (23.9)      $            —        $         (23.9)     3

Distributable Earnings          $           175.0       $        (113.9)      $       (850.1)      $        (789.0)      4      $          646.6       $            9.7      $         577.1       $       1,233.4      4

                                                      Three Months Ended June 30, 2020                                                               Twelve Months Ended June 30, 2020
Revenues                        $           582.2       $          55.2       $        493.6       $       1,131.0       2      $        2,271.8       $         209.2       $        (866.8)      $       1,614.2      2

Expenses                        $           383.8       $          47.1       $        493.6       $         924.5       2      $        1,566.0       $         186.0       $          91.6       $       1,843.6      2

Other income (loss)             $               —       $          50.3       $            —       $           50.3      3      $              —       $         (81.7)      $            —        $         (81.7)     3

Distributable Earnings          $           198.4       $          58.4       $            —       $         256.8       4      $          705.8       $         (58.5)      $        (958.4)      $        (311.1)     4

  (1)   The Distributable Earnings in the Carlyle Consolidated column is income before provision for income taxes, which is the GAAP measure that is most directly comparable to Distributable Earnings.
  (2)   See detailed breakdown of revenue and expense adjustments on page 45.
  (3)   The Other Income (Loss) adjustment results from the Consolidated Funds which were eliminated in consolidation to arrive at Carlyle's total Other Income (Loss).
  (4)   See the reconciliation for Distributable Earnings and Fee Related Earnings on page 43.                                                                                                                         42
Reconciliation of GAAP to Total Segment Information, continued

                                                                 43
Reconciliation for Total Segment Information, continued

(1) The Company has equity interests in NGP Management Company, L.L.C. ("NGP Management"), the general partners of certain carry funds advised by NGP, and principal investments in certain NGP
    funds. These equity interests are accounted for as investments under the equity method of accounting. Total investments attributable to The Carlyle Group Inc. excludes the strategic equity method
    investment in NGP Management and investments in the general partners of certain NGP carry funds.
(2) Of the $328.4 million in CLO loans and other borrowings as of June 30, 2020, $310.4 million are collateralized by investments attributable to The Carlyle Group Inc.
(3) Accrued performance allocations are presented as an investment in the U.S. GAAP balance sheet.                                                                                                        44
You can also read