ALL-ISLAND TRANSMISSION SYSTEM PERFORMANCE REPORT 2019 - EIRGRID
←
→
Page content transcription
If your browser does not render page correctly, please read the page content below
All-Island Transmission
System Performance Report
          2019
Table of Contents
1. Introduction .......................................................................................................................... 7
2. Executive Summary ............................................................................................................. 8
2.1 Key Data ...................................................................................................................... 8
3. All-Island System Data ........................................................................................................ 9
3.1 Overview of the All-Island Electricity System ................................................................ 9
3.2 Total System Production .............................................................................................. 9
3.3 System Records ......................................................................................................... 10
3.4 Generation Capacity ................................................................................................... 10
3.5 Generation Availability ................................................................................................ 11
3.6 Generation Forced Outage Rate ................................................................................ 12
3.7 Generation Scheduled Outage Rate ........................................................................... 13
4. EirGrid Transmission System Performance ....................................................................... 15
4.1 Summary .................................................................................................................... 15
4.2 Grid Development and Maintenance .......................................................................... 15
4.2.1 Completed Capital Projects ...................................................................................... 15
4.2.2 New Connection Offers ............................................................................................. 16
4.2.3 Connections Energised ............................................................................................. 17
4.2.4 Customers Certified Operational ............................................................................... 17
4.3 General System Performance .................................................................................... 18
4.3.1 Under-Frequency Load Shedding ............................................................................. 18
4.3.2 Under-Voltage Load Shedding .................................................................................. 19
4.4 System Minutes Lost .................................................................................................. 20
4.5 Zone Clearance Ratio................................................................................................. 21
4.5.1 Frequency Control .................................................................................................... 21
4.6 Summary of key disturbances .................................................................................... 22
4.6.1 Loss of load .............................................................................................................. 22
4.6.2 Under-Frequency Load Shedding ............................................................................. 22
4.6.3 Storms Resulting in Trippings ................................................................................... 22
4.7 Transmission System Availability & Outages .............................................................. 24
4.7.1 Transmission System Availability .............................................................................. 24
4.7.2 Transmission Plant Availability ................................................................................. 24
4.7.3 Cause of Transmission Plant Unavailability .............................................................. 26
4.7.4 110 kV Circuit Unavailability ..................................................................................... 26
4.7.5 220 kV Circuit Unavailability ..................................................................................... 27
4.7.6 275 kV Circuit Unavailability ..................................................................................... 28
4.7.7 400 kV Circuit Unavailability ..................................................................................... 28
Transmission System Performance Report • 2019 Page 24.7.8. East West Interconnector......................................................................................... 31
4.7.9. East West Interconnector Unavailability ................................................................... 31
4.7.10 Transmission Outage Duration ............................................................................... 31
4.7.11 Timing of Transmission Outages ............................................................................ 32
4.7.12 Forced Outages ...................................................................................................... 33
4.7.13 Forced Outages per km .......................................................................................... 33
4.7.14 Forced Outages per MVA ....................................................................................... 35
5. SONI Transmission System Performance .......................................................................... 36
5.1 Summary .................................................................................................................... 36
5.2 Transmission System Availability................................................................................ 37
5.2.1 System Availability .................................................................................................... 37
5.2.2 System Unavailability ................................................................................................ 39
5.2.3 System Historical Availability Performance ............................................................... 40
5.2.4 System Historical Unavailability Performance ........................................................... 41
5.2.5 Moyle Interconnector ................................................................................................ 41
5.2.6 Moyle Interconnector Historical Availability ............................................................... 42
5.2.7 Moyle Interconnector Historical Unavailability ........................................................... 43
5.2.8 Moyle Interconnector Monthly Unavailability ............................................................. 43
5.2.9 275 kV Tie Line......................................................................................................... 44
5.2.10 110 kV Tie lines ...................................................................................................... 45
5.3 Transmission System Security ................................................................................... 47
5.3.1 Incidents for 2019 ..................................................................................................... 47
5.3.2 Number of Incidents and Estimated Unsupplied Energy ........................................... 48
5.3.3 Incident Analysis ....................................................................................................... 48
5.3.4 Unsupplied Energy ................................................................................................... 49
5.3.5 System minutes lost.................................................................................................. 49
5.3.6 Zone Clearance Ratio ............................................................................................... 50
5.4 Quality of Service ....................................................................................................... 50
5.4.1 Voltage ..................................................................................................................... 50
5.4.2 Voltage Excursions ................................................................................................... 51
5.4.3 Frequency ................................................................................................................ 52
5.4.4 Frequency Excursions .............................................................................................. 53
5.4.5 Historical Frequency Excursions ............................................................................... 54
6. Appendix 1 Glossary.......................................................................................................... 55
6.1 DCEF ......................................................................................................................... 55
6.2 Disturbance ................................................................................................................ 55
6.3 Fault ........................................................................................................................... 55
Transmission System Performance Report • 2019 Page 36.4 Main system: EirGrid .................................................................................................. 55
6.5 Main system: SONI .................................................................................................... 56
6.6 Major incident ............................................................................................................. 56
6.7 MVA Minute Lost ........................................................................................................ 56
6.8 Non main system/outside the main system: EirGrid .................................................... 56
6.9 Non main system/outside the main system: SONI ...................................................... 56
6.10 Non System Fault ....................................................................................................... 56
6.11 Permanent Fault ......................................................................................................... 57
6.12 POTT ......................................................................................................................... 57
6.13 Protection - Correct Operation .................................................................................... 57
6.14 Protection - Incorrect Operation .................................................................................. 57
6.15 PUTT .......................................................................................................................... 57
6.16 Sustained Interruption ................................................................................................ 57
6.17 System Fault .............................................................................................................. 57
6.18 System Minute............................................................................................................ 58
6.19 Transient Fault ........................................................................................................... 58
6.20 Zone Clearance Ratio................................................................................................. 58
6.21 Zones of Protection .................................................................................................... 59
7. Appendix 2 All Island Frequency Excursion Graphs........................................................... 60
7.1 Great Island 4- 20/03/2019 ......................................................................................... 61
7.2 Dublin Bay 1 24/04/2019 ............................................................................................ 61
7.3 Whitegate 1 08/05/2019 ............................................................................................. 62
7.4 Great Island 4 – 20/05/2019 ....................................................................................... 62
7.5 Whitegate 1- 15/08/2019 ............................................................................................ 63
8. Appendix 3 All Island Fully Dispatchable Generation Plant ................................................ 64
9. Appendix 4 EirGrid Maintenance Policy Terms .................................................................. 67
10. Appendix 5 Formulae......................................................................................................... 68
10.1 Ireland Availability & Unavailability Formula ............................................................... 68
10.2 System Minute Formula.............................................................................................. 68
Transmission System Performance Report • 2019 Page 4List of Figures Figure 1: Generation System Availability 2019 .............................................................. 12 Figure 2: Generation System Forced Outage Rate 2019 .............................................. 13 Figure 3: Generation System Scheduled Outage Rate 2019 ......................................... 14 Figure 4: Under frequency disturbances 2004-2019...................................................... 18 Figure 5: Lowest system frequency 2004-2019 ............................................................. 19 Figure 6: System minutes lost and associated targets: EirGrid 2004-2019 ................... 20 Figure 7: Zone clearance ratio: EirGrid 2004-2019 ........................................................ 21 Figure 8: Monthly Variations of System Unavailability 2019 .......................................... 24 Figure 9: Causes of Unavailability on the 110 kV System in 2019................................. 27 Figure 10: Causes of Unavailability on the 220 kV System in 2019 ............................... 28 Figure 11: Causes of Unavailability on the 400kV System in 2019 ................................ 29 Figure 12: Duration of Outages in 2018 & 2019 ............................................................ 31 Figure 13: Percentage unavailability in each month of 2018 & 2019 ............................. 32 Figure 14: Average duration of outages 2018 & 2019 ................................................... 33 Figure 15: Forced Outages of lines and cables per km in 2019 ..................................... 34 Figure 16: Forced Outage per MVA in 2019 .................................................................. 35 Figure 17: Transmission System Availability 2019 ........................................................ 39 Figure 18: Transmission System Unavailability 2019 .................................................... 40 Figure 19: Historical System Availability 2005/2006 to 2019 ......................................... 40 Figure 20: Historical System Unavailability 2005/2006 to 2019 ..................................... 41 Figure 21: Moyle Interconnector Monthly Unavailability 2019........................................ 44 Figure 22: Historical North-South Tie Line Availability 2005/2006 to 2019 .................... 45 Figure 23: North-South Tie Line Availability 2005/2006 to 2019 .................................... 46 Figure 24: 110kV Tie Line Unavailability 2019............................................................... 47 Figure 25: Historical System Security 2005/2006 to 2019 ............................................. 48 Figure 26: Historical Unsupplied Energy 2005/2006 to 2019 ......................................... 49 Figure 27: System minutes lost 2012 - 2019 ................................................................. 50 Figure 28: Historic Frequency Excursions 2012-2019 ................................................... 54 Figure 29: Zones of Protection ...................................................................................... 59 Figure 30 Great Island 4 Frequency Excursion Incident- 20/03/2019 ............................ 61 Figure 31: Dublin Bay 1 Frequency Excursion Incident 24/04/2019 .............................. 61 Figure 32: Whitegate 1 Frequency Excursion Incident- 08/05/2019 .............................. 62 Figure 33: Great Island 4 Frequency Excursion Incident- 20/05/2019 ........................... 62 Figure 34: Whitegate 1 Frequency Excursion Incident- 15/08/2019 .............................. 63 Transmission System Performance Report • 2019 Page 5
List of Tables

Table 1: Total Exported Energy 2018 & 2019 ................................................................ 10
Table 2: System Records 2018 & 2019 ......................................................................... 10
Table 3: New Capacity Executed Demand & Generation Connection Agreements ....... 16
Table 4: Demand & Generation Connections Energised in 2019 .................................. 17
Table 5: Customers Certified Operational in 2019 ......................................................... 18
Table 6: Transmission System Plant Availability 2019 .................................................. 25
Table 7: Transmission System Plant Unavailability Categories ..................................... 26
Table 8: Transmission System Plant Outage 2019 ........................................................ 30
Table 9: Voltage step change limits in operational timescales....................................... 51
Table 10: Frequency Excursions in 2019....................................................................... 53
Table 11: All Island Frequency Excursion Incidents ...................................................... 60
Table 12: All Island Fully Dispatchable Generation Plant .............................................. 64

 Transmission System Performance Report • 2019                                                       Page 6
1. Introduction
EirGrid and SONI, as Transmission System Operators (TSOs) for Ireland and
Northern Ireland respectively, are pleased to present the annual Transmission
System Performance Report for 2019. This report contains transmission system data
and performance statistics for the transmission system in Ireland and Northern
Ireland for the year 2019 (01 January 2019 – 31 December 2019).
EirGrid is required to publish an annual report on the performance of the TSO
business in accordance with Condition 18 of the Transmission System Operator
Licence granted to EirGrid by the Commission for Regulation of Utilities (CRU).
Similarly, SONI is required to produce an annual report on the performance of the
TSO business in accordance with Condition 20 of the Licence to participate in the
Transmission of Electricity granted to SONI Ltd by the Department for the Economy.
This report contains high-level transmission system characteristics and a detailed
breakdown of key figures along with an explanation of what these figures mean for
the all-island transmission system in the coming year and into the future. Through
comparison with previous reports, this report provides a useful resource through
which possible trends can be identified.
This report is structured as follows:
Section 3 outlines all-island system data, generation availability and outages,
Section 4 details the performance of the EirGrid TSO business during 2019
against the criteria approved by the CRU,
Section 5 details the performance of the SONI TSO business during 2019
against the criteria approved by The Utility Regulator in Northern Ireland.
Appendices which provide further detail on the data, results and methodology of
relevance are included at the end of this report.
Transmission System Performance Report • 2019 Page 72. Executive Summary
The annual Transmission System Performance Report for 2019 is a comprehensive
review of the transmission system through which EirGrid and SONI make available
key all-island system operating data from the previous year.
Key statistics detailed in this report include:
All-Island Generation Statistics
Transmission System Availability Statistics for Ireland and Northern Ireland
Details on System Events leading to System Minutes Lost
Details of All-Island System Frequency Events
2.1 Key Data
All-island
All-island peak demand reached 6,558 MW on 17 December 2019. The minimum
all-island demand was 2,542 MW and occurred on 30 June 2019.
The all-island installed capacity of conventional generation in 2019 was
8,376 MW.
In 2019 the system frequency was operated within 49.9 Hz and 50.1 Hz for
99.66% of the time.
There were no major incidents in 2019. A major incident is one which results in
the loss of greater than or equal to one system minute as a result of a single
system disturbance.
Ireland
In 2019 the availability of the East West Interconnector was 97.63%.
The weighted average availability of the Ireland transmission system in 2019 was
96.88%.
The System Minutes lost for 2019, attributable to EirGrid, was 0.176.
Northern Ireland
The availability of the Moyle Interconnector for 2019 was 97.68%.
The average availability of the Northern Ireland transmission system in 2019 was
96.63%.
The System Minutes lost for 2019, attributable to SONI, was 0.921
Transmission System Performance Report • 2019 Page 83. All-Island System Data
3.1 Overview of the All-Island Electricity System
The transmission system in Ireland and Northern Ireland provides the means to
transport energy from generators to demand centres across the island. The
transmission system is comprised of high-voltage overhead lines and cables that
connect power stations, interconnectors and substations. Transformers link different
voltage levels and provide a path for power to flow from higher to lower voltage
networks. The transmission system in Ireland is operated at 400 kV, 220 kV and
110 kV. The transmission system in Northern Ireland is operated at 275 kV and
110 kV.
The 400 kV, 275 kV and 220 kV networks form the backbone of the transmission
system. They have higher power carrying capacity and lower losses than the 110 kV
network.
The Ireland and Northern Ireland transmission systems are electrically connected by
means of one 275 kV double circuit. This connection is from Louth station in Co.
Louth (IE) to Tandragee station in Co. Armagh (NI).
There are also two 110 kV connections:
Letterkenny station in Co. Donegal (IE) to Strabane station in Co. Tyrone (NI)
Corraclassy station in Co. Cavan (IE) to Enniskillen station in Co. Fermanagh
(NI)
This section contains basic all-island transmission system data. Further information
can be found on the EirGrid Group website: www.eirgridgroup.com.
3.2 Total System Production
Total exported energy takes into account energy supplied by large-scale and some
small-scale generation1 as well as pumped storage units on the island. This does not
take into account interconnector imports and exports.
1
Small-scale generation that is modelled in our Energy Management System, typically ≥ 5 MW
Transmission System Performance Report • 2019 Page 9Table 1: Total Exported Energy 2018 & 2019
2018 2019
All-Island Total Exported Energy [GWh] 36,996 36,513
Ireland Total Exported Energy [GWh] 28,823 28,347
Northern Ireland Total Exported Energy [GWh] 8,173 8,167
3.3 System Records
Peak demand is a measure of the maximum demand on the transmission system
over a particular period (e.g. annual or seasonal) and is a key measurement for any
power system. The transmission system in Ireland and Northern Ireland is a winter
peaking system as a result of greater heating and lighting requirements during the
winter months. The all-island winter peak in 2019 was 6,558 MW and occurred at
17:27 on 17 December.
In summer, the reduced need for heating and lighting results in a lower demand for
electricity. The minimum demand is known as the ‘minimum summer night valley’
and in 2019 a minimum all-island demand of 2,542 MW was recorded at 05:30 on 30
June.
From the installed wind capacity, a peak all-island wind generation output of
4,038MW was achieved on 18 December. Table 2 provides a summary of the
system records for 2018 and 2019.
Table 2: System Records 2018 & 2019
2018 2019
Winter Peak Demand [MW] 6,508 6,558
Minimum Summer Night Valley [MW] 2,520 2,542
Maximum Wind Generation [MW] 3,990 4,038
3.4 Generation Capacity
Generating plant is connected to both the transmission and distribution systems. All
generation contributes to meeting system demand. The total generation capacity is
Transmission System Performance Report • 2019 Page 10calculated as the sum of all fully operational generator capacities connected to both
systems2.
The all-Island installed capacity of conventional generation in December 2019 was
8,376 MW (6,558 MW in Ireland and 1,818 MW in Northern Ireland). The capacity of
demand side units (DSUs) was 543 MW in Ireland and 99 MW in Northern Ireland,
with an average availability of 35.6%. There was also 87 MW of aggregated
generating units (AGUs) that contributed towards the capacity margin in Northern
Ireland. This does not include any import capacity from the Moyle Interconnector or
the East West Interconnector.
The all-island installed capacity of wind generation in 2019 was 5,388MW
(4,112 MW in Ireland and 1,276 MW in Northern Ireland).
Appendix 3 provides a list of the fully dispatchable generating units connected to the
power system.
3.5 Generation Availability
Generation Availability is a measure of the capability of a generator to deliver power
in a given period to the transmission system. In order for EirGrid and SONI to
operate a secure and reliable transmission system in an economic and efficient
manner, it is necessary for generators to maintain a high rate of availability.
Generation system availability is calculated on a daily and 365-day rolling average
basis3. Figure 1 shows the daily and 365-day rolling average availability for 2019.
2
Fully operational generator capacity is given by the Maximum Export Capacity (MEC) of the generator.
3
365-day rolling average is a capacity weighted average availability over the previous 365 days.
Transmission System Performance Report • 2019 Page 1190.00
2019 All-Island Generator Availability
85.00
80.00
% Availbility
75.00
70.00
65.00
60.00
Jan Feb Mar Apr May Jun Jul Aug Sep Oct Nov Dec
365 Day Rolling Availability % Daily Availability %
Figure 1: Generation System Availability 2019
The average daily generation system availability in 2019 was 77.29%.
The maximum daily generation system availability in 2019 was 87.69%.
The minimum daily generation system availability in 2019 was 64.09%.
3.6 Generation Forced Outage Rate
The generation forced outage rate (FOR) is calculated on a daily and rolling 365-day
average basis. The daily FOR is a capacity weighted percentage of the time during
the day that generation units are unavailable due to unforeseen/unplanned outages.
The 365-day rolling FOR is the average of the daily FOR over the previous 365 days.
The daily FOR and 365-day rolling FOR are shown in Figure 2.
Transmission System Performance Report • 2019 Page 1230.00
2019 All-Island Generator FOR
25.00
Unavailability %
20.00
15.00
10.00
5.00
0.00
Jan Feb Mar Apr May Jun Jul Aug Sep Oct Nov Dec
365 Rolling Forced % Daily FOR %
Figure 2: Generation System Forced Outage Rate 2019
The average daily generation system forced outage rate in 2019 was 14.15%.
The maximum daily generation system forced outage rate in 2019 was 28.49%.
The minimum daily generation system forced outage rate in 2019 was 7.40%.
3.7 Generation Scheduled Outage Rate
The generation scheduled outage rate (SOR) can be calculated on a daily and
rolling 365-day average basis. The daily SOR is a capacity weighted percentage of
the time during the day that generation units are unavailable due to planned outages.
The 365-day rolling SOR is the average of the weekly SOR over the previous 365
days. The daily SOR and 365-day rolling SOR are shown in Figure 3.
Transmission System Performance Report • 2019 Page 132019 All-Island Generator Scheduled
Outage Rates
25.00
20.00
Unavailability %
15.00
10.00
5.00
0.00
Jan Feb Mar Apr May Jun Jul Aug Sep Oct Nov Dec
365 Day Rolling Scheduled % Daily Scheduled Outage %
Figure 3: Generation System Scheduled Outage Rate 2019
The average daily generation system scheduled outage rate in 2019 was 7.32%.
The maximum daily generation system scheduled outage rate in 2019 was
20.05%.
The minimum daily generation system scheduled outage rate in 2019 was 1.25%.
Transmission System Performance Report • 2019 Page 144. EirGrid Transmission System
Performance
This section relates to the performance of EirGrid TSO and the transmission system
in Ireland only, unless explicitly stated otherwise. This data has been prepared by
EirGrid in accordance with the requirements of Part 5 of Condition 18 of its
Transmission System Operator Licence.
4.1 Summary
There were no major incidents in 2019. A major incident is one which results in the
loss of greater than or equal to one system minute as a result of a single system
disturbance.
The system minutes lost as a result of faults on the main system was 0.176 in 2019.
No system minutes were lost due to the disconnection of normal tariff load
customers during Under Frequency Load Shedding (UFLS) disturbances.
EirGrid have a target to operate the system frequency within the range 49.9 Hz to
50.1 Hz for 94% of the time. In 2019, the system frequency was within the agreed
limits 99.66% of the time.
4.2 Grid Development and Maintenance
This section provides an overview of grid development activities in 2019.
4.2.1 Completed Capital Projects
The following capital projects were completed in 2019:
Binbane-Letterkenny 110 kV Line - Tievebrack Loop-in;
Bellacorick - Moy 110 kV Line Uprate;
Great Island - Wexford 110 kV Line Uprate;
Oweninny Power 1 & 2 - Shallow Connection Works;
Transmission System Performance Report • 2019 Page 15 Midleton T101 transformer;
Booltiagh 110 kV Station Extension;
Glenree Shallow Works for DSO20(2);
Coomataggart 110 kV Shallow Works (Kilgarvan Wind Farm);
Clonee Phase 2 Extension;
Bandon 110 kV Station – Protection Works; and
Cloghran 110 kV Station - Replacement of No.2 HV Transformers.
4.2.2 New Connection Offers
Parties seeking a new connection to the transmission system must apply to EirGrid
for a connection offer. EirGrid operates within a regulatory approved process for
providing connection offers to generators and demand customers seeking direct
connection to the transmission system. The process for issuing generation offers
was consulted on in 2017 resulting in the Enduring Connection Policy (ECP) which
led to a significant increase in the number of new generation capacity offers issuing
in 2019. Applications for ECP-2 will open later in 2020.
In order to connect to the transmission system, all demand and generation
customers must execute a connection agreement with EirGrid. Table 3 summarises
the total number of new capacity connection agreements executed in 2019 and their
associated load or generation capacities. A connection offer which is accepted in
one year is unlikely to impact on connected generation capacity in the same year
given the lead times associated with construction.
Table 3: New Capacity Executed Demand & Generation Connection Agreements
Demand Generation Interconnector
Executed Connection Offer Agreements
5 4 1
in 2019 [No.]
Executed Connection Offer Agreements
392 MVA 173 MW 500 MW
in 2019 [Capacity]
In addition to issuing connection offers for new generation and demand capacity,
EirGrid facilitates existing contracted customers in modifying existing connection
agreements.
Transmission System Performance Report • 2019 Page 164.2.3 Connections Energised
When a connection agreement is executed for a new connection, it typically takes a
number of years before the demand or generation is connected to the transmission
system. This period includes project development, time taken to obtain consents and
to construct the connection.
When the transmission connection is energised, it then takes a number of months
for the generator to reach commercial operation. This period is generally much
shorter for demand customers.
Table 4 provides an overview of the number of new connections to the transmission
system commissioned in 2019.
Table 4: Demand & Generation Connections Energised in 2019
Conventional
Demand PPM4
Generation
Connections Energised in 2019 [No.] 0 0 15
Connections Energised in 2019
0 MVA 0 MW 466 MW
[Capacity]
4.2.4 Customers Certified Operational
Table 5 provides an overview of customers connected to the transmission system
who have been deemed fully operational. It shows customer connections which
have completed the testing phase and have received an operational certificate from
EirGrid. This includes generators connected to the distribution network. Note that
demand customers are not currently certified by EirGrid and are therefore not
included in the table.
Following energisation, the unit is required to complete Grid Code Compliance
testing, following which Operational Certificates5 are issued.
4
PPM: Power Park Modules
5
EirGrid issues Operational Certificate Justifications for distribution WFPS. These are the included in the figures
shown.
Transmission System Performance Report • 2019 Page 17Table 5: Customers Certified Operational in 2019
Total number of new units Total new capacity certified
certified operational in 2019 operational in 2019
WFPS 10 365 MW
Conventional 0 0 MW
DSU including existing with
40 44 MW
change in capacity
4.3 General System Performance
4.3.1 Under-Frequency Load Shedding
There were no UFLS disturbances in 2019 which resulted in shedding of normal
tariff load customers.
The relays to disconnect normal tariff customer load are only activated once the
system frequency drops to 48.85 Hz. The lowest system frequency in 2019 was
between 49.342 Hz.
Figure 4 provides a trend of the number of disturbances since 2004 that involved
operation of under-frequency relays to disconnect interruptible and normal tariff end-
users. No normal tariff customers have been disconnected due to an under-
frequency disturbance since 2014.
Figure 4: Under frequency disturbances 2004-2019
Figure 5 provides a trend of the lowest system frequency by year since 2004.
Transmission System Performance Report • 2019 Page 1849.6
49.4
System frequency, Hz 49.2
49.0
48.8
48.6
48.4
48.2
48.0
47.8
2004 2005 2006 2007 2008 2009 2010 2011 2012 2013 2014 2015 2016 2017 2018
Year
Lowest frequency
Figure 5: Lowest system frequency 2004-2019
4.3.2 Under-Voltage Load Shedding
There was no incident of Under-Voltage Load Shedding in 2019.
Transmission System Performance Report • 2019 Page 194.4 System Minutes Lost
This section provides information for system minutes lost (SML) attributable to the
transmission system operator.
System minutes lost is a measure of the energy not supplied for a disturbance. The
metric takes account of the load lost (MW), duration of disconnection (minutes) and
peak system demand (MW), to allow for historical comparison. For example, if
300 MW were lost for 10 minutes and the system peak was 3000 MW, this would
represent one system minute.
System minutes = (load x duration) / (system peak) = (300 x 10) / 3000 = 1
The total system minutes lost (SML) as a result of faults on the main system for
2019, attributable to EirGrid, was 0.176.
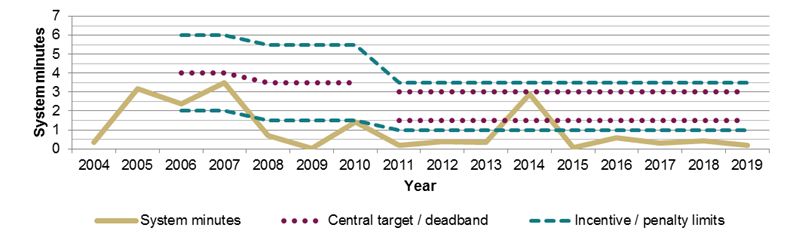
The trend of system minutes lost since 2004 is shown in Figure 6, with
incentive/penalty limits and deadbands as provided by the Commission for
Regulation of Utilities (CRU). The central target provided until 2010 was replaced in
2011 with a deadband between 1.5 and 3.0 SML, where there is neither penalty nor
incentive. One fifth of the incentive amount is awarded for every 0.1 SML below
1.5 SML, down to 1.0 SML. One fifth of the incentive amount is penalised for every
0.1 SML above 3.0 SML, up to 3.5 SML.
The mean number of system minutes lost per year since 2004 was 1.050.
Figure 6: System minutes lost and associated targets: EirGrid 2004-2019
Transmission System Performance Report • 2019 Page 204.5 Zone Clearance Ratio
This section provides details of the short circuit faults on the main system and
outside the main system for which main system protection is expected to operate
without delay.
Zone clearance ratio (ZCR) is defined as the ratio of the number of short circuit
faults, not cleared in zone 1 to the total number of short circuit faults per year
cleared by main system protection. See Appendix A for further definition of Zones
and ZCR.
Of the 55 short circuit faults in 2019, main system protection was expected to
operate without delay for 54 short circuit faults on the main system. . There were no
faults non-zone 1 clearances. The ZCR trend since 2004 is shown in Figure 7.
Figure 7: Zone clearance ratio: EirGrid 2004-2019
4.5.1 Frequency Control
In 2019 the system frequency was operated between 49.9 Hz to 50.1 Hz for 99.66%
of the time.
Transmission System Performance Report • 2019 Page 214.6 Summary of key disturbances 4.6.1 Loss of load In April, the Binbane-Cathaleen’s Fall 110 kV circuit tripped to clear a single phase to ground fault. The cause of the fault is unknown. An interruption to end-users occurred, resulting in 0.078041 system minutes lost. In May, the Kilteel 110 kV circuit breaker in Maynooth 220 kV station tripped and reclosed due to a flash over on a glass insulator string. An interruption to end-users occurred, resulting in 0.000018 system minutes lost. In June, the Kilpaddoge-Rathkeale 110 kV line tripped to clear a fault caused by lightning. An interruption to end-users occurred, resulting in 0.021246 system minutes lost. In September, the T141 transformer 110 kV circuit breaker in Letterkenny 110 kV station tripped due to a commissioning error. An interruption to end-users occurred, resulting in 0.073549 system minutes lost. In November, the Letterkenny-Tievebrack 110 kV line tripped due to lightning. Tievebrack 110 kV station was tail-fed at the time of the disturbance, resulting in the trip of the transformer T141. An interruption to end-users occurred, resulting in 0.002870 system minutes lost. 4.6.2 Under-Frequency Load Shedding There were no under frequency load shedding disturbances in 2019. 4.6.3 Storms Resulting in Trippings Between 10:33 and 18:43 hours on 8 December, there were 6 faults during the Storm Atiyah. The faults were caused by wind and lightning. All faults were single phase to ground on overhead lines; one at 400 kV and five at 110 kV. All faults were zone 1 clearances. Fault clearance times were between 49 ms and 89 ms. The disturbance resulted in the trip of 7.7 MW of wind generation. There were no supply interruptions as a result of the disturbance. Transmission System Performance Report • 2019 Page 22
Between 21:14 and 22:46 hours on 18 December, there were four faults on the
  110 kV system during Storm Elsa. All faults were caused by wind. An orange status
  weather warning was in place at the time of the faults. All faults were correctly
  cleared by the lines’ protection in less than 90 ms. Two circuits were automatically
  reclosed as expected and two circuits tripped, reclosed and tripped again.

Transmission System Performance Report • 2019                                    Page 23
4.7                         Transmission System Availability & Outages

  4.7.1 Transmission System Availability
  When considering transmission system availability, it is the convention to analyse it
  in terms of transmission system unavailability. The formula for calculating
  transmission system unavailability is given in Appendix 5. Figure 8 shows the
  percentage Transmission System Unavailability in each month for 2019.

                                      Transmission System Unavailability 2019
                        7.00
                        6.00
     % Unavailability

                        5.00
                        4.00
                        3.00
                        2.00
                        1.00
                        0.00
                                Jan    Feb   Mar   Apr   May   Jun   Jul   Aug   Sep    Oct   Nov   Dec
                                                                 Month

                               Figure 8: Monthly Variations of System Unavailability 2019

  4.7.2 Transmission Plant Availability
  The measure of plant availability is the kilometre-day for feeders and the MVA-day
  for transformers. The availability figures vary between the different categories of
  plant. The formulae for calculating transmission plant availability are provided in
  Appendix 1.

  Table 6 provides a detailed breakdown of all plant availability figures for 2019.

Transmission System Performance Report • 2019                                                  Page 24
Table 6: Transmission System Plant Availability 2019
Number of
Plant Type Circuit Length [km] Availability (%) 2019
Outages
110 kV Circuits 4,528 326 97.11
220 kV Circuits 1,927 76 97.30
275 kV Circuits 97 1 96.65
400 kV Circuits 439 11 95.53
Transformer Capacity Number of
Plant Type Availability (%) 2019
[MVA] Outages
220 / 110 kV 11,089 91 97.84
Transformers
275 / 220 kV 1,200 6 91.40
Transformers
400 / 220 kV 4,050 18 83.21
Transformers
6,991 km Weighted Average (%)
Total 529
16,339 MVA 96.88
Transmission System Performance Report • 2019 Page 254.7.3 Cause of Transmission Plant Unavailability
Transmission plant unavailability is classified into the categories outlined in Table 7.
Table 7: Transmission System Plant Unavailability Categories
Category Description
Refers to unplanned outages. An item of plant trips or is urgently removed
from service.
Usually caused by imminent plant failure. There are three types of forced
outage:
Forced & Fault
A) Fault & Reclose
B) Fault & Forced
C) Forced (No Tripping)
The above forced outages are explained in detail in Section 6.6.
Safety: Refers to transmission plant outages which are necessary to allow for
the safe operation of work to be carried out.
Safety &
System System Security: Refers to outages which are necessary to avoid the
Security possibility of cascade tripping or voltage collapse as a result of a single
contingency. When a line is out for maintenance it may be necessary to take
out additional lines for this reason.
New Works An outage to install new equipment or uprate existing circuits.
Corrective Maintenance: Is carried out to repair damaged plant. Repairs are
not as urgent as in the case of a forced outage.
Corrective &
Preventative
Preventative Maintenance: Is carried out in order to prevent equipment
Maintenance
degradation which could lead to plant being forced out over time. Includes line
inspections, tests and routine replacements.
A number of other reasons may be attributed to plant unavailability, such as
Other Reasons
testing, protection testing and third party work.
4.7.4 110 kV Circuit Unavailability
Figure 9 provides a breakdown of the causes of unavailability on the 110 kV network
in 2019.
The largest contributor to unavailability (52%) on the 110 kV network was
attributable to the "New Works" category. This category is for outages to install new
equipment or uprate existing circuits.
A further 40% of unavailability on the 110 kV network in 2019 were outages for the
purpose of corrective and preventive maintenance. This type of maintenance
includes, amongst others, ordinary services, condition assessments, wood-pole
replacement/straightening and general line maintenance.
Transmission System Performance Report • 2019 Page 26Only 4% of unavailability was due to forced outages.
Causes of 110 kV Circuit Unavailability
1% 4% 3%
40% Corrective and Preventive
New Works
Safety and Security
52%
Forced and Fault
Others
Figure 9: Causes of Unavailability on the 110 kV System in 2019
4.7.5 220 kV Circuit Unavailability
Figure 10 provides a breakdown of the causes of unavailability on the 220 kV
network in 2019.
The largest contributor to unavailability (43%) on the 220 kV network in 2019 were
outages for the purpose of "New Works".
Approximately 12% of unavailability on the 220 kV network was attributable to
Forced and Fault.
Transmission System Performance Report • 2019 Page 27Causes of 220 kV Circuit Unavailability
3%
4% 12%
38%
Corrective and Preventive
New Works
Safety and Security
43% Forced and Fault
Others
Figure 10: Causes of Unavailability on the 220 kV System in 2019
4.7.6 275 kV Circuit Unavailability
The 275 kV tie-line consists of 48.5 km of 275 kV double-circuit between Louth
station and Tandragee station which is situated in County Armagh. In 2019 there
was only one outage of 275 kV tie-lines, with Louth-Tandragee 2 (TWO) on outage
for 24 days.
4.7.7 400 kV Circuit Unavailability
Figure 11 provides a breakdown of the causes of unavailability on the 400 kV
network in 2019.
The largest contributor to unavailability (89%) on the 400 kV network in 2019 was
corrective and preventive maintainance works.
The major corrective and preventive contribution was the outage of the Moneypoint
– Oldstreet 400 kV circuit which lasted approximately 29 days while the majority of
the other outages lasted less than a week.
Transmission System Performance Report • 2019 Page 28Causes of 400 kV Circuit Unavailability
10%
0% 1%
0%
Corrective and Preventive
New Works
Safety and Security
Forced and Fault
Others
89%
Figure 11: Causes of Unavailability on the 400kV System in 2019
Transmission System Performance Report • 2019 Page 29Table 8 provides a breakdown of the transmission system outages that occurred in
2019 by plant type.
Table 8: Transmission System Plant Outage 2019
Plant No. Circuit Forced & Safety & New Corrective & Other Total No.
Type of Length Fault System Works Preventive of
Items Security Maintenance Outages
110 kV 232 4,528 29 9 30 230 28 326
Circuits
220 kV 63 1,927 12 8 11 35 10 76
Circuits
275 kV 2 97 0 0 0 1 0 1
Circuits
400 kV 4 439 2 0 0 6 3 11
Circuits
Total 301 6,991 43 17 41 272 41 414
Plant No. Transfor Forced & Safety & New Corrective & Other Total No.
Type of mer Fault System Works Preventive of
Items Capacity Security Maintenance Outages
220 / 55 11,089 17 5 5 52 12 91
110 kV
Trafos
275 / 3 1,200 0 0 0 3 3 6
220 kV
Trafos
400 / 8 4,050 5 0 1 9 3 18
220 kV
Trafos
Total 66 16,339 22 5 6 64 18 115
Transmission System Performance Report • 2019 Page 304.7.8. East West Interconnector
The East West Interconnector (EWIC) is a high-voltage direct current (HVDC)
scheme which links the power systems of Ireland and Great Britain. It has a power
rating of 500 MW. EWIC is a fully regulated interconnector which was developed
and is owned by EirGrid Interconnector DAC (EIDAC) which is part of the EirGrid
Group. The scheme consists of two Converter Stations located in Meath, Ireland and
Deeside, Wales connected by 264 km HV cable, 185 km of which is submarine.
4.7.9. East West Interconnector Unavailability
In 2019 the availability of the East West Interconnector (EWIC) was 97.63%.
Outages contributing to EWIC unavailability mostly included maintenance works.
4.7.10 Transmission Outage Duration
The duration of transmission outages is useful for assessing transmission system
performance. Transmission outages are broken into eight time classifications
ranging from less than 10 minutes to greater than four weeks. The total number of
outages in each time classification is shown in Figure 12.
350
300
250
Number of Outages
200
150
100
50
0The majority of the outage durations are concentrated between one day and 2
weeks with the peak occuring between one day and 1 week In the category of one
hour to one day, outages can be arranged to avoid peak load times and thereby
reduce the impact on the system, while one week outages for annual maintenance
are commonplace during the outage season.
4.7.11 Timing of Transmission Outages
Transmission outages are scheduled, where possible, during periods of low load in
the summertime (however, this can be limited by a number of factors such as
personnel availability and shortage of hydro-power support in some areas). The
seasonal nature of transmission outages is apparent in Figure 13 below.
Figure 13 shows the percentage unavailability of the transmission system in each
month. The March-November period (known as the outage season) sees the highest
rates of unavailability during the year, when decreased system load is taken
advantage of to carry out extensive maintenance outages. Figure 14 shows the
average duration in days of the transmission outages in each month in 2019.
Transmission System Unavailability
8.00
7.00
% Unavailability
6.00
5.00
4.00
3.00
2.00
1.00
0.00
Jan Feb Mar Apr May Jun Jul Aug Sep Oct Nov Dec
Month
2019 2018
Figure 13: Percentage unavailability in each month of 2018 & 2019
Transmission System Performance Report • 2019 Page 32Transmission System Unavailability
12.00
Average Duration (Days)
10.00
8.00
6.00
4.00
2.00
0.00
Jan Feb Mar Apr May Jun Jul Aug Sep Oct Nov Dec
Month
2019 2018
Figure 14: Average duration of outages 2018 & 2019
4.7.12 Forced Outages
There are two main outage classifications, voluntary outages and forced outages.
The majority of outages are voluntary outages that are scheduled by EirGrid. Forced
outages are not scheduled and cause the most disruption to the transmission
system. Due to their disruptive nature, forced outages merit further analysis.
4.7.13 Forced Outages per km
The measure used for analysing the forced outages of lines and cables is the
number of forced outages per kilometre of feeder, and is shown in Figure 15.
Transmission System Performance Report • 2019 Page 330.007
Forced Outages per km 0.006
0.005
0.004
0.003
0.002
0.001
0
110kV Feeders 220kV Feeders 400kV Feeders
Figure 15: Forced Outages of lines and cables per km in 2019
Transmission System Performance Report • 2019 Page 344.7.14 Forced Outages per MVA
The measure used for analysing the forced outages of transformers is the number of
forced outages per MVA capacity, which can be seen in Figure 16.
A major outage in 2019 was the forced outage of the Moneypoint T4201 400/220 kV
transformer which forced out from the end of January and remained out for the
remainder of 2019.
Figure 16: Forced Outage per MVA in 2019
Transmission System Performance Report • 2019 Page 355. SONI Transmission System Performance This section details the performance of the transmission system in Northern Ireland, unless explicitly stated otherwise. This data has been prepared by SONI in accordance with Condition 20 of the ‘Licence to participate in the Transmission of Electricity’. 5.1 Summary SONI is responsible for the safe, secure, efficient and reliable operation of the Northern Ireland transmission network. The transmission network is operated at 275 kV and 110 kV and is made up of approximately 150 circuits covering a total length of approximately 2,130 km. The primary purpose of the transmission system is to transport power from generators and interconnectors to bulk supply points which connect the transmission system to the distribution system. Availability is a key measure of power system performance. In this report availability refers to the proportion of time a transmission circuit or interconnector was available. The annual system availability for 2019 was 96.39%. The annual availability of the Moyle Interconnector for 2019 was 97.68%. This is the highest availability on the Moyle interconnector since its connection to the system in 2002. The North-South 275 kV tie line, connecting Louth in Ireland and Tandragee in Northern Ireland, had an availability of 83.88% in 2019. The annual availability of the Strabane – Letterkenny and Enniskillen – Corraclassy 110 kV tie lines was 100% and 68% respectively in 2019. The Electricity Safety, Quality and Continuity Regulations (Northern Ireland) 2012 set out the statutory obligations in relation to managing both frequency and voltage for Northern Ireland. Under the regulation SONI is required to report incidents which have caused interruptions to supplies to customers to the transmission asset owner, Transmission System Performance Report • 2019 Page 36
NIE Networks. Part 8, paragraph 33 of the regulation contains details of the
requirements for the reporting of incidents.
In 2019, there were two transmission incidents leading to customers being off supply.
This was;
On the 11th of March at 01:36, an incident at Donegall substation resulted in the
loss of supply to 12,600 customers, equating to a total loss of 6.5 MW. The total
system minutes lost for this event was 0.019 minutes
On the 20th of March at 21:33, an incident at Rathgael substation resulted in the
loss of supply to 41,995 customers, equating to a total loss of 32 MW. The total
system minutes lost for this event was 0.902 minutes.
Quality of service is measured by the number of voltage and frequency excursions
which fall outside statutory limits. There were no voltage excursions in 2019 outside
the statutory limits.
The nominal frequency of the all-island transmission system is 50 Hz, and is
normally controlled within the range of 49.95 Hz and 50.05 Hz. SONI is required to
report on system faults where the frequency drops below 49.8 Hz or above 50.2 Hz.
In 2019, there were 30 system events where the frequency exceeded these limits.
The reporting of frequency excursions is carried out in accordance with the
definitions and principles of the National Fault and Interruption Reporting Scheme
(NAFIRS), (Engineering Recommendation G43/2). The effects of national / regional
emergencies and disputes are excluded.
5.2 Transmission System Availability
5.2.1 System Availability
Transmission system availability is the proportion of time a transmission circuit was
available during the calendar year. A circuit is defined as the overhead line, cable,
transformer or any combination of these that connects two busbars together or
connects the transmission system to another system. Transmission system
availability is reduced when a circuit is taken out of service, either for planned or
unplanned purposes.
Transmission System Performance Report • 2019 Page 37Planned outages are necessary to facilitate new user connections, network
development and maintenance of network assets necessary to deliver acceptable
levels of system security and reliability. These are outages planned with at least
seven days’ notice.
Unplanned outages can be a result of equipment failure or a fault caused by adverse
weather etc. These are outages required immediately or planned with less than
seven days’ notice.
System Availability is calculated using the formula:
∑ Hours each circuit is available
Sytem Availability (%) =
(No. of Circuits) ∗ (Total No. Hours in Period)
In 2019, the analysis of the transmission system availability data has produced the
following results:
The average availability of the Northern Ireland transmission system was in 2019
was 96.39%; and
The average winter system availability (for the winter months January, February,
November and December 2019) was 98.02%.
Transmission System Performance Report • 2019 Page 38Figure 17 below shows the month by month variation in Transmission System Availability in
Northern Ireland.
System Availability 2019
100.00
99.00
% Availability
98.00
97.00
96.00
95.00
94.00
93.00
92.00
91.00
90.00
Jan Feb Mar Apr May Jun Jul Aug Sep Oct Nov Dec
Month
Figure 17: Transmission System Availability 2019
Overall, the availability of the system is high, particularly over the winter months,
such as January and December, where maintenance is avoided due to the higher
electrical demand and potential adverse weather conditions. The preference is for
maintenance to take place over the summer months when network loading is
generally lower to mitigate the risk of affecting the supply to customers.
5.2.2 System Unavailability
Figure 18 below shows the month by month variation in planned and unplanned
system unavailability.
Transmission System Performance Report • 2019 Page 39You can also read