A Numerical Assessment on the Influences of Material Toughness on the Crashworthiness of a Composite Fuselage Barrel - MDPI
←
→
Page content transcription
If your browser does not render page correctly, please read the page content below
applied
           sciences
Article
A Numerical Assessment on the Influences of
Material Toughness on the Crashworthiness of a
Composite Fuselage Barrel
A. Riccio 1, * , S. Saputo 1 , A. Sellitto 1         and F. Di Caprio 2
 1    Department of Engineering, Università degli studi della Campania “Luigi Vanvitelli”, via Roma 29,
      81031 Aversa (CE), Italy; salvatore.saputo@unicampania.it (S.S.); andrea.sellitto@unicampania.it (A.S.)
 2    C.I.R.A. Italian Aerospace Reserach Center, via Maiorise, 81043 Capua (CE), Italy; f.dicaprio@cira.it
 *    Correspondence: aniello.riccio@unicampania.it; Tel.: +39-0815010407

 Received: 13 February 2020; Accepted: 13 March 2020; Published: 16 March 2020

 Abstract: In the present work, a numerical study on the dynamic response of a composite fuselage
 barrel, in relation to crashworthiness, has been investigated. The aim of this work is to investigate the
 influence of the material fracture toughness on the capability of a composite fuselage barrel to tolerate
 an impact on a rigid surface. Three different material configurations with different intra-laminar
 fracture energy values were considered to take into account variations in material toughness. Indeed,
 the dynamic behaviour of the analysed fuselage barrel has been numerically simulated by means of
 the FE (Finite Element) code Abaqus/Explicit. The effects of intralaminar fracture energy variations
 on the impact deformation of the barrel has been evaluated comparing the numerical results in terms
 of displacements and damage evolution for the three analysed material configurations.

 Keywords: crashworthiness; finite element analysis (FEA); composites; progressive failure
 analysis (PFA)

1. Introduction
      In recent years, several steps forward in increasing civil aircraft safety levels have been taken in
relation to crashworthiness during an emergency landing. In this context, crashworthiness has become
of fundamental relevance for the design and certification of an aircraft. The main aim in designing
crashworthy aircrafts is to ensure the ability to absorb as much energy, deformations and breakage as
possible during an impact event, without compromising the occupants’ safety. Hence, the structure,
under deformations and/or breakage conditions, must preserve the living space of passengers and
crew, allowing escape routes from the aircraft [1]. Indeed, the entire structure should be able to
guarantee the transfer to passengers of acceleration which can be tolerated by the human body [2–5].
In the past, the assessment of the crashworthiness performance of aircrafts was verified exclusively by
several costly full scale experimental testing campaigns, as in the case of the Airbus A320 [6,7], Boing
707 [8–10], Boing 737 [11,12] and NAMC YS [13,14]. According to the literature, the experimental
drop tests have allowed to identify the structural components which are generally involved in the
absorption of energy during an impact event: circumferential frames close to the vertical supports and
fasteners where large structural deformations occurred [15,16].
      Nowadays, the use of advanced numerical tools can contribute to reduce the number of expensive
experimental testing campaigns. Numerical developments focused on crash simulations of civil aircraft
fuselages. Due to the crash phenomenon and fuselage structure’s inherent complexity, numerical
models with increasing levels of accuracy were progressively introduced by several authors. Basic
models, using concentrated masses positioned at different locations and beams were used to start

Appl. Sci. 2020, 10, 2019; doi:10.3390/app10062019                                  www.mdpi.com/journal/applsci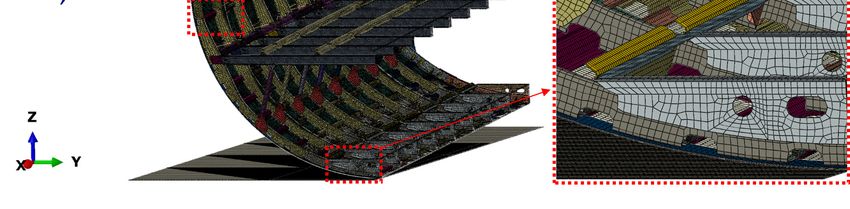
Appl. Sci. 2020, 10, 2019                                                                            2 of 15

exploring the mechanical response of a fuselage during a crash phenomenon. Subsequently, models
with non-linear springs and concentrated masses were introduced [17,18].
     Today, the use of finite element simulations with explicit methodologies allows to mimic, with
good accuracy, the evolution of the crash phenomenon of a fuselage during a fall, allowing to identify
both the damages and their development [19–23].
     The high complexity of the phenomenon under examination is amplified by the complexity of
the modern aircrafts. In particular, the huge size of the fuselage structure, the number of different
sub-components characterised by several sources of non-linearity (geometry, materials, contacts, etc.)
make the validation of numerical models very complicated.
     In addition to all these conditions, new aircraft generations are characterised by a further source of
complexity represented by the use of fibre-reinforced composite materials. Composite fibre-reinforced
material, by their nature, are subjected to intra-laminar and inter-laminar damages, which are not
easily numerically analysed [24].
     The use of fibre-reinforced composite materials, even with the intrinsic advantages in terms of
weight-performing ratio, is source of further complexities in terms of components crash behaviour.
Indeed, the absence of a material plastic phase [25] and the presence of different interacting mechanisms,
such as fibre and/or matrix breakage, delamination and fibre matrix de-bonding, for absorbing impact
energy [26–28] makes the crash behaviour even more complex with respect to conventional metallic
materials. Furthermore, a crash events response is a highly geometrical and materially nonlinear
event [29]. Hence the crash behaviour of a complex composite structure is strongly influenced by the
failure characteristics and strength of its material system. Consequently, the use of effective theories
for the prediction for the onset and evolution of the damage becomes mandatory to understand and
describe the complex mechanism of breakages in composite materials during a crash event.
     In the literature, several theories are proposed to accurately describe the failure mechanisms for
laminated aeronautical structures [30–36]. The theory of continuum damage mechanics (CDM) is
mainly adopted for the assessment of intralaminar damages. According to this theory, the stiffness
reduction can be physically compared to the presence of distributed micro-fractures or defects.
The presence of micro damage, phenomenologically, can be represented by a variation of internal state
variables of the material. Alternative methodologies for the simulation of degradation of the material
properties (MPDM) based on a thermo-dynamic model can be found in [37–40]. These methodologies
demonstrated to be very effective in conjunction with finite element modelling.
     In general, the intra-laminar damages evolution in composite materials and then in complex
composite structures is strictly influenced by fracture toughness for the four fracture modes (matrix
and tensile and compressive fibre). Moreover, the experimental determination of these fracture
toughness-related parameters is rather complex [41–43].
     The purpose of this paper is to numerically evaluate the influence of these fracture
toughness-related parameters on the mechanical behaviour of a composite fuselage section during a
crash event. The Abaqus/Explicit platform has been adopted to perform the numerical simulations
of the mechanical behaviour of the fuselage barrel subjected to a crash event on a rigid ground.
The structural subcomponents of the fuselage were detailed discretised by adopting finite elements with
a three-dimensional formulation. Three different configurations with material systems characterised
by different in-plane fracture toughness values were analysed and compared to each other to assess
the effects on the energy absorption capabilities of the structures and on the consequent deformations
and stresses distributions.
     In Section 2, the theoretical background is introduced, while in Section 3, the description of
the adopted finite element model is provided. In Section 4, the numerical results obtained from the
different analysed configurations are introduced and discussed.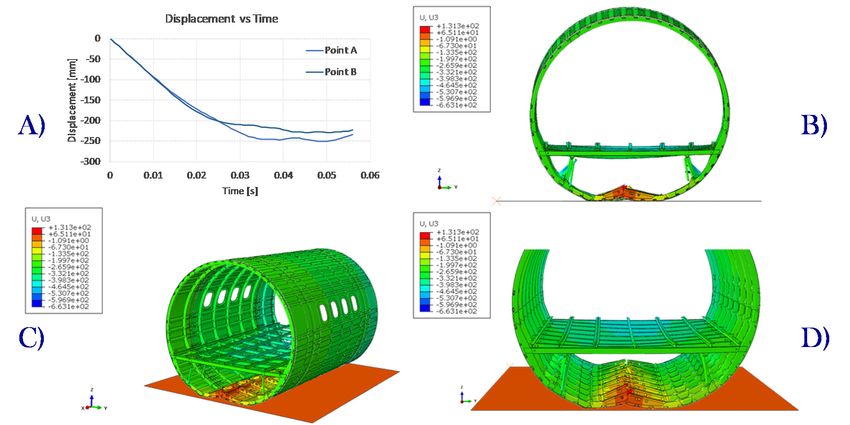
Appl. Sci. 2020, 10, 2019 3 of 15
2. Theoretical Background: Material Damage Model
Among several criteria for the prediction of the initiation and evolution of intra-laminar damage
Appl. Sci. 2020, 10, made
for structures x FOR PEER REVIEW
of unidirectional
fibre-reinforced composite materials, the Hashin criteria 3 ofare
16
probably the most adopted ones. These criteria, based on the separation of the failure modes by
probably theseparated
introducing most adopted ones.allow
equations, Thesetocriteria,
clearly based
identify onthe
thedamage
separation ofmatrix
of the the failure
and ofmodes
the fibre by
introducing separated equations, allow to clearly identify the damage of the matrix and
under tension or compression stress conditions. Indeed, according to Hashin failure criteria [44], of the fibre
under tension(1)–(4),
in Equations or compression
the limit stress
valuesconditions.
for the onsetIndeed, according
of the damage toforHashin failure
the fibre criteria
traction (Fft[44],
), fibrein
Equations (1–4), the limit values for the onset of the damage for the fibre traction
compression (Ffc ), matrix traction (Fmt ) and matrix compression (Fmc ) are, respectively, introduced.(F ft), fibre
compression (Ffc), matrix traction (Fmt) and matrix compression (Fmc) are, respectively, introduced.
!2 !2
σ11 σ12
Fft = + =1 (1)
XT SL
̑ ̑
= + =1 !2 (1)
σ11
Ffc = =1 (2)
̑ XC
= =1 (2)
!2 !2
̑ ̑ σ22 σ12
= + mt = 1
F = + =1 (3) (3)
YT SL
̑ ̑ # ̑
= +σ 2 − 1C ⋅2 + σ22 = 1σ12 2
! " !
Y (4)
Fmc = 22 + −1 · + =1 (4)
2ST 2ST YC SL
In Equations (1)–(4)
In Equations (1–4) σ , , σ , , σ are the components of the effective stress tensor, respectively,
11 22 12 are the components of the effective stress tensor, respectively,
along fibre direction, matrix direction and
along fibre direction, matrix direction and shear shearwhile
whileXXT,,XXC,, Y
YT,, Y
YC,, SSL and ST are, respectively, the
T C T C L and ST are, respectively, the
fibre tensile, fibre compressive, matrix tensile, matrix compressive
fibre tensile, fibre compressive, matrix tensile, matrix compressive and shear strengths and shearinstrengths in
longitudinal
longitudinal
and transversal and transversal
directions. Thedirections.
evolution of The
theevolution
damage forofeach
the failure
damage for is
mode each failureaccording
modelled mode is
modelled according to the bilinear law schematically
to the bilinear law schematically represented in Figure 1. represented in Figure 1.
A
B
Kd (1-di )Kd
C
0
Figure 1.
Figure Constitutive relation
1. Constitutive relation (damage
(damage onset
onset and
and evolution).
evolution).
According to Figure 1, it is possible to identify the onset and evolution damage phases for each
According to Figure 1, it is possible to identify the onset and evolution damage phases for each
damage mode. In particular, point A of Figure 1 identifies the condition of Hashin’s criterion satisfaction.
damage mode. In particular, point A of Figure 1 identifies the condition of Hashin’s criterion
At this condition, the element has absorbed an amount of energy represented by the yellow
satisfaction.
triangle area. Beyond this condition, the evolution of the damage and the corresponding loss of stiffness
At this condition, the element has absorbed an amount of energy represented by the yellow
of the material is simulated by introducing a parameter allowing to reduce linearly the characteristics of
triangle area. Beyond this condition, the evolution of the damage and the corresponding loss of
the undamaged material. The phase of the damage evolution is represented by the segment in Figure 1
stiffness of the material is simulated by introducing a parameter allowing to reduce linearly the
connecting point A to point C representing the completely damaged element condition. Actually,
characteristics of the undamaged material. The phase of the damage evolution is represented by the
the element is considered completely damaged when it has absorbed an energy represented by the
segment in Figure 1 connecting point A to point C representing the completely damaged element
sum of the yellow and blue triangles areas. Indeed, this global area is representative of the fracture
condition. Actually, the element is considered completely damaged when it has absorbed an energy
toughness of simulated material system.
represented by the sum of the yellow and blue triangles areas. Indeed, this global area is
representative of the fracture toughness of simulated material system.
In order to evaluate the degradation status of the element, a material degradation coefficient di
is introduced which is evaluated independently for matrix and fibre under traction and compression
conditions. The degradation coefficient di definition is introduced in Equation (5).
, , ,
= ; , ≤ , ≤ , ; ∈ , , , (5)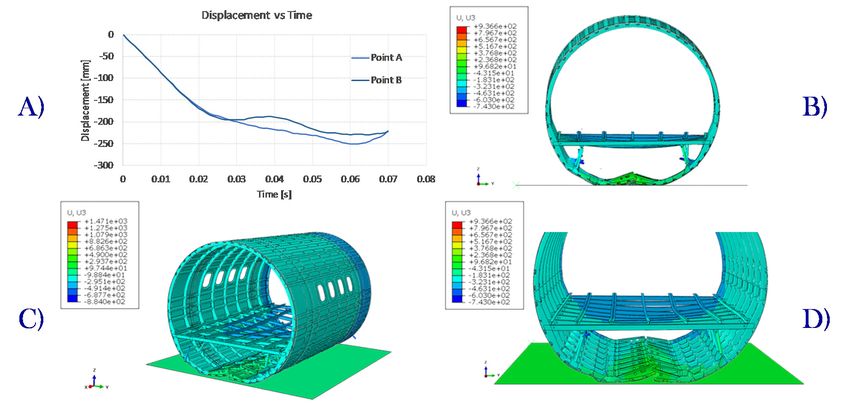
Appl. Sci. 2020, 10, 2019                                                                                                     4 of 15

     In order to evaluate the degradation status of the element, a material degradation coefficient di is
introduced which is evaluated independently for matrix and fibre under traction and compression
conditions. The degradation coefficient di definition is introduced in Equation (5).

                                 δti,eq δi,eq − δ0i,eq
                            di =                      ;       δ0i,eq ≤ δi,eq ≤ δti,eq ;   i ∈ ( f c , f t , mc , mt )          (5)
                                 δi,eq δti,eq − δ0i,eq

where δi,eq is equivalent displacement; δ0i,eq is equivalent displacement on set damage; δti,eq is equivalent
displacement on full damage (Point C in Figure 1). Moreover, fc , ft , mc , mt are fibre failure compression,
fibre failure tension, matrix failure compression and matrix failure tension.
     In Equation (6), the definition of the maximum equivalent displacement, reached at point C of
Figure 1, is introduced.
                                                           2Gc
                                                   δti,eq = 0                                             (6)
                                                           σi,eq

     In Equation (6), σ0i,eq and δ0i,eq are, respectively, the equivalent stress and displacement at the
Hashin’s limit condition (point A), and Gc is the material fracture toughness, i.e., the area of the global
triangle in Figure 1. In Table 1, the relations adopted to evaluate the equivalent stress and displacement
are introduced.

                                  Table 1. Equivalent stress and displacement definitions.

                 Load Condition                         Equivalent Stress                         Equivalent Displacement
                                                                                                        q
                                                            Lc (h σ11 ihε11 i+σ12 ·ε12 )
                  Fibre Tension                                                                       Lc hε11 i2 + ε212
                                                                        δ f t,eq
                                                                 Lc h−σ11 ih−ε11 i                            Lc h−ε11 i
               Fibre Compression                                      δ f c,eq
                                                                                                            q
                                                            Lc (h σ22 ihε22 i+σ12 ·ε12 )
                 Matrix Tension                                                                           Lc hε22 i2 + ε212
                                                                        δmt,eq
                                                       Lc (h −σ22 ih−ε22 i+σ12 ·ε12 )
                                                                                                            q
              Matrix Compression                                    δmc,eq                               Lc h−ε22 i2 + ε212

    In Table 1, LC and < > are, respectively, the element characteristic length and the Macauley bracket
operator [45].

3. Fuselage Barrel Test Case: Geometrical Description and Finite Element Model
      As already mentioned, in this paper, a composite fuselage barrel has been adopted as a numerical
test case to assess the influence of the fracture toughness characteristics on the mechanical behaviour
of a composite structure undergoing a crash event. In this paragraph, the numerical test case is
introduced by providing details on the geometry, materials, boundary conditions and on the finite
element discretisation.

3.1. Geometrical Description
     The geometry of the fuselage section adopted as a test case for the impact numerical analyses is
shown in Figure 2. The considered fuselage barrel does not take into account geometric variations
related to the tail plane, nose and wing attachments. This assumption has allowed to neglect the
stress concentration effects at a global level while stress concentration effects were considered at
sub-components level.
     The fuselage is composed of different structural sub-components (shown with different colours in
Figure 2). The overall dimensions of the fuselage section are reported in Figure 2, together with an
indication on the impact angle between the fuselage and the impacted rigid plane, which has been set
to 3 degrees.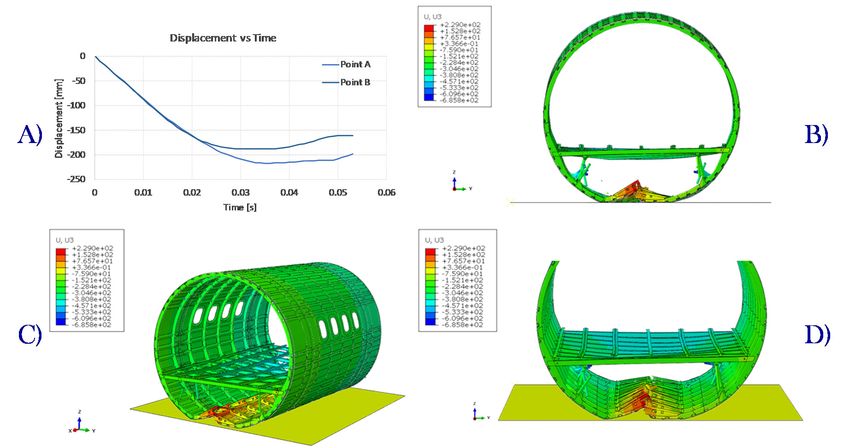
Appl. Sci. 2020, 10, 2019 5 of 15
Appl.
Appl. Sci. Sci.
2020,2020,
10, x10,
FORx FOR PEER
PEER REVIEW
REVIEW 5 of 516of 16
FigureFigure
Figure 2. Fuselage
2. Fuselage
2. Fuselage sectionsection
section components.
components.
components. (A): A: Frontal
A:Frontal
Frontal view.
view.
view. B: Lateral
B: Lateral
(B): Lateral view.
view.
view. C: C:Isometric
Isometric
Isometric
(C): view.
view.
view.
3.2.3.2.
3.2. Material
Material
Material System
System
System
Figure
Figure
Figure 3 allows
33 allows
allows to to highlight
to highlight
highlight thethe
the material
material
material systems
systems
systems adopted
adopted
adopted for for
for thethe
the different
different
different subcomponents
subcomponents
subcomponents of of
of
the the fuselage.
fuselage. Three
Three different
different material
material systems
systems werewere adopted:
adopted: namely
namely a a fibre-reinforced
fibre-reinforced
the fuselage. Three different material systems were adopted: namely a fibre-reinforced composite composite
composite
material
material
material system
system
system with
withwith
longlong
long unidirectional
unidirectional
unidirectional fibres
fibres
fibres (UNIDIRECTIONAL
(UNIDIRECTIONAL
(UNIDIRECTIONAL UD),
UD),UD), a woven
aa woven
woven fabric
fabric
fabric material
material
material
system
system and AL2025 aluminium. The related material mechanical properties
system and AL2025 aluminium. The related material mechanical properties are introduced in the
and AL2025 aluminium. The related material mechanical properties are are introduced
introduced in in the
the
following
following
following Tables
Tables
Tables 2–4.2-3-4.
2-3-4.
Figure 3. Material
Figure components.
3. Material components.
Figure 3. Material components.
Table
Table 2. UNIDIRECTIONAL
2. UNIDIRECTIONAL (UD)
(UD) material
material system
system properties.
properties.
Fibre
Fibre composite
composite material
material
Young’s
Young’s Modulus,
Modulus, E11 E11 [MPa]
[MPa] 137500
137500
Young’s
Young’s Modulus,
Modulus, E22 E22 [MPa]
[MPa] 8200
8200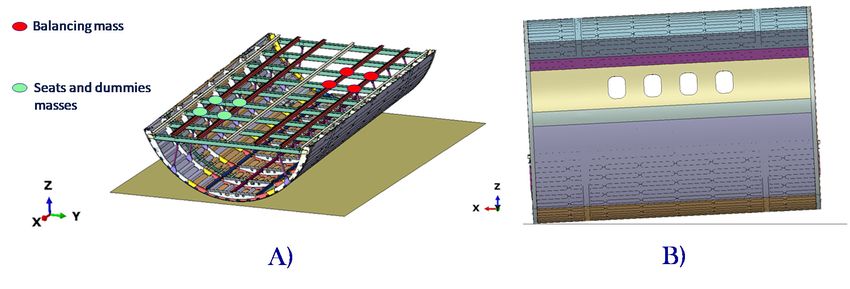
Appl. Sci. 2020, 10, 2019                                                                       6 of 15

                            Table 2. UNIDIRECTIONAL (UD) material system properties.

                                             Fibre Composite Material
                                   Young’s Modulus, E11 [MPa]               137,500
                                   Young’s Modulus, E22 [MPa]                8200
                                    Shear Modulus, G12 [MPa]                 3950
                                    Shear Modulus, G13 [MPa]                 3950
                                    Shear Modulus, G23 [MPa]                 3950
                                  Poisson’s Ratio, ν12 = ν13 = ν23           0.35
                                 Fibre Tensile Strength F1t [MPa]            1890
                              Fibre Compressive Strength F1c [MPa]           1008
                                 Matrix Tensile Strength F2t [MPa]           86.5
                              Matrix Compressive Strength F2c [MPa]           112
                                In-Plane Shear Strength, S12 [MPa]             95
                               Out-Plane Shear Strength, S23 [MPa]            100
                                        Density [ton/mm3 ]                  1.9 e−9
                                       Ply Thickness [mm]                    0.129

                                 Table 3. Woven fabric material system properties.

                                               Woven Fabric Material
                                   Young’s Modulus, E11 [MPa]                55,000
                                   Young’s Modulus, E22 [MPa]                55,000
                                    Shear Modulus, G12 [MPa]                  3363
                                    Shear Modulus, G13 [MPa]                  3363
                                    Shear Modulus, G23 [MPa]                  3363
                                  Poisson’s Ratio, ν12 = ν13 = ν23            0.30
                                 Fibre Tensile Strength F1t [MPa]             650
                              Fibre Compressive Strength F1c [MPa]            650
                                 Matrix Tensile Strength F2t [MPa]            650
                              Matrix Compressive Strength F2c [MPa]           650
                                In-Plane Shear Strength, S12 [MPa]            150
                               Out-Plane Shear Strength, S23 [MPa]            150
                                        Density [ton/mm3 ]                  1.97 e−9
                                       Ply Thickness [mm]                     0.25

                                 Table 4. Aluminium Al 2024 mechanical properties

                                                Aluminium Al2025
                                   Young’s Modulus, E [MPa]                  70,000
                                  Poisson’s ratio, ν12 = ν13 = ν23            0.33
                                        Yield stress [MPa]                     369
                                  Ultimate Tensile Stress [MPa]                469
                                        Density [ton/mm3 ]                   2.7 e−9

     For the aluminium plates, a thickness of 8 mm was chosen.
     Table 5 shows the stacking sequences for the composites’ made sub-components. A discrete
coordinate system has been introduced in the numerical model for each composite barrel sub-component.
Fibres are oriented according to the fuselage longitudinal direction, while the normal axis has been
chosen according to the element normal direction.
     As already mentioned, three different material systems configurations, characterised by different
fracture toughness energies, were considered for the simulations in order to assess the influence of
fracture characteristics on the evolution of the damage and hence on the dynamic response of the
whole fuselage.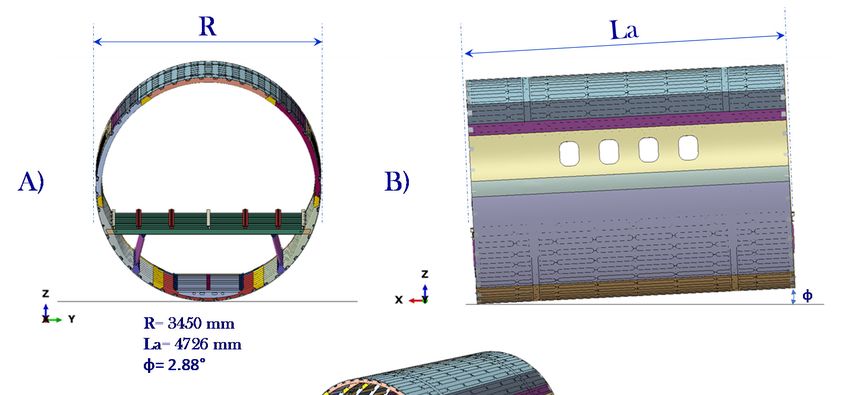
Appl. Sci. 2020, 10, 2019 7 of 15
Table 5. Sub-components stacking sequences.
Stacking Sequence
Skin [90/45/0/45]s
Stringer [45/45/0/0/90/0/0]s
Frames [90/45/0/45/-45/90/45/45/0/-45/45/-45]s
Components in Woven Fabric Material [0/45/0/-45]s
Each configuration, identified with a number (I,II,III), is associated to different values of the
fracture toughness energies for the matrix and fibre under tensile and compression conditions for
both the UNIDIRECTIONAL UD and the woven composite material systems. Moreover, tensile
and compression fracture energy values for the woven fabric were assumed identical for all the
considered configurations.
As it can be observed from Table 6, Configuration II can be considered the most toughened
configuration while configurations I is characterised by the lowest toughness. Finally, configuration
III is characterised by an intermediate/low toughness. Moreover, for all the material configurations,
the degradation of the matrix toughness in both tension and compression was not taken into account.
In fact, the small matrix toughness variations during propagation have a significant effect only on
inter-laminar damages which have not been considered in the frame of the presented application.
Table 6. Fracture toughness energies.
GT1C [kJ/m2 ] GC 2
1C [kJ/m ]
GT2C [kJ/m2 ] GC 2
2C [kJ/m ]
I UNIDIRECTIONAL UD 24 10 3 6
I Woven 8 8 8 8
II UNIDIRECTIONAL UD 44 16 3 6
II Woven 12 12 12 12
III UNIDIRECTIONAL UD 26 12 3 6
III Woven 6 6 6 6
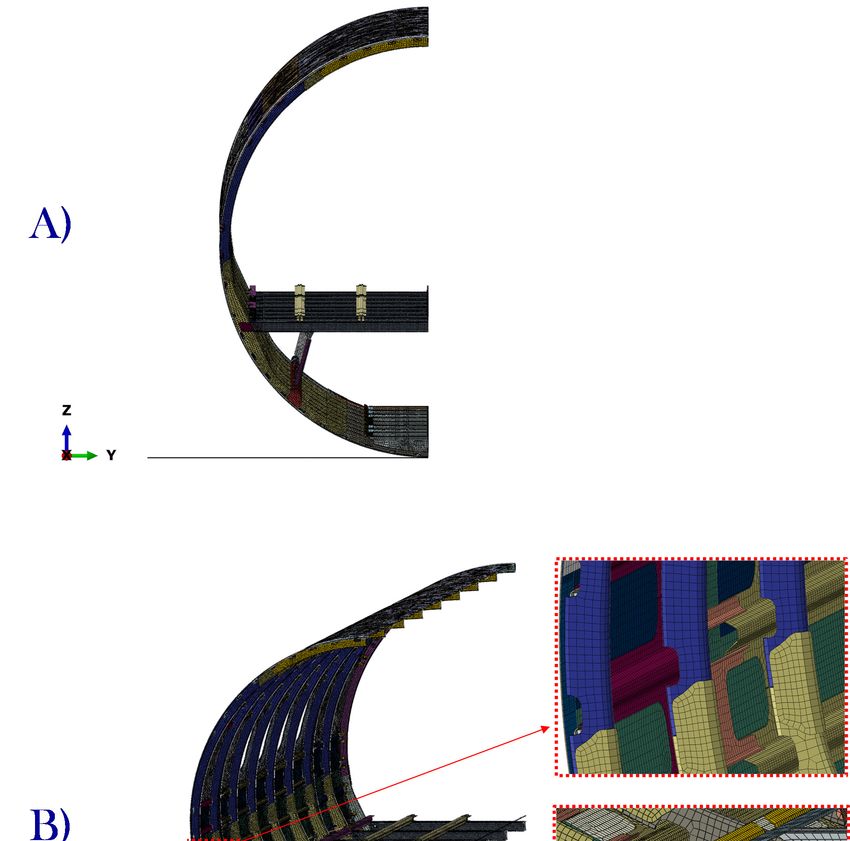
3.3. Finite Element Description
The finite element model of the fuselage section is introduced in Figure 4A,B. The entire model
consists of 1,976,157 nodes and 995,858 elements. The elements used for the aluminium components
are discretised with three-dimensional elements with eight nodes and reduced integration scheme
available in the Abaqus library (SC8R); the elements have a dimension of about 10 mm × 10 mm. Planar
shell elements with rigid body constraint were adopted to model the impact plate between representing
the impacted rigid ground. With reference to the computational grid of the composite components of
the fuselage section, eight nodes continuum shell elements with a reduced integration scheme were
adopted. These elements are general-purpose shells allowing finite membrane deformation and large
rotations, and thus, they are suitable for nonlinear geometric analysis. These elements include the
effects of transverse shear deformations and the effects of thickness change. Connections between
the sub-components were simulated with tie-constraints allowing to couple a master surface with a
slave one by taking into account with all the degrees of freedom. The connections between the vertical
stanchions and the passenger floor/frames were simulated by fastener elements allowing to introduce
breakage criteria based on maximum force in each reference direction.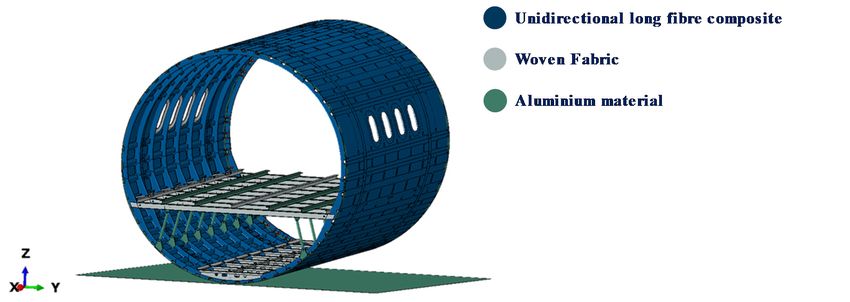
Appl. Sci. 2020, 10, x FOR PEER REVIEW                                                             8 of 16

  Connections between the sub-components were simulated with tie-constraints allowing to couple a
  master surface with a slave one by taking into account with all the degrees of freedom. The
  connections
Appl. Sci. 2020, 10,between
                     2019   the vertical stanchions and the passenger floor/frames were simulated by
                                                                                                  8 of 15
  fastener elements allowing to introduce breakage criteria based on maximum force in each reference
  direction.

     Figure 4. Fuselage mesh model subsection: (A) Frontal view. (B) Isometric view, Stringer view,
       Figure 4. Fuselage mesh model subsection: A) Frontal view. B) Isometric view. C) Stringer view. D)
     Stringer section.
       Stringer section.
3.4. Boundary Conditions
  3.4. Boundary Conditions
      The fuselage section, considered in the frame of the numerical simulations, has a mass of
approximately 940 kg with several mass points added to simulate external non-structural components:
row of seats and occupants and balancing mass. The balancing mass has been opportunely chosen in
order to create an unbalancing effect between the right and the left side of the fuselage barrel during
the simulated drop test. This unbalancing effect has been introduced in order to assess the effects
of the variations in material toughness on lateral damage distribution during the impact simulation.
A general contact type “all-with-self” available in Abaqus/Expicit was adopted with a friction coefficient
of 0.3.
approximately 940 kg with several mass points added to simulate external non-structural
components: row of seats and occupants and balancing mass. The balancing mass has been
opportunely chosen in order to create an unbalancing effect between the right and the left side of the
fuselage barrel during the simulated drop test. This unbalancing effect has been introduced in order
to assess the effects of the variations in material toughness on lateral damage distribution during the
Appl. Sci. 2020, 10, 2019                                                                                    9 of 15
impact simulation. A general contact type “all-with-self” available in Abaqus/Expicit was adopted
with a friction coefficient of 0.3.
      In addition,
      In   addition, thethe weight
                            weight ofof the
                                        the three
                                            three seats
                                                   seats and
                                                         and the
                                                               the two
                                                                   two dummies
                                                                         dummies was
                                                                                  was applied
                                                                                         applied inin the
                                                                                                      the centre
                                                                                                          centre of
                                                                                                                  of
gravity of
gravity    ofthe
              theseats
                     seatsand
                           andrigidly
                                rigidly connected
                                      connected  in in
                                                    thethe  points
                                                        points      of attachment
                                                                of attachment      of seats
                                                                              of the   the seats
                                                                                            to thetopassenger
                                                                                                     the passenger
                                                                                                              floor.
floor.  Figure    5  shows  the  points of connection   of the
Figure 5 shows the points of connection of the various masses. various  masses.

      Figure 5. Added masses and relative positions. (A) Passenger floor isometric view. (B) Lateral view.
       Figure 5. Added masses and relative positions. A) Passenger floor isometric view. B) Lateral view.
      The impact simulation of the fuselage section with the ground has been carried out by considering
      The
a rigid    impact
        plane       simulation
              bounded    in spaceofandthebyfuselage
                                             applyingsection   with
                                                       an initial     the ground
                                                                  velocity           has fuselage
                                                                           to the entire  been carried
                                                                                                   sectionout by
                                                                                                           equal
considering
to 9900 mm/s. a rigid plane velocity
                 The initial boundedhas  in space  and by applying
                                            been evaluated            an initialthe
                                                              by considering     velocity to the
                                                                                    fuselage     entiredropping
                                                                                              section   fuselage
section
from    equal to
      a height of9900
                   5000mm/s.  Therespect
                        mm with     initial velocity  has been
                                             to the rigid      evaluated
                                                          ground   surface.by considering the fuselage section
dropping from a height of 5000 mm with respect to the rigid ground surface.
4. Numerical Results
4. Numerical  Results
    In this section, the numerical results obtained for the three analysed configurations according to
TableIn
      6 are
         thisintroduced.
               section, theThe       differentresults
                                numerical      configurations
                                                      obtainedwere   compared
                                                                for the          in termsconfigurations
                                                                        three analysed     of maximum displacement
                                                                                                           according to
along  the  drop   direction     and   in terms  of  qualitative deformation   of  the
Table 6 are introduced. The different configurations were compared in terms of maximum  whole  fuselage  section.
     For the three
displacement     along different
                           the drop  configurations,
                                        direction andtheinhistory ofqualitative
                                                           terms of  the verticaldeformation
                                                                                  displacementofofthethewhole
                                                                                                         control  points
                                                                                                                fuselage
A and
section.B, as identified    in   Figure   6, was  evaluated.  The  control points   are positioned  on  the crossbeams
of theFor     Appl. Sci.
       passenger         2020,in10,
                     floor       thex FOR PEERof
                                       middle   REVIEW
                                                   the beams  where the                                                    10 of 16
           the three      different    configurations,    the history  of seat rails aredisplacement
                                                                          the vertical   fixed, as shown of in Figure
                                                                                                             the      6.
                                                                                                                 control
points A and B, as identified in Figure 6, was evaluated. The control points are positioned on the
crossbeams of the passenger floor in the middle of the beams where the seat rails are fixed, as shown
in Figure 6.

                                      Figure 6. Point displacement positions.
                                                  Figure 6. Point displacement positions.

             4.1. Configuration I
                  Figure 7A shows the vertical displacements of the control points A and B obtained for the
             configuration I which is the configuration with the lowest toughness. As shown in Figure 7A, for this
             configuration, the maximum value of the vertical displacement at control point was reached (about
             250 mm). Moreover, a discrepancy in the displacements between the two points can be noticed. This
             is generated by the aforementioned unbalancing effect of the balancing mass between the left and the
             right side of the fuselage. However, the configuration with the lowest toughness is able to ensure a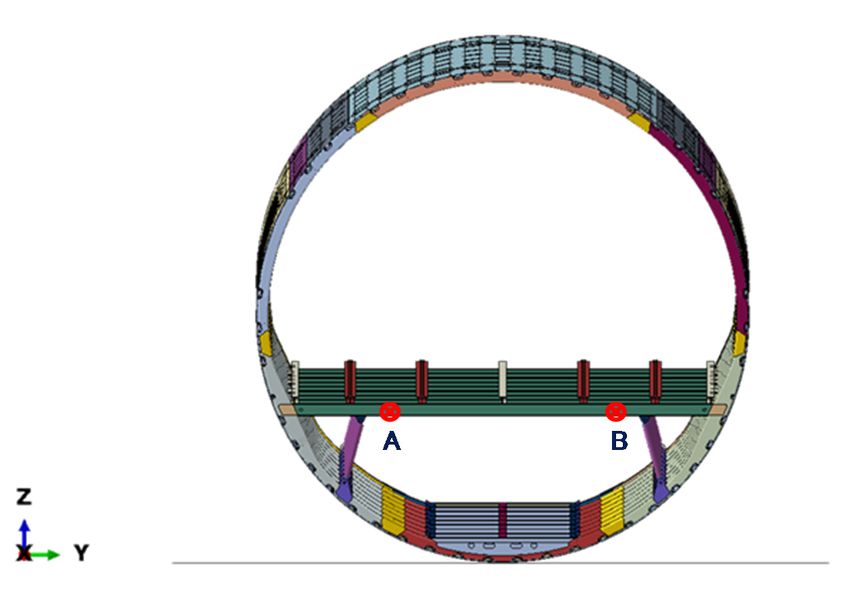
Appl. Sci. 2020, 10, 2019 10 of 15
Figure 6. Point displacement positions.
4.1. Configuration I
Figure 7A shows the vertical displacements of the control points A and B obtained for the
configuration I which
whichisisthetheconfiguration
configurationwith withthe
the lowest
lowest toughness.
toughness. As As shown
shown in Figure
in Figure 7A, 7A, for
for this
this configuration,
configuration, the maximum
the maximum valuevalueof theofvertical
the vertical displacement
displacement at control
at control point
point was was reached
reached (about
(about
250 mm).250Moreover,
mm). Moreover, a discrepancy
a discrepancy in the in the displacements
displacements between between thepoints
the two two points
can becan be noticed.
noticed. This
This
is generated by the aforementioned unbalancing effect of the balancing mass between the left andand
is generated by the aforementioned unbalancing effect of the balancing mass between the left the
the right
right sideside of the
of the fuselage.
fuselage. However,
However, thethe configurationwith
configuration withthethelowest
lowesttoughness
toughnessisisable
able to
to ensure a
quasi-symmetric distribution of the damage, and deformations between the left and the right side of
the fuselage are
are small
small despite
despite of of the
the unbalancing
unbalancing effect
effectofofthe
theintroduced
introducedmass.
mass.
Figure 7B–D shows the deformed structure at the maximum maximum point of deflection.
deflection. In particular,
Figure
Figure 7B
7Bshows
showsthe thefrontal
frontalview
view of of
thethe
deformed
deformedfuselage section.
fuselage Figure
section. 7C shows
Figure the isometric
7C shows view,
the isometric
while
view, Figure 7D shows
while Figure a zoomed
7D shows view ofview
a zoomed the deformed and broken
of the deformed structure
and broken in the cargo
structure in thearea.
cargoIndeed,
area.
the cargothe
Indeed, areacargo
can bearea
considered
can bethe most stressed
considered the one
most during a crash
stressed oneevent.
duringThisa consideration
crash event. leadsThis
to pay special attention
consideration to this
leads to pay area attention
special in a crashworthy design
to this area in ain order to maximise
crashworthy design the dissipation
in order of the
to maximise
kinetic energy. of the kinetic energy.
the dissipation
Figure
Figure 7. 7.
(A)A)Displacement
Displacementvs.
vs.time.
time.(B)
B) Frontal view. C)
(C)Isometric
Isometricview.
view.D) Cargo
(D) area
Cargo areadetails.
details.
4.2. Configuration II
Figure 8A shows the vertical displacements of the control points A and B obtained for the
configuration II which is the configuration with the highest toughness. As shown in Figure 8A, for this
configuration, the minimum value of the vertical displacement at the control point is reached (about
220 mm). Moreover, the maximum discrepancy in the displacements between the two points (A and
B) can be noticed. Indeed, the configuration with the highest toughness amplifies the asymmetry in
damage distribution and deformations between the left and the right side of the fuselage due to the
unbalancing effect of the introduced mass.
Figure 8B–D shows the deformed structure at the maximum point of deflection. In particular,
Figure 8B shows the frontal view of the deformed fuselage section. Figure 8C shows the isometric
view, while Figure 8D shows a zoomed view of the deformed and broken structure in the cargo area.
Indeed, due to the toughening effect, the damage seems to be less distributed in the whole fuselage
and more concentrated in the cargo area if compared to configuration I (Figure 7D).Figure 8.B–D shows the deformed structure at the maximum point of deflection. In particular,
Figure 8.B shows the frontal view of the deformed fuselage section. Figure 8C shows the isometric
view, while Figure 8.D shows a zoomed view of the deformed and broken structure in the cargo area.
Indeed, due to the toughening effect, the damage seems to be less distributed in the whole fuselage
and Sci.
Appl. more concentrated
2020, 10, 2019 in the cargo area if compared to configuration I (Figure 7.D). 11 of 15
Figure 8. (A) Displacement vs. time. (B) Frontal view. (C) Isometric view. (D) Cargo area details.
Figure 8. A) Displacement vs. time. B) Frontal view. C) Isometric view. D) Cargo area details.
4.3. Configuration III
4.3. Configuration III
Figure 9A shows the vertical displacements of the control points A and B obtained for the
Figure 9.A
configuration III,shows
whichthe vertical
is the displacements
configuration with ofthethe control points
intermediate low A and B obtained
toughness. for the
As shown in
configuration
Figure 9A, forIII,thiswhich is the configuration
configuration, withthe
as expected, theminimum
intermediate lowoftoughness.
value Asdisplacement
the vertical shown in Figureat
9.A, forpoint
control this configuration,
is almost identicalas expected, theobserved
to the one minimum forvalue of the vertical
configuration displacement
I (about at control
250 mm). The same
point is almost
considerations canidentical
be repeatedto the onemagnitude
for the observedoffortheconfiguration
discrepancy inIthe(about 250 mm).between
displacements The samethe
Appl. Sci. 2020, 10, x FOR PEER REVIEW 12 of 16
considerations
two points (A and canB)bedue
repeated for the magnitude
to the unbalancing of the
effect of theintroduced
discrepancy in the displacements between
mass.
the two points (A and B) due to the unbalancing effect of the introduced mass.
Figure 9.B–D highlights the damaged structure with particular focus on the maximum deflection
point. Moreover, in Figure 9.B, a frontal view of the deformed fuselage section is reported. In Figure
9.C, an isometric view of the considered fuselage section is exhibited, while a zoomed view of the
damaged cargo area of the structure is shown in Figure 9.D. Indeed, for configuration III, the cargo
area seems to have a reduced damaged concentration if compared with configuration II.
Figure 9. (A) Displacement vs. time. (B) Frontal view. (C) Isometric view. (D) Cargo area details.
Figure 9. A) Displacement vs. time. B) Frontal view. C) Isometric view. D) Cargo area details.
4.4. Configuration Comparison
In order to appreciate the effect of the fracture toughness on the mechanical behaviour of the
fuselage undergoing the crash event, the displacement patterns were superimposed in Figure 10.
Indeed, in Figure 10.A and Figure 10.B, respectively, the vertical displacements of control point A
and point B obtained for the three analysed configurations were superimposed. As shown in Figure
10A,B, for all the configurations, the slopes at the beginning of the crash event are identical straight
lines. In fact, at the beginning of the crash event, although the structure deforms and the damage hasAppl. Sci. 2020, 10, 2019 12 of 15
Figure 9B–D highlights the damaged structure with particular focus on the maximum deflection
point. Moreover, in Figure 9B, a frontal view of the deformed fuselage section is reported. In Figure 9C,
an isometric view of the considered fuselage section is exhibited, while a zoomed view of the damaged
cargo area of the structure is shown in Figure 9D. Indeed, for configuration III, the cargo area seems to
have a reduced damaged concentration if compared with configuration II.
4.4. Configuration Comparison
In order to appreciate the effect of the fracture toughness on the mechanical behaviour of the
fuselage undergoing the crash event, the displacement patterns were superimposed in Figure 10.
Indeed, in Figures 10A and 10B, respectively, the vertical displacements of control point A and point B
obtained for the three analysed configurations were superimposed. As shown in Figure 10A,B, for all
the configurations, the slopes at the beginning of the crash event are identical straight lines. In fact, at
the beginning of the crash event, although the structure deforms and the damage has started, the effects
of the damage evolution were found almost negligible. Indeed, the effects of the in-plane fracture
toughness were found more significant later during the crash event almost at the maximum deflection.
Configurations I and III, characterised by a similar value of fracture energies for both materials,
both show a maximum deflection of about 250 mm for control point A and about 230 mm for control
point B. For both these configurations, a significant variation of stiffness has been found at 0.022 s
for control point A (Figure 10A) and 0.027 s for control point B (Figure 10B). On the other hand,
configuration II, characterised by the highest toughness values, shows a maximum deformation of
about 220 and 180 mm, respectively, for control points A and B. These maximum values, as expected,
are lower if compared to configurations I and III.
Finally, as already remarked, the configuration with the highest toughness, differently from
configurations I and III, amplifies the asymmetrical distribution of the damage between the left side
(control point A) and the right side (control point B) of the fuselage induced by the unbalancing effect
of the introduced mass.
Appl. Sci. 2020, 10, x FOR PEER REVIEW 13 of 16
Displacement vs Time Point A Displacement vs Time Point B
0 0
-50 I I
-50
Displacement [mm]
Displacement [mm]
II II
-100
-100 III
-150 III
-150
-200
-250 -200
-300 -250
0 0.01 0.02 0.03 0.04 0.05 0.06 0.07 0.08 0 0.01 0.02 0.03 0.04 0.05 0.06 0.07 0.08
Time [s] Time [s]
A) B)
Figure 10. Displacement vs. time for the three considered configurations: (A) Point A location. (B) Point
Figure 10. Displacement vs. time for the three considered configurations: A) Point A location. B)
B location.
Point B location.
Moreover, in Figure 11, a comparison of damage energy dissipation is reported for the three
Moreover, in Figure
fracture toughness 11.A, a Configuration
energies. comparison of II damage energy
dissipates dissipation
a lower amountisofreported
energy iffor the three to the
compared
fracture
other configurations. Configurations I and III dissipate a relevant amount of the total energytoasthe
toughness energies. Configuration II dissipates a lower amount of energy if compared damage
other configurations.
energy; Configurations
consequently, I and
a higher value III maximum
of the dissipate adisplacement
relevant amount of thefor
was found total
thisenergy as
configurations,
damage energy; consequently, a higher value of the maximum displacement was found for this
compared to configuration II.
configurations, compared to configuration II.
Damage Energy
12
10
8
Energy [kJ]
Configuration II
Configuration I
6
Configuration III
4
2Moreover, in Figure 11.A, a comparison of damage energy dissipation is reported for the three
fracture toughness energies. Configuration II dissipates a lower amount of energy if compared to the
other configurations. Configurations I and III dissipate a relevant amount of the total energy as
damage energy; consequently, a higher value of the maximum displacement was found for this
Appl. Sci. 2020, 10, 2019 13 of 15
configurations, compared to configuration II.
Damage Energy
12
10
8
Energy [kJ]
Configuration II
Configuration I
6
Configuration III
4
2
0
0 0.01 0.02 0.03 0.04 0.05 0.06 0.07 0.08
Time [sec]
Figure
Figure 11.11. Damage energy
Damage energy dissipation.
dissipation.
5. Conclusions
In the presented work, a numerical study on the influence of the in-plane toughness on the
dynamic behaviour of a complex composite fuselage barrel, undergoing a crash event, was attempted.
5. Conclusions
In order to evaluate the effects of intralaminar fracture toughness, three different material systems
characterised by different toughness (low toughness, high toughness and intermediate/low toughness)
In the were
presented
considered,work, a numerical
both for study
the unidirectional on the influence
fibre-reinforced composite andof the in-plane
for the toughness
woven fabric one. on the
As a result of the performed numerical study, a relevant influence
dynamic behaviour of a complex composite fuselage barrel, undergoing a crash event, was of the in-plane toughness on the
global dynamic response of the fuselage barrel was found. Actually, the configuration characterised by
attempted. In
theorder
highestto evaluate
toughness the effects
showed ofvertical
the lowest intralaminar
deflectionfracture toughness,
and the most significant three
damage different
in the material
systems characterised by different
cargo area. Moreover, toughness
this configuration seems(low toughness,
to be high
more sensitive toughness
to the unbalancingand intermediate/low
of the mass
in the lateral
toughness) were direction both
considered, producing the most
for the significant asymmetry
unidirectional in damage distributions
fibre-reinforced composite between
and for the woven
the left and the right side of the fuselage. On the other hand, the configurations characterised by the
fabric one. lowest in-plane toughness showed the maximum vertical deflection and a more distributed damage
As a result of the
evolution performed
in the numerical
whole structure, leading tostudy, a relevant
less significant influence
damage in the cargoof area.
the in-plane toughness on
Finally, a low
the global sensitivity
dynamic response
to the unbalancing ofof the fuselage
the mass barrel
in the later was
direction found. Actually, the configuration
was found.
characterised by the
Author highest All
Contributions: toughness showed
authors equally thetolowest
contribute this work.vertical deflection
All authors andagreed
have read and the most
to the significant
published version of the manuscript.
damage in the cargo area. Moreover, this configuration seems to be more sensitive to the unbalancing
This research received no external funding.
of the mass Funding:
in the lateral direction producing the most significant asymmetry in damage distributions
Conflicts of Interest: The authors declare no conflict of interest.
between the left and the right side of the fuselage. On the other hand, the configurations characterised
by the lowest in-plane toughness showed the maximum vertical deflection and a more distributed
References
damage evolution
1. in the
Heimbs, whole
S.; Vogt, structure,
D.; Hartnack, leading toJ.; less
R.; Schlattmann, Maier,significant
M. Numericaldamage
simulationin the cargo
of aircraft area. Finally,
interior
a low sensitivity to the unbalancing
components under crash loads.of the
Int. mass in the
J. Crashworthiness later
2008, direction
13, 511–521. was found.
[CrossRef]
2. Obergefell, L.A.; Gardner, T.R.; Kaleps, I.; Fleck, J.T. Articulated total body model Enhancements.
In AAMRL-TR-88-043 User’s Guide; Armstrong Aerospace Medical Research Laboratory: Dayton, HO,
USA, 1988; p. 2.
3. Ruan, J.; Zhou, C.; Khalil, T.; King, A. Techniques and Applications of Finite Element Analysis of the Biomechanical
Response of the Human Head to Impact; CRC Press: Boca Raton, FL, USA, 2000.
4. De Jager, M.K.J.; Sauren, A.A.H.J.; Thunnissen, J.G.M.; Wismans, J.S.H.M. A three-dimensional head-neck
model: Validation for frontal and lateral impacts. SAE Trans. 1994, 103, 1660–1676.
5. Mertz, H.J.; Prasad, P.; Nusholtz, G. Head Injury Risk Assessment for Forehead Impacts. SAE Tech. Pap. Ser.
1996, 105, 26–46.Appl. Sci. 2020, 10, 2019 14 of 15
6. Hashemi, S.M.R.; Walton, A.C. A systematic approach to aircraft crashworthiness and impact surface material
models. Proc. Inst. Mech. Eng. Part G J. Aerosp. Eng. 2000, 214, 265–280. [CrossRef]
7. Kindervater, C.M. The crashworthiness of composite aerospace structures. In Proceedings of the Workshop
the Crashworthiness of Composite Transportation Structures, Crowthorne, UK, 3 October 2002.
8. Carden, H.D.; Boitnott, R.L.; Fasanella, E.L. Behavior of composite/metal aircraft structual elements and
components under crash type loads. In Proceedings of the 17th Congress of the International Council of
Aeronautical Sciences, Stockholm, Sweden, 9–14 September 1990.
9. Jackson, K.E.; Boitnott, R.L.; Fasanella, E.L.; Jones, L.E.; Lyle, K.H. A history of full-scale aircraft and
rotorcraft crash testing and simulation at NASA Langley research center. In Proceedings of the 4th Triennial
International Aircraft Fire and Cabin Safety Research Conference, Lisbon, Portugal, 15–18 November 2004.
10. Logue, T.V.; McGuire, R.J.; Reinhardt, J.W.; Vu, T.V. Vertical Drop Test of a Narrow-Body Fuselage Section with
Overhead Stowage Bins and Auxiliary Fuel Tank System on Board; Report DOT/FAA/CT-94/116; U.S. Department
of Transportation; Federal Aviation Administration: Atlantic City, NJ, USA, 1995.
11. Abramowitz, A.; Smith, T.G.; Vu, T. Vertical Drop Test of a Narrow-Body Transport Fuselage Section with a
Conformable Auxiliary Fuel Tank Onboard; Report DOT/FAA/AR-00/56; U.S. Department of Transportation;
Federal Aviation Administration: Atlantic City, NJ, USA, 2000.
12. Byar, A.D.; Ko, J.; Rassaian, M. 737 fuselage section drop test simulation using LS-Dyna finite element
method, ICRASH 2008. In Proceedings of the International Crashworthiness Conference, Kyoto, Japan,
22–25 June 2008.
13. Kumakura, I.; Minegishi, M.; Iwasaki, K.; Shoji, H.; Yoshimoto, N.; Terada, H.; Sashikuma, H.; Isoe, A.;
Yamaoka, T.; Katayama, N.; et al. Vertical Drop Test of a Transport Fuselage Section. In Proceedings of the
SAE World Aviation Congress, Phoenix, AZ, USA, 6–8 May 2002.
14. Kumakura, I.; Minegishi, M.; Iwasaki, K.; Shoji, H.; Miyaki, H.; Yoshimoto, N.; Sashikuma, H.; Katayama, N.;
Isoe, A.; Hayashi, T.; et al. Summary of Vertical Drop Tests of YS-11 Transport Fuselage Sections.
In Proceedings of the SAEWorld Aviation Congress, Montreal, QC, Canada, 9–11 September 2003.
15. Deletombe, E.; Delsart, D.; Fabis, J.; Langrand, B.; Ortiz, R. Recent developments in computer modelling,
materials characterisation and experimental validation with respect to crash dynamics. In Proceedings of
the 4th Triennial International Aircraft Fire and Cabin Safety Research Conference, Lisbon, Portugal, 15–18
November 2004.
16. Waimer, M.; Kohlgr¨uber, D.; Hachenberg, D.; Voggenreiter, H. The kinematics model—A numerical method
for the development of a crashworthy composite fuselage design of transport aircraft. In Proceedings of the
6th Triennial International Aircraft Fire and Cabin Safety Research Conference, Atlantic City, NJ, USA, 25–28
October 2010.
17. Fen, Z.; Hao, P.; Zou, T. Research development of crashworthiness simulation evaluation on civil aircraft.
Procedia Eng. 2011, 17, 286–291.
18. Kindervater, C.M.; Kohlgr¨uber, D.; Johnson, A. Composite vehicle structural crashworthiness—A status of
design methodology and numerical simulation techniques. Int. J. Crashworthiness 1999, 4, 213–230. [CrossRef]
19. Adams, A.; Lankarani, H.M. A modern aerospace modeling approach for evaluation of aircraft fuselage
crashworthiness. Int. J. Crashworthiness 2003, 8, 401–413. [CrossRef]
20. Byar, A.; Awerbuch, J.; Lau, A.; Tan, T. Finite element simulation of a vertical drop test of a Boeing 737
fuselage section. In Proceedings of the 3rd Triennial International Aircraft Fire and Cabin Safety Research
Conference, Atlantic City, NJ, USA, 1–4 August 2001.
21. Jackson, K.E.; Fasanella, E.L. Crash simulation of a vertical drop test of a B737 fuselage section with overhead
bins and luggage. In Proceedings of the 3rd Triennial International Aircraft Fire and Cabin Safety Research
Conference, Atlantic City, NJ, USA, 1–4 August 2001.
22. Rassaian, M.; Byar, A.; Ko, J. Numerical simulation of 737 fuselage section drop test. In Proceedings of the
NAFEMS World Congress, Crete, Greece, 16–19 June 2009.
23. Wiggenraad, J.; Michielsen, A.; Santoro, D.; Lepage, F.; Kindervater, C.; Beltrán, F.; Al-Khalil, M. Finite element
methodologies development to simulate the behaviour of composite fuselage structure and correlation with
drop test. Air Space Eur. 2001, 3, 228–233. [CrossRef]
24. Middendorf, P.; Heimbs, S. Crash simulation of composite structures. Compos. Mater 2007, 2, 18–22.
25. Califano, A. Modelling the Fatigue Behavior of Composites under Spectrum Loading; AIP Publishing: University
Park, MD, USA, 2018.Appl. Sci. 2020, 10, 2019 15 of 15
26. Riccio, A.; Damiano, M.; Raimondo, A.; Di Felice, G.; Sellitto, A. A fast numerical procedure for the simulation
of inter-laminar damage growth in stiffened composite panels. Compos. Struct. 2016, 145, 203–216. [CrossRef]
27. Riccio, A.; Di Costanzo, C.; Di Gennaro, P.; Sellitto, A.; Raimondo, A. Intra-laminar progressive failure
analysis of composite laminates with a large notch damage. Eng. Fail. Anal. 2017, 73, 97–112. [CrossRef]
28. Riccio, A.; Sellitto, A.; Saputo, S.; Russo, A.; Zarrelli, M.; LoPresto, V. Modelling the damage evolution
in notched omega stiffened composite panels under compression. Compos. Part B Eng. 2017, 126, 60–71.
[CrossRef]
29. Liu, X.; Guo, J.; Bai, C.; Sun, X.; Mou, R. Drop test and crash simulation of a civil airplane fuselage section.
Chin. J. Aeronaut. 2015, 28, 447–456. [CrossRef]
30. Kuraishi, A.; Tsai, S.W.; Liu, K.K. A progressive quadratic failure criterion, part B. Compos. Sci. Technol. 2002,
62, 1683–1695. [CrossRef]
31. Spahn, J.; Andrä, H.; Kabel, M.; Muller, R. A multiscale approach for modeling progressive damage of
composite materials using fast Fourier transforms. Comput. Methods Appl. Mech. Eng. 2014, 268, 871–883.
[CrossRef]
32. Pineda, E.J.; Waas, A.M.; Bednarcyk, B.A.; Collier, C.S.; Yarrington, P.W. Progressive damage and failure
modeling in notched laminated fiber reinforced composites. Int. J. Fract. 2009, 158, 125–143. [CrossRef]
33. Basu, S.; Waas, A.; Ambur, D.R. Prediction of progressive failure in multidirectional composite laminated
panels. Int. J. Solids Struct. 2007, 44, 2648–2676. [CrossRef]
34. Apalak, Z.G.; Apalak, M.K.; Genç, M.S. Progressive Damage Modeling of an Adhesively Bonded
Unidirectional Composite Single-lap Joint in Tension at the Mesoscale Level. J. Thermoplast. Compos. Mater.
2006, 19, 671–702. [CrossRef]
35. Ridha, M.; Wang, C.H.; Chen, B.; Tay, T. Modelling complex progressive failure in notched composite
laminates with varying sizes and stacking sequences. Compos. Part A: Appl. Sci. Manuf. 2014, 58, 16–23.
[CrossRef]
36. Pineda, E.J.; Waas, A. Modelling progressive failure of fibre reinforced laminated composites: Mesh objective
calculations. Aeronaut. J. 2012, 116, 1221–1246. [CrossRef]
37. Pineda, E.J.; Waas, A.M. Numerical implementation of a multiple-ISV thermodynamically-based work
potential theory for modeling progressive damage and failure in fiber-reinforced laminates. Int. J. Fract.
2013, 182, 93–122. [CrossRef]
38. Laurin, F.; Carrere, N.; Maire, J.-F. A multiscale progressive failure approach for composite laminates based
on thermodynamical viscoelastic and damage models. Compos. Part A Appl. Sci. Manuf. 2007, 38, 198–209.
[CrossRef]
39. Lapczyk, I.; Hurtado, J.A. Progressive damage modeling in fiber-reinforced materials. Compos. Part A Appl.
Sci. Manuf. 2007, 38, 2333–2341. [CrossRef]
40. Murakami, S.; Kamiya, K. Constitutive and damage evolution equations of elastic-brittle materials based on
irreversible thermodynamics. Int. J. Mech. Sci. 1997, 39, 473–486. [CrossRef]
41. Donadon, M.V.; Falzon, B.G.; Iannucci, L.; Hodgkinson, J.M. Intralaminar toughness characterisation of
unbalanced hybrid plain weave laminates. Compos. Part A Appl. Sci. Manuf. 2007, 38, 1597–1611. [CrossRef]
42. Pappas, G.; Botsis, J. Intralaminar fracture of unidirectional carbon/epoxy composite: Experimental results
and numerical analysis. Int. J. Solids Struct. 2016, 85, 114–124. [CrossRef]
43. Iwamoto, M.; Ni, Q.-Q.; Fujiwara, T.; Kurashiki, K. Intralaminar fracture mechanism in unidirectional CFRP
composites. Eng. Fract. Mech. 1999, 64, 721–745. [CrossRef]
44. Hashin, Z. Failure Criteria for Unidirectional Fiber Composites. J. Appl. Mech. 1980, 47, 329–334. [CrossRef]
45. Abaqus Theory Manual Version 6.16. Dassault System France 2016. Available online: http://www.abaqus.com
(accessed on 5 April 2019).
© 2020 by the authors. Licensee MDPI, Basel, Switzerland. This article is an open access
article distributed under the terms and conditions of the Creative Commons Attribution
(CC BY) license (http://creativecommons.org/licenses/by/4.0/).You can also read


