Predicting preferred prey of Sumatran tigers Panthera tigris sumatrae via spatio-temporal overlap
←
→
Page content transcription
If your browser does not render page correctly, please read the page content below
Predicting preferred prey of Sumatran tigers
Panthera tigris sumatrae via spatio-temporal overlap
M A X I M I L I A N L . A L L E N , M A R S Y A C . S I B A R A N I and M I H A K R O F E L
Abstract Encounter rates of carnivores with prey are Introduction
dependent on spatial and temporal overlap, and are often
highest with their preferred prey. The Critically Endangered
Sumatran tiger Panthera tigris sumatrae is dependent on I nterspecific interactions are important aspects of com-
munity ecology, affecting the functional ecology of eco-
systems and dictating the ecological niches inhabited by
prey populations, but little is known about its prey prefer-
ences. We collected camera-trap data for years (–) species (Begon et al., ). Such interactions can be diffi-
in Bukit Barisan Selatan National Park, Sumatra, to investi- cult to assess, however, particularly for cryptic species such
gate spatial and temporal overlap of tigers with potential as wild carnivores (Allen et al., ; Saggiomo et al., ).
prey species. We also developed a novel method to predict Carnivore–prey encounter rates are dependent on spatial
predator–prey encounter rates and potential prey preferences and temporal overlap, and high encounter rates are often in-
from camera-trap data. We documented at least individual dicative of prey preference (Holling, ; Fortin et al., ).
tigers, with an overall detection rate of . detections/ Data on spatio-temporal overlap of carnivores with poten-
trap nights. Tigers exhibited a diurnal activity pattern and tial prey species may thus facilitate inference of prey prefer-
had highest temporal overlap with wild boar Sus scrofa and ences and patterns of interspecific interactions, providing
pig-tailed macaques Macaca nemestrina, but highest spatial insights into ecosystem functions that can inform effective
overlap with wild boar and sambar deer Rusa unicolor. We conservation. Camera trapping is a non-invasive method
created a spatial and temporal composite score and three that is increasingly being used to monitor wildlife and
additional composite scores with adjustments for the spatial provides data on species richness, behaviour, and spatio-
overlap and preferred prey mass. Wild boars ranked highest temporal activity (Swanson et al., ; Rich et al., ;
for all composite scores, followed by sambar deer, and both Allen et al., ).
are known as preferred tiger prey in other areas. Spatial and The tiger Panthera tigris is categorized as Endangered
temporal overlaps are often considered as separate indices, throughout its range, with four subspecies probably extinct
but a composite score may facilitate better predictions of en- in the wild (Seidensticker, ; Goodrich et al., ).
counter rates and potential prey preferences. Our findings sug- The Sumatran tiger Panthera tigris sumatrae is Critically
gest that prey management efforts in this area should focus Endangered (Linkie et al., ), as are many other species
on wild boar and sambar deer, to ensure a robust prey base for on the Indonesian island of Sumatra (O’Brien & Kinnaird,
this Critically Endangered tiger population. ; Pusparini et al., ). Prey abundance can have strong
effects on the abundance and population density of tigers
Keywords Activity patterns, composite score, Panthera (Karanth et al., ; Barber-Meyer et al., ), and tiger
tigris, prey preference, spatial overlap, Sumatra, temporal declines have been linked to declines of prey in Russia and
overlap, tiger India (Miquelle et al., ; Ramakrishnan et al., ). The
Supplementary material for this article is available at prey preferences of tigers are unknown in many areas, but
doi.org/./S such knowledge is important to inform conservation planning
and ensure sufficient prey is available in areas critical to tiger
conservation. Information about the Sumatran tiger’s diet is
limited (e.g. O’Brien et al., ; Linkie & Ridout, ), and
data on spatial and temporal activity patterns and overlap
between tigers and potential prey could improve our under-
standing of the subspecies’ prey preferences.
Bukit Barisan Selatan National Park is one of the largest
MAXIMILIAN L. ALLEN (Corresponding author, orcid.org/0000-0001-8976- protected areas on the island of Sumatra, and is critical
889X) Illinois Natural History Survey, University of Illinois, 1816S. Oak for the conservation of the Sumatran tiger and other
Street, Champaign, Illinois 61820, USA. E-mail maxallen@illinois.edu
species of conservation concern, including the Critically
MARSYA C. SIBARANI Wildlife Conservation Society—Indonesia Program, Bogor,
West Java, Indonesia
Endangered Sumatran rhinoceros Dicerorhinus sumatren-
sis and Sumatran elephant Elephas maximus sumatranus
MIHA KROFEL ( orcid.org/0000-0002-2010-5219) Department of Forestry,
Biotechnical Faculty, University of Ljubljana, Ljubljana, Slovenia (O’Brien & Kinnaird, ; Pusparini et al., ). The Park
Received January . Revision requested April . provides relatively abundant tiger habitat, but threat levels
Accepted May . First published online March . are moderate to high because of inadequate conservation
This is an Open Access article, distributed under the terms of the Creative Commons Attribution licence (http://creativecommons.org/licenses/by/4.0/), which permits unrestricted re-use,
Downloadeddistribution,
from https://www.cambridge.org/core. University
and reproduction in any medium, providedofthe
Illinois at Urbana
original work is -properly
Champaign
cited.Library, on 23 Feb 2021 at 13:12:39, subject to the Cambridge Core terms of use, available at
https://www.cambridge.org/core/terms. https://doi.org/10.1017/S0030605319000577
Oryx, 2021, 55(2), 197–203 © The Author(s), 2020. Published by Cambridge University Press on behalf of Fauna & Flora International doi:10.1017/S0030605319000577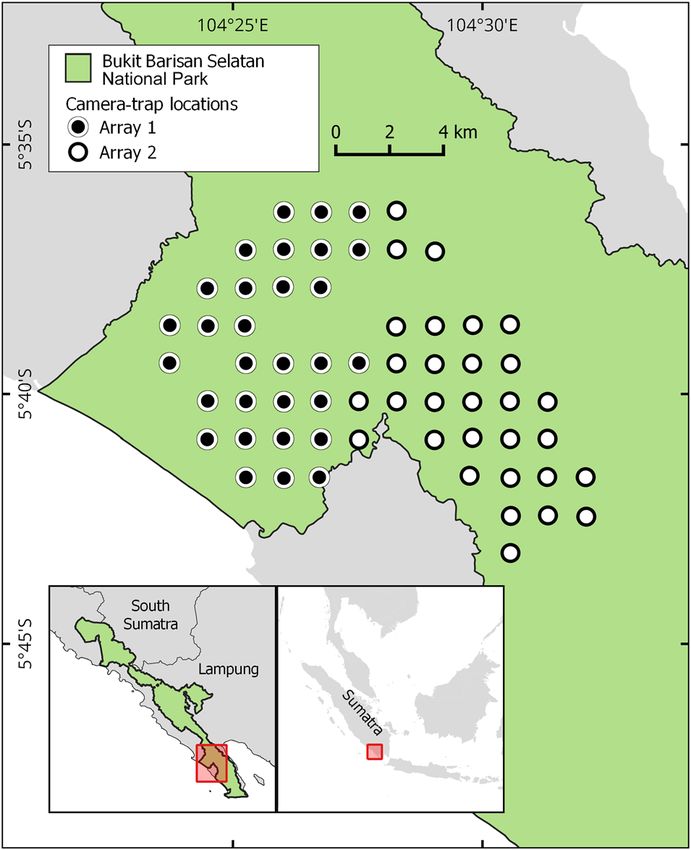
198 M. L. Allen et al.
measures (Sanderson et al., ). Given the Park’s importance
for tiger conservation, it is important to understand the spe-
cies’ ecology in this area. Previous studies of activity patterns
of Sumatran tigers in the Park produced conflicting results;
O’Brien et al. () reported tigers had a diurnal activity
pattern, whereas Pusparini et al. () reported a crepuscular
activity pattern with highest activity levels near dawn. The
tigers’ prey preferences and prey abundance in the area are
also unknown.
To inform conservation efforts, we investigated tiger
spatio-temporal overlap with potential prey species, using
years of camera-trap data from an area of the Park with little
human activity. Our objectives were to () document the
minimum number of individual tigers in the area, () deter-
mine the temporal and spatial overlap of tigers with six po-
tential prey species, and () create a composite score from the
indices of temporal and spatial overlap as a novel method to
predict predator–prey encounter rates and determine poten-
tial prey preference. In our analyses we included all potential
tiger prey species present in the study area, based on a review
of tiger dietary studies (Hayward et al., ). In line with
known prey preferences of tigers across their range, we ex-
pected sambar deer Rusa unicolor and wild boar Sus scrofa
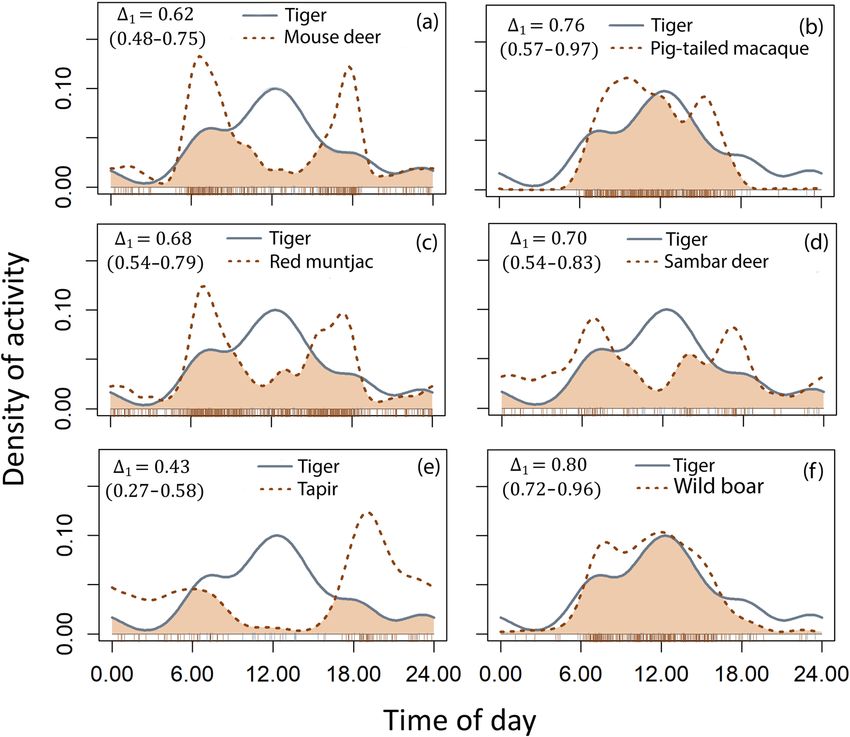
to have the highest composite spatio-temporal score. FIG. 1 The study site with camera-trap locations of both arrays
within Bukit Barisan Selatan National Park on the island of
Sumatra, Indonesia.
Study area
Our study site is in Bukit Barisan Selatan National Park, in designed our survey to monitor multiple species effectively
the South Barisan Range ecosystem on the Indonesian is- (Rich et al., ). We set two arrays of camera traps,
land of Sumatra (Fig. ). The Park is the third largest pro- using the Network’s protocols (TEAM Network, ), in
tected area (, km) on Sumatra (O’Brien & Kinnaird, sites chosen for accessibility for long-term repeated surveys,
), spanning two provinces: Lampung and Bengkulu. all in lowland forests at – m altitude. We placed camera
Topography ranges from coastal plains and lowland rain- traps in each array at a density of per km (Fig. ), and
forest at sea level in the southern peninsula of the Park the arrays covered a total of . km. We deployed the
to mountains up to , m in the central and northern camera-trap arrays in the dry season (April–July) of each
parts (Pusparini et al., ). The Park contains montane, year during –, with array in operation during
lowland tropical, coastal and mangrove forests. Annual April–May and array during June–July, with the aim to
rainfall is ,–, mm, most of which falls in the mon- complete at least sampling days for each camera trap.
soon season (November–May), and annual temperatures We positioned camera traps near animal trails and/or
are – °C (O’Brien et al., ). The Park contains a high places used regularly by wildlife, to maximize detections.
diversity of wildlife, with tigers and other species listed We placed camera traps – cm off the ground, with no
in the CITES Appendices and categorized as Endangered refractory period between images.
or Critically Endangered on the IUCN Red List.
Statistical analyses
Methods
To avoid pseudo-replication, we considered consecutive
Camera trapping photo captures of the same species as independent events
only if they occurred after an interval of . min
We set camera traps in the Park as part of the Tropical (Rovero & Zimmermann, ). We calculated the number
Ecology and Assessment Monitoring Network, which col- of independent captures for each species, but combined
lects long-term biodiversity data in tropical environments both mouse deer species (greater mouse deer Tragulus
globally to guide conservation actions. Our goal was to napu and lesser mouse deer Tragulus kanchil) in one cat-
monitor the terrestrial vertebrate community, and we egory because they share similar characteristics as potential
Oryx, 2021, 55(2), 197–203 © The Author(s), 2020. Published by Cambridge University Press on behalf of Fauna & Flora International doi:10.1017/S0030605319000577
Downloaded from https://www.cambridge.org/core. University of Illinois at Urbana - Champaign Library, on 23 Feb 2021 at 13:12:39, subject to the Cambridge Core terms of use, available at
https://www.cambridge.org/core/terms. https://doi.org/10.1017/S0030605319000577Preferred prey of Sumatran tigers 199
tiger prey and it was difficult to distinguish between them on potential prey species. The upper right quadrant of the plot
camera-trap images (O’Brien et al., ). (high spatial and temporal overlap) indicates the most en-
We used a relative abundance index as a proxy for tiger countered and potentially most preferred prey species, where-
abundance, because this is a more accurate proxy for as the upper left (high temporal but low spatial overlap) and
abundance than occupancy values (Parsons et al., ). lower right (low temporal but high spatial overlap) quadrants
We calculated the index as: would indicate potential alternative prey that were encoun-
tered opportunistically in space or time. The lower left quad-
relative rant (low spatial and temporal overlap) would indicate species
= (detection events/trap nights) × 100
abundance index rarely encountered and probably not preferred.
Finally, we calculated the mean of the spatial and tem-
for each camera trap, to determine detection events per poral overlap values for each prey species to create a spa-
trap nights (e.g. Allen et al., ), and averaged the values tial and temporal composite score (Song et al., ). This
from all camera traps to determine an overall mean for the allowed us to rank the potential prey species, with higher
study area. We used the stripe patterns of individual tigers to scores indicating higher encounter rate and potentially high-
identify the minimum number of individuals, separately for er preference.
photographs of the right and left flanks. We expected that this simple composite score could be
We used kernel density estimation to determine activ- improved by giving additional weight to some variables or
ity patterns and quantify overlap among species (Ridout & including other variables in the score. We therefore calcu-
Linkie, ). We reviewed potential prey species for tigers lated three additional composite scores to determine how
(Hayward et al., ) and analysed those in our study area different weighting of overlap scores or the inclusion of ad-
with . detection events, which included the greater and ditional variables affect the preference rankings of potential
lesser mouse deer (n = ), Malay tapir Tapirus indicus prey.
(n = ), pig-tailed macaque Macaca nemestrina (n = ), Firstly, we assigned more weight to the spatial overlap
red muntjac Muntiacus muntjac (n = ), sambar deer value, because spatial overlap with prey is an important as-
(n = ), and wild boar (n = ). We first converted the pect of niche selection and resource partitioning for carnivores
time of each event into a radians measurement for analysis. (Schoener, ; du Preez et al., ) and may better reflect
We then used the overlap package (Meredith & Ridout, ) prey species being sought out, compared to temporal overlap.
in R .. (R Core Team, ) to fit the data to a circular We calculated the spatial adjusted composite score as:
kernel density, and estimated the activity level at each time
spatial adjusted (spatial overlap × 0.6) +
period from the distribution of the kernel density using a =
Δ overlap value based on our sample sizes. We used the composite score (temporal overlap × 0.4)
overlapEst function to estimate the degree of overlap in activ-
Secondly, we considered a composite score that also in-
ity patterns between tigers and the potential prey species. We
cluded prey mass, with a higher mass adjustment value (spa-
calculated confidence intervals (CI) by bootstrapping ,
tial and temporal composite score × .) for prey within the
estimates of activity for each species, and then using the
preferred size range of tigers (– kg; Hayward et al.,
bootEst and bootCI functions to estimate the % CI for the
) and a lower value (spatial and temporal composite
overlap between tigers and each potential prey species.
score × .) for potential prey outside this range. We ob-
To determine spatial overlap with potential prey species
tained prey mass values from Nowak () and used %
we used the methods of Ngoprasert et al. (). We first cal-
of the mean weight of adult females to account for young
culated the relative abundance index for each prey species,
animals being eaten (Hayward et al., ). We then calcu-
as for tigers, and then scaled the index for each prey spe-
lated the mass adjusted composite score as:
cies at each camera-trap site to continuous probability values
of – (Ngoprasert et al., ). We then created a logistic mass adjusted (spatial overlap × temporal overlap) ×
=
regression for each prey species using data from each composite score mass adjustment
camera-trap location. In the logistic regression we used
tiger presence as the dependent variable and prey probabil- Thirdly, we calculated a spatial and mass adjusted com-
ity values as the independent variable. We then compared posite score as:
spatial overlap of prey species using the area under the
curve (AUC) of receiver operating characteristic plots ((spatial overlap × 0.6) +
spatial and mass
(Fielding & Bell, ), and quantified the spatial overlap = (temporal overlap × 0.4)) ×
adjusted composite score
of tigers with individual prey species as the AUC values, mass adjustment
which range from . (random) to . (perfect fit). We then ranked potential prey species based on each
To determine which prey species may be preferred we composite score, with higher scores indicating higher en-
plotted the spatial and temporal overlap of tigers with each counter rate and potentially higher preference.
Oryx, 2021, 55(2), 197–203 © The Author(s), 2020. Published by Cambridge University Press on behalf of Fauna & Flora International doi:10.1017/S0030605319000577
Downloaded from https://www.cambridge.org/core. University of Illinois at Urbana - Champaign Library, on 23 Feb 2021 at 13:12:39, subject to the Cambridge Core terms of use, available at
https://www.cambridge.org/core/terms. https://doi.org/10.1017/S0030605319000577200 M. L. Allen et al.
TABLE 1 The indices of potential prey species of tigers Panthera tigris sumatrae in Bukit Barisan Selatan National Park, Sumatra, including
relative abundance (detection events/ trap nights), temporal overlap, spatial overlap, and composite scores. Higher composite scores
indicate greater encounter rates and potential prey preference. Species are listed in order of their spatial and temporal composite score.
Composite scores
Relative Temporal Spatial Spatial & Spatial Prey mass Spatial & prey
Species abundance overlap overlap temporal adjusted adjusted mass adjusted
Wild boar Sus scrofa 3.15 0.80 0.71 0.76 0.77 0.83 0.84
Sambar Rusa unicolor 1.02 0.70 0.66 0.68 0.67 0.75 0.74
Pig-tailed macaque 4.32 0.76 0.60 0.68 0.66 0.61 0.60
Macaca nemestrina
Red muntjac 7.10 0.68 0.57 0.63 0.62 0.56 0.56
Muntiacus muntjac
Mouse deer1 3.39 0.62 0.53 0.58 0.57 0.52 0.51
Tapir Tapirus indicus 0.85 0.43 0.52 0.48 0.48 0.52 0.53
Greater mouse deer Tragulus napu and lesser mouse deer Tragulus kanchil.
Results score, the prey mass adjusted score and the spatial and
prey mass adjusted score, with scores –% higher than
We had camera traps operating during – for a the next species (Table ). As for the spatial and tempo-
total of , trap nights. We obtained , photographs ral composite score, sambar and pig-tailed macaques also
of species, including mammals. We documented all six ranked second and third, respectively, for these additional
potential tiger prey species in all years of the study. We composite scores. The spatial adjusted composite scores
captured photographs of people times in study years for sambar and pig-tailed macaque were similar (sambar
( = , = , = , = ), and one domestic scored .% higher than pig-tailed macaque), but the differ-
dog in . ence was greater for the prey mass adjusted score and the
We recorded a total of tiger captures ( = , = , spatial and prey mass adjusted score (sambar scored %
= , = , = , = , = ), with an overall higher for both of these scores).
relative abundance of . ± SE . detections/ trap nights
per camera trap. We identified at least individual tigers in
left flank photographs and eight individuals in right flank Discussion
photographs (Supplementary Material ).
We documented , captures of potential prey species, The tiger is an important flagship species for conservation,
with red muntjacs being recorded most frequently, followed but remains threatened throughout its range (Seidensticker,
by pig-tailed macaques and mouse deer (Table ). Tigers ; Walston et al., ; Sibarani et al., ). Sumatran
exhibited a diurnal activity pattern (Fig. ) and had the high- tigers are categorized as Critically Endangered (Linkie et al.,
est temporal overlap with wild boar, followed by pig-tailed ) and tiger populations in Bukit Barisan Selatan Na-
macaques and sambar (Fig. , Table ). The highest spatial tional Park and other areas are threatened by encroach-
overlap was also with wild boar, followed by sambar and ment and habitat destruction (O’Brien & Kinnaird, ;
pig-tailed macaques (Table ). Pusparini et al., ), and by poaching of tigers and/or
When plotting the values indicating spatial and temporal their prey (Linkie et al., , ). Effective conservation
overlap of tigers with potential prey species, wild boar and is dependent on collaboration between countries, govern-
sambar deer fell in the upper right quadrant, suggesting they ment agencies, local communities, and scientific organiza-
are potentially preferred prey. Tapirs were in the lower left tions. The Tropical Ecology and Assessment Monitoring
quadrant, indicating they were probably not preferred, and Network is focused on open sharing of scientific data and
the other prey species were in the upper left (high temporal can be used as a model for data sharing amongst scientists
but low spatial overlap), indicating potential alternative prey and other stakeholders for conservation.
(Fig. ). We found tigers exhibited diurnal activity patterns, and
Tigers had the greatest spatio-temporal overlap with wild we created a composite score of spatial and temporal overlap
boar, with a spatial and temporal composite score of ., with potential prey species to provide insights into tiger prey
which is % higher than the species with the second highest preferences, which can inform conservation (e.g. Karanth
scores (sambar and pig-tailed macaques, both .; Table ). et al., ; Barber-Meyer et al., ). Previous studies in
The additional composite scores produced a similar the study area suggested tigers have a diurnal activity pat-
ranking to the spatial and temporal composite score. Wild tern (O’Brien et al., ), or a crepuscular pattern with
boar ranked highest for the spatial adjusted composite highest activity near dawn (Pusparini et al., ). The
Oryx, 2021, 55(2), 197–203 © The Author(s), 2020. Published by Cambridge University Press on behalf of Fauna & Flora International doi:10.1017/S0030605319000577
Downloaded from https://www.cambridge.org/core. University of Illinois at Urbana - Champaign Library, on 23 Feb 2021 at 13:12:39, subject to the Cambridge Core terms of use, available at
https://www.cambridge.org/core/terms. https://doi.org/10.1017/S0030605319000577Preferred prey of Sumatran tigers 201
FIG. 2 The temporal activity
(including % confidence
intervals) and overlap of the
kernel activity density of tigers
and potential prey species:
(a) mouse deer (including
greater mouse deer Tragulus
napu and lesser mouse deer
Tragulus kanchil), (b) pig-
tailed macaque Macaca
nemestrina, (c) red muntjac
Muntiacus muntjac, (d) sambar
deer Rusa unicolor, (e) tapir
Tapirus indicus, (f) wild boar
Sus scrofa. Tiger activity is
represented as solid lines and
prey activity as dotted lines,
with their temporal overlap
shown as the shaded area.
behaviour, or varying degrees of interactions with humans
or other species in different parts of the Park. For example,
Pusparini et al. () reported high rates of illegal human
activity (photographic captures of humans with guns) and
relative tiger abundances (relative abundance index = .)
that were an order of magnitude higher than in our study
(relative abundance index = .). This may have caused ti-
gers to change their activity patterns to avoid threats posed
by humans (e.g. Clinchy et al., ). Further research is re-
quired to ascertain reasons for these conflicting results from
the same Park and subpopulation.
A high degree of spatio-temporal overlap does not
necessarily indicate prey preference but it suggests po-
tential for high encounter rates between carnivores and
their prey, which is a key component of prey preference
(Holling, ; Fortin et al., ). Temporal overlap has
been posited as a way of determining prey preferences
FIG. 3 The spatial (area under curve; AUC) and temporal (kernel
density) overlap of tigers with potential prey species plotted
(Linkie & Ridout, ), but probably provides an incom-
together (with axes scaled to the reported values for ease of plete picture if spatial overlap is not included (e.g. O’Brien
comparison). et al., ). Other factors to be considered include prey
body size and potential avoidance strategies by prey species.
We created four composite index scores that included both
sample size of tiger captures in our study was lower than in temporal and spatial overlap. Each composite score appears
both previous studies, but our findings appear to confirm to accurately rank prey preference of tigers in Bukit Barisan
the diurnal activity pattern observed by O’Brien et al. Selatan National Park, with wild boar and sambar deer
(). Reasons for the observed differences could be being the most preferred, as predicted based on the find-
different sampling techniques, variation in individual tiger ings of Hayward et al. (). The spatial and temporal
Oryx, 2021, 55(2), 197–203 © The Author(s), 2020. Published by Cambridge University Press on behalf of Fauna & Flora International doi:10.1017/S0030605319000577
Downloaded from https://www.cambridge.org/core. University of Illinois at Urbana - Champaign Library, on 23 Feb 2021 at 13:12:39, subject to the Cambridge Core terms of use, available at
https://www.cambridge.org/core/terms. https://doi.org/10.1017/S0030605319000577202 M. L. Allen et al.
composite score was effective, but the scores including pre- should be conducted in other systems with known prey pre-
ferred prey mass better separated sambar and pig-tailed ferences of carnivores (e.g. from dietary analyses) to further
macaques as potential prey species for tigers. We used small evaluate the accuracy of this method, assess general applic-
(%) adjustments to create the adjusted composite scores, ability of the method, and further interpret the observed
and future studies in areas with known prey preferences relationships.
could conduct sensitivity analyses to determine ideal weight-
ing adjustments for spatial and temporal composite scores Acknowledgements All data used in this study were collected by
the Tropical Ecology Assessment and Monitoring Network, a collab-
to determine prey preference. oration between Conservation International, the Missouri Botanical
The different composite scores indicated mostly the same Garden, the Smithsonian Institution and the Wildlife Conservation
ranking amongst potential prey species, with the only excep- Society. The work was partially funded by these institutions, the
tion being tapirs ranking slightly higher than mouse deer in Gordon and Betty Moore Foundation, the Illinois Natural History
the spatial and mass adjusted composite score. Wild boar Survey, the Slovenian Research Agency (P4-0059), and other donors.
Monitoring activities were managed by the Wildlife Conservation
ranked highest in all cases, followed by sambar deer, and Society in collaboration with the Bukit Barisan Selatan National Park
these two species are frequently the preferred prey of tigers and the Ministry of Environment and Forestry, Republic of Indonesia.
throughout their range (Seidensticker & McDougal, ; We thank all field staff and forest rangers involved in camera-trap
Hayward et al., ; Basak et al., ). The greater overlap deployment, and W. Marthy for help in the field and coordination.
and composite scores for wild boar in this study site could
Author contributions Study concept: all authors; data collection:
be a result of wild boar having a relative abundance
MCS; statistical analyses: MLA; writing: MLA; revisions: all authors.
c. three times greater than sambar deer. Species with higher
abundance are probably more widely distributed across Conflicts of interest None.
the landscape, which could inflate their spatial overlap
with predators and potentially overestimate prey preference. Ethical standards This research abided by the Oryx guidelines on
ethical standards. The research was based on passive monitoring,
Red muntjac, pig-tailed macaque and mouse deer were
and did not involve human subjects, experimentation with animals
indicated as potential alternative prey species with inter- and/or collection of specimens.
mediate composite index scores and a position in the
upper left quadrant on the spatial and temporal overlap
plot (Fig. ), which indicates high temporal but low spatial References
overlap with tigers. Tapirs had low spatial and temporal
overlap with tigers, which corresponds to published data A L L E N , M.L., W I L M E R S , C.C., E L B R O C H , L.M., G O L L A , J.M. &
W I T T M E R , H.U. () The importance of motivation, weapons,
and suggests they may be non-preferred prey of tigers
and foul odors in driving encounter competition in carnivores.
(Hayward et al., ). Based on these results we suggest Ecology, , –.
that conservation efforts in the area should be focused on A L L E N , M.L., G U N T H E R , M.S. & W I L M E R S , C.C. () The scent of
wild boar and sambar deer, to ensure a robust prey base your enemy is my friend? The acquisition of large carnivore scent by
for this tiger population. We found evidence of illegal snares a smaller carnivore. Journal of Ethology, , –.
set for sambar deer in the Park, suggesting conservation A L L E N , M.L., P E T E R S O N , B. & K R O F E L , M. () No respect for apex
carnivores: distribution and activity patterns of honey badgers in the
actions may be necessary. Serengeti. Mammalian Biology, , –.
Prey preference is usually assessed using the ratio of prey B A R B E R -M E Y E R , S.M., J N AWA L I , S.R., K A R K I , J.B., K H A N A L , P.,
killed to prey available, and our study shows a potential al- L O H A N I , S., L O N G , B. et al. () Influence of prey depletion and
ternative method to predict prey encounter rates and pref- human disturbance on tiger occupancy in Nepal. Journal of Zoology,
erence. Determining the number of prey of different species , –.
B A S A K , K., M A N D A L , D., B A B U , S., K A U L , R., A S H R A F , N.V.K., S I N G H ,
killed by tigers, or numbers of prey available, can be costly A. & M O N D A L , K. () Prey animals of tiger (Panthera tigris tigris)
and time-intensive compared to using camera traps to col- in Dudhwa landscape, Terai Region, North India. Proceedings of the
lect relative abundance data. Our method of plotting spatial Zoological Society, , –.
and temporal overlap between predator and prey species and B E G O N , M., T O W N S E N D , C.R. & H A R P E R , J.L. () Ecology: From
creating composite index scores from camera-trap data could Individuals to Ecosystems. th edition. Blackwell Publishing, Oxford,
UK.
be useful for inferring the encounter rates of carnivores
C L I N C H Y , M., Z A N E T T E , L.Y., R O B E R T S , D., S U R AC I , J.P., B U E S C H I N G ,
with prey and appears to have correctly ranked the prey pre- C.D., N E W M A N , C. & M AC D O N A L D , D.W. () Fear of the human
ferences for Sumatran tigers. The inclusion of prey mass ap- ‘super predator’ far exceeds the fear of large carnivores in a model
peared to improve upon the spatial and temporal composite mesocarnivore. Behavioral Ecology, , –.
score, and including mass or other variables such as abun- D U P R E E Z , B., P U R D O N , J., T R E T H O WA N , P., M AC D O N A L D , D.W. &
L OV E R I D G E , A.J. () Dietary niche differentiation facilitates
dance or habitat preference may facilitate more effective
coexistence of two large carnivores. Journal of Zoology, , –.
inference in future studies, which could also fine-tune the F I E L D I N G , A.H. & B E L L , J.F. () A review of methods for the
values used in the adjusted composite scores. Further test- assessment of prediction errors in conservation presence/absence
ing of a similar composite score for spatio-temporal overlap models. Environmental Conservation, , –.
Oryx, 2021, 55(2), 197–203 © The Author(s), 2020. Published by Cambridge University Press on behalf of Fauna & Flora International doi:10.1017/S0030605319000577
Downloaded from https://www.cambridge.org/core. University of Illinois at Urbana - Champaign Library, on 23 Feb 2021 at 13:12:39, subject to the Cambridge Core terms of use, available at
https://www.cambridge.org/core/terms. https://doi.org/10.1017/S0030605319000577Preferred prey of Sumatran tigers 203
F O R T I N , D., B U O N O , P.L., S C H M I T Z , O.J., C O U R B I N , N., L O S I E R , C., the Critically Endangered Sumatran tiger Panthera tigris sumatrae in
S T -L A U R E N T , M.H. et al. () A spatial theory for characterizing an ‘in danger’ UNESCO world heritage site. Oryx, , –.
predator–multiprey interactions in heterogeneous landscapes. R C O R E T E A M () R: a Language and Environment for Statistical
Proceedings of the Royal Society B: Biological Sciences, , . Computing. R Foundation for Statistical Computing, Vienna,
G O O D R I C H , J.M., L Y A M , A., M I Q U E L L E , D.G., W I B I S O N O , H.T., Austria. R-project.org [accessed February ].
K AWA N I S H I , K., P AT T A N AV I B O O L , A. et al. () Panthera tigris. R A M A K R I S H N A N , U., C O S S , R.G. & P E L K E Y , N.W. () Tiger decline
In The IUCN Red List of Threatened Species, e.TA. caused by the reduction of large ungulate prey: evidence from a study
dx.doi.org/./IUCN.UK.-.RLTS.TA.en of leopard diets in southern India. Biological Conservation, , –.
[accessed February ]. R I C H , L.N., M I L L E R , D.A.W., R O B I N S O N , H.S., M C N U T T , J.W. &
H A Y WA R D , M.W., J E D R Z E J E W S K I , W. & J E D R Z E W S K A , B. () Prey K E L LY , M.J. () Using camera trapping and hierarchical
preferences of the tiger Panthera tigris. Journal of Zoology, , occupancy modelling to evaluate the spatial ecology of an African
–. mammal community. Journal of Applied Ecology, , –.
H O L L I N G , C.S. () The components of predation as revealed by a R I C H , L.N., M I L L E R , D.A.W., M U Ñ O Z , D.J., R O B I N S O N , H.S.,
study of small mammal predation of the European pine sawfly. M C N U T T , J.W. & K E L LY , M.J. () Sampling design and
The Canadian Entomologist, , –. analytical advances allow for simultaneous density estimation of
KARANTH, K.U., N I C H O L S , J.D., K U M A R , N.S., L I N K , W.A. & H I N E S , J.E. seven sympatric carnivore species from camera trap data. Biological
() Tigers and their prey: predicting carnivore densities from Conservation, , –.
prey abundance. Proceedings of the National Academy of Sciences of R I D O U T , M.S. & L I N K I E , M. () Estimating overlap of daily activity
the United States of America, , –. patterns from camera trap data. Journal of Agricultural, Biological,
L I N K I E , M. & R I D O U T , M.S. () Assessing tiger–prey interactions in and Environmental Statistics, , –.
Sumatran rainforests. Journal of Zoology, , –. R O V E R O , F. & Z I M M E R M A N N , F. () Camera Trapping for Wildlife
L I N K I E , M., M A R T Y R , D.J., H O L D E N , J., Y A N U A R , A., H A R T A N A , A.T., Research, st edition. Pelagic Publishing, Exeter, UK.
S U G A R D J I T O , J. & L E A D E R -W I L L I A M S , N. () Habitat S A G G I O M O , L., P I C O N E , F., E S A T T O R E , B. & S O M M E S E , A. () An
destruction and poaching threaten the Sumatran tiger in Kerinci overview of understudied interaction types amongst large
Seblat National Park, Sumatra. Oryx, , –. carnivores. Food Webs, , –.
L I N K I E , M., W I B I S O N O , H.T., M A R T Y R , D.J. & S U N A R T O , S. () S A N D E R S O N , E.W., F O R R E S T , J., L O U C K S , C., G I N S B E R G , J.,
Panthera tigris ssp. sumatrae. In The IUCN Red List of Threatened D I N E R S T E I N , E., S E I D E N S T I C K E R , J. et al. () Setting priorities for
Species, e.TA. dx.doi.org/./IUCN.UK.. tiger conservation: –. In Tigers of the World, nd edition
RLTS.TA.en [accessed February ]. (eds R. Tilson & P. Nyhusad), pp. –. Academic Press,
M E R E D I T H , M. & R I D O U T , M. () Overview of the overlap package. Cambridge, USA.
R Project. cran.radicaldevelop.com/web/packages/overlap/ S C H O E N E R , T.W. () Resource partitioning in ecological
vignettes/overlap.pdf [accessed April ]. communities. Science, , –.
M I Q U E L L E , D.G., S M I R N O V , E.N., M E R R I L L , T.W., M Y S L E N KO V , A.E., S E I D E N S T I C K E R , J. () Saving wild tigers: a case study in
Q U I G L E Y , H.B., H O R N O C K E R , M.G. & S C H L E Y E R , B. () biodiversity loss and challenges to be met for recovery beyond .
Hierarchical spatial analysis of Amur tiger relationships to habitat Integrative Zoology, , –.
and prey. In Riding the Tiger: Tiger Conservation in S E I D E N S T I C K E R , J.C. & M C D O U G A L , C. () Tiger predatory
Human-Dominated Landscapes (eds J. Seidensticker, S. Christie & behaviour, ecology and conservation. Symposia of the Zoological
P. Jackson), pp. –. Cambridge University Press, Cambridge, UK. Society of London, , –.
N G O P R A S E R T , D., L Y N A M , A.J., S U K M A S U A N G , R., T A N T I P I S A N U H , N., S I B A R A N I , M.C., D I M A R C O , M., R O N D I N I N I , C. & K A R K , S. ()
C H U T I P O N G , W., S T E I N M E T Z , R. et al. () Occurrence of three Measuring the surrogacy potential of charismatic megafauna species
felids across a network of protected areas in Thailand: prey, across taxonomic, phylogenetic and functional diversity on a
intraguild, and habitat associations. Biotropica, , –. megadiverse island. Journal of Applied Ecology, , –.
N O WA K , R.M. () Walker’s Mammals of the World, th edition. S O N G , M.-K., L I N , F.-C., W A R D , S.E. & F I N E , J.P. () Composite
John Hopkins University Press, Baltimore, USA. variables: when and how. Nursing Research, , –.
O’B R I E N , T.G. & K I N N A I R D , M.F. () Birds and mammals of the S WA N S O N , A., K O S M A L A , M., L I N T O T T , C., S I M P S O N , R., S M I T H , A. &
Bukit Barisan Selatan National Park, Sumatra, Indonesia. Oryx, P A C K E R , C. () Snapshot Serengeti, high-frequency annotated
, –. camera trap images of mammalian species in an African savanna.
O’B R I E N , T.G., K I N N A I R D , M.F. & W I B I S O N O , H.T. () Crouching Scientific Data, , .
tigers, hidden prey: Sumatran tiger and prey populations in a TEAM N E T W O R K () Terrestrial Vertebrate Protocol
tropical forest landscape. Animal Conservation, , –. Implementation Manual, version .. Tropical Ecology, Assessment
P A R S O N S , A.W., F O R R E S T E R , T., M C S H E A , W.J., B A K E R -W H AT T O N , and Monitoring Network, Center for Applied Biodiversity Science,
M.C., M I L L S P A U G H , J.J. & K A Y S , R. () Do occupancy or Conservation International, Arlington, USA.
detection rates from camera traps reflect deer density? Journal of W A L S T O N , J., R O B I N S O N , J.G., B E N N E T T , E.L., B R E I T E N M O S E R , U.,
Mammalogy, , –. D A F O N S E C A , G.A.B., G O O D R I C H , J. et al. () Bringing the tiger
P U S P A R I N I , W., B AT U B A R A , T., S U R A H M AT , F., A R D I A N T I O N O , back from the brink—the six percent solution. PLOS Biology,
S U G I H A R T I , T., M U S L I C H , M. et al. () A pathway to recovery: , e.
Oryx, 2021, 55(2), 197–203 © The Author(s), 2020. Published by Cambridge University Press on behalf of Fauna & Flora International doi:10.1017/S0030605319000577
Downloaded from https://www.cambridge.org/core. University of Illinois at Urbana - Champaign Library, on 23 Feb 2021 at 13:12:39, subject to the Cambridge Core terms of use, available at
https://www.cambridge.org/core/terms. https://doi.org/10.1017/S0030605319000577You can also read