Hemispheric asymmetry in visual processing: an ERP study on spatial frequency gratings
←
→
Page content transcription
If your browser does not render page correctly, please read the page content below
Preprints (www.preprints.org) | NOT PEER-REVIEWED | Posted: 4 January 2021                                    doi:10.20944/preprints202101.0031.v1

     Article

     Hemispheric asymmetry in visual processing: an ERP study
     on spatial frequency gratings
     Alice Mado Proverbio 1, *, and Alberto Zani 2

                                       1 Dept. of Psychology, University of Milano-Bicocca, mado.proverbio@unimib.it
                                       2 School of Psychology, Vita-Salute San Raffaele University, zani.alberto@hsr.it
                                       * Correspondence: AMP mado.proverbio@unimib.it

                                       Abstract: A hemispheric asymmetry is known for the processing of global vs. local visual in-
                                       formation. In this study, we investigated the existence of a hemispheric asymmetry for visual
                                       processing of low vs. high spatial frequency gratings. Event-related potentials were recorded
                                       in a group of healthy right-handed volunteers from 30 scalp sites. Six types of stimuli (1.5, 3
                                       and 6 c/deg gratings) were randomly flashed 180 times in the left and right upper hemi-fields.
                                       Stimulus duration was 80 ms and ISI ranged between 850-1000 ms. Participants had to pay
                                       attention and respond to targets based on their spatial frequency and location, or to passively
                                       look at the stimuli. C1 and P1 visual responses, as well as a later Selection negativity and a P300
                                       components of ERPs were quantified and subjected to repeated-measure ANOVAs. Overall,
                                       performance was faster for the RVF, thus suggesting a left hemispheric advantage for atten-
                                       tional selection of local elements. Similarly, the analysis of mean area amplitude of C1 (60-110
                                       ms) sensory response showed a stronger attentional effect (F+L+ vs. F-L+) at left occipital areas,
                                       thus suggesting the sensory nature of this hemispheric asymmetry.

                                       Keywords: ERPs; selective attention; global/local; cerebral hemispheres; VEPs; spatial fre-
                                       quency; Attentional tuning; Left hemisphere

                                      1. Introduction

                                                  The issue of a hemispheric asymmetry in perceptual processing of visual infor-
                                           mation has been largely debated [1,2,3,4,5,6,7,8,9,10]. The main lines of research and theo-
                                           retical discussions have led to the conclusion that there might be a hemispheric asymmetry:
                                           i) in the way the left and right hemisphere process information in an analytic vs. holistic
                                           manner, or ii) in the way they select object features as opposed to pay sustained attention in
                                           space. Finally, iii) it was argued that, probably, the two hemispheres possess functional and
                                           neuroanatomical differences that render them more able to process information based on a
                                           low vs. high spectrum of spatial frequency (magno- vs. parvo-cellular content). These three
                                           approaches and the experimental evidence in their support are briefly discussed below.
                                           1.1. A role of the right vs. left hemisphere in global/local processing

                                                 Robertson and coauthors [11] theorized that a hemispheric asymmetry existed for pro-
                                           cessing of global vs. local content of visual information, with a left hemispheric advantage
                                           for the local analysis and a right hemispheric advantage for the global analysis. In an inter-
                                           esting neuropsychological study, Robertson et al. [12] found that a left temporo/parietal le-
                                           sion compromised the patients’ ability to reproduce the local elements of both geometrical
                                           and linguistic hierarchical stimuli (so-called Navon configurations [13]), while a right-sided
                                           lesion compromised the patients’ ability to reproduce their global form.

               © 2021 by the author(s). Distributed under a Creative Commons CC BY license.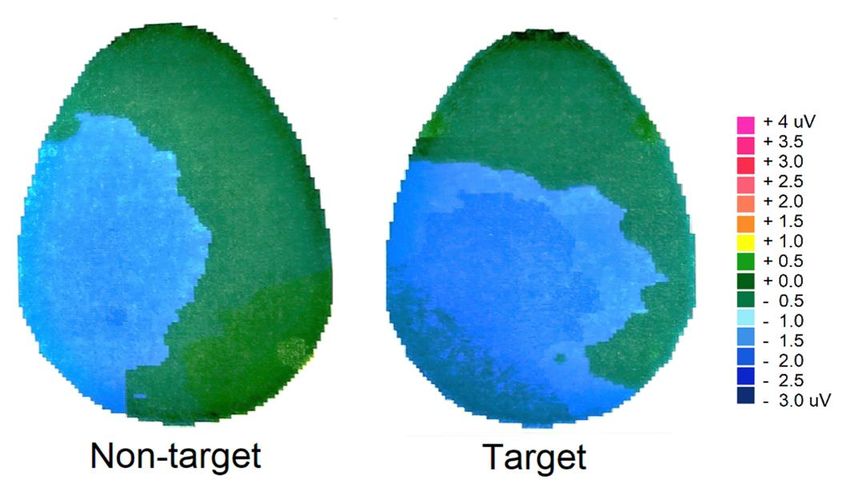
Preprints (www.preprints.org) | NOT PEER-REVIEWED | Posted: 4 January 2021                     doi:10.20944/preprints202101.0031.v1

                                  These findings are consistent with the existence of a left-lateralized brain network for local
                                 (vs. global) stimulus processing [14,15,16]. For example, using a task in which participants
                                 were instructed to recognize a target letter (within compound stimuli) at the hierarchical level
                                 (local or global), indicated by a pre-stimulus cue, Yamaguchi and colleagues [6] found that the
                                 local and global targets elicited an increased N2 response (250–350 ms) over the left and right
                                 hemispheres, respectively. In another event-related potential (ERP) study, a larger negativity
                                 (N2) was elicited by the perception of small illusory contours of a Kanizsa square over the left
                                 occipital regions [17], consistent with the idea of left-sided object-based feature selection and
                                 local (vs. global) stimulus processing [16,18].
                                  1.2. Object-based vs. space-based hemispheric asymmetry

                                        At the same time, evidence from several studies seems to suggest left-lateralized neural
                                 substrates underlying object-based (vs. space-based) focused selective attention [9,19,20,21]. In
                                 an ERP study by Proverbio et al. (2004) participants were presented with images of familiar
                                 objects and animals that were associated or not-associated with their prototypical color (e.g., a
                                 pink vs a blue piglet). They were instructed to pay heed either to the shape or to the color of
                                 the stimuli, ignoring the other trait. Target stimuli associated with the prototypical color/shape
                                 combination elicited a larger N2 component (or selection negativity, SN) over posterior scalp
                                 sites as compared with the not-associated combination, during the attention to color condition
                                 only. This effect was found over the left but not the right hemisphere, as also confirmed by the
                                 topographic mapping of voltage distribution computed on the difference wave (associated fea-
                                 tures minus not-associated features targets). These results seem to suggest a specific involve-
                                 ment of the left occipito-temporal cortex for a conjoined color/ shape processing of objects.
                                 Similarly, Orlandi and Proverbio [22] have shown a left-hemispheric selectivity in the abil-
                                 ity to discriminate object-shapes, as indexed by the amplitude of SN response. Participants
                                 were presented with 3D images of shapes of wooden dummies, chairs, and Shepard cubes
                                 displayed in standard or rotated views, in many different orientations. They were instructed
                                 to pay attention to and select via a button-press one given target shape. The results showed a
                                 left hemispheric advantage for the attentional selection, resulting in an enhanced SN to targets,
                                 over left occipito/temporal sites. The swLORETA performed on EEG signals in the SN time
                                 range (240–280 ms) showed left lateralized neural sources, including the left superior/middle
                                 temporal (BA 22) and the left inferior frontal/precentral gyri. On the other side, many different
                                 studies support the view of a right hemispheric control and dominance for visuospatial orient-
                                 ing of attention [e.g., 23,24,25].
                                  1.3. The spatial frequency hypothesis

                                  According to some researchers [10,18,26,27] asymmetry in perceptual strategy would be
                                 grounded on a lower-level (sensory) hemispheric asymmetry for processing the spatial fre-
                                 quency content of visual information. There would be a right hemispheric advantage for pro-
                                 cessing the low-spatial frequency range, and a left hemispheric greater ability for processing
                                 finer details, such as the high-spatial frequency spectrum. Dos Santos et al. [28] investigated
                                 the hemispheric specialization for spatial frequency processing by measuring the contrast sen-
                                 sitivity curves of sinusoidal gratings in 30 patients with left or right brain damage. The results
                                 showed that patients with left brain damage were selectively impaired in high frequency pro-
                                 cessing, while patients with right brain damage were more impaired in low frequency pro-
                                 cessing. These findings can be interpreted in terms of a hemispheric asymmetry for spatial
                                 frequency discrimination.

                                  Furthermore, the electrophysiological investigation by Martínez et al. [27] reported a larger
                                 SN component in response to target than non-target checkboard patterns. The attentional se-
                                 lection of high spatial frequencies (5 c/deg) elicited larger SN responses over the left hemi-
                                 sphere, while the attention selection of low spatial frequencies (0.8 c/deg) elicited larger SN
                                 responses over the right hemisphere, thus indicating a hemispheric asymmetry for spatial fre-
                                 quency processing. Similarly, Proverbio et al. [26] recorded visual evoked potentials to spatial
Preprints (www.preprints.org) | NOT PEER-REVIEWED | Posted: 4 January 2021                       doi:10.20944/preprints202101.0031.v1

                                 frequency gratings and found that the N80/P1 responses were differentially modulated by spa-
                                 tial frequency content. The N80 showed a negative focus (current sink), centered at mesial-
                                 occipital areas, while the P1 showed a positive focus (current source), centered at lateral-occip-
                                 ital regions of the scalp. The current source was much more prominent than the sink for lower
                                 spatial frequency, and vice versa. Moreover, the positive focus (P1) was larger over the right
                                 side of the scalp, whereas the current sink (N80) shifted from the right to the left side as spatial
                                 frequency increased. The authors concluded that visual sensory-evoked potentials elicited by
                                 low versus high spatial frequencies had different polarity and topographic localization, that
                                 might reflect the activation of functionally distinct, topographically segregated, neural gener-
                                 ators differentially activated as a function of spatial frequency.

                                        These results of a hemispheric asymmetry for sensory processing are also consistent with
                                 those reported by Zani and Proverbio [29] in their ERP study on selective attention to check-
                                 size. In that study, relevant checks elicited larger ERP components at both occipital (N165 and
                                 P3b) and frontal (LP, long latency positivity) scalp sites over the left but not the right hemi-
                                 sphere as compared to the irrelevant ones. Moreover, right-and left-sided hemispheric asym-
                                 metries were found being consistent with a P90 right-sided specialization for low spatial fre-
                                 quencies, and a N115 left-sided specialization for high spatial frequencies, respectively.

                                       Notwithstanding the bulk of evidence of left sided attentional ERP components
                                 (such as Selection Negativity or N2 responses), the evidence of lateralized attention effects
                                 indexed by sensory VEPs are quite scarce. In the present study, visual ERPs were recorded
                                 in healthy participants during perception and attentional selection of non-square/wave
                                 spatial frequency gratings. Sensory responses C1 and P1 were measured to obtain data
                                 about a possible hemispheric asymmetry in attentional selection. Longer-latency Selection
                                 Negativity and P300 responses were also measured and an increase in their amplitude as
                                 result of attentional selection was expected based on previous investigations of Harter’s
                                 research group [30,31,32].

                                       There is multiple evidence in psychophysiological literature that the morphology of
                                 visual sensory components (C1 and P1) is strongly modulated by a series of stimulus phys-
                                 ical characteristics, such as the orientation, the spatial frequency and the visual field of
                                 presentation of gratings and checkerboards [33,34,35,36]. On the basis of previous litera-
                                 ture, we expected that C1 would be larger at ipsilateral sites, whereas P1 would be larger
                                 at contralateral sites. Moreover, C1 would have a mesial-occipital distribution and P1 a
                                 lateral-occipital distribution [26]. Finally, it was expected an early object-based attention
                                 modulation of both C1 and P1 responses [e.g., 37].

                                  2. Materials and Methods
                                  2.1. Participants

                                       Eight healthy students (4 females and 4 males) with normal or lens-corrected vision
                                 took part in the study. Their mean age was 28.5 years, and their socio/economic and cultural
                                 levels were similar. All participants were psychically and neurologically healthy. Before the
                                 EEG registration, they were asked to fill in the informed consent to the research and the docu-
                                 mentation regarding the minimum risk. They were then administered the Edinburgh Inven-
                                 tory to assess their right-handedness. Experiments were conducted with the understanding
                                 and written consent of each participant according to the Declaration of Helsinki (BMJ 1991;
                                 302: 1194), and approval of the local ethical committee (University of Trieste). One subject was
                                 discarded in subsequent statistical analyses for excessive ocular artifacts.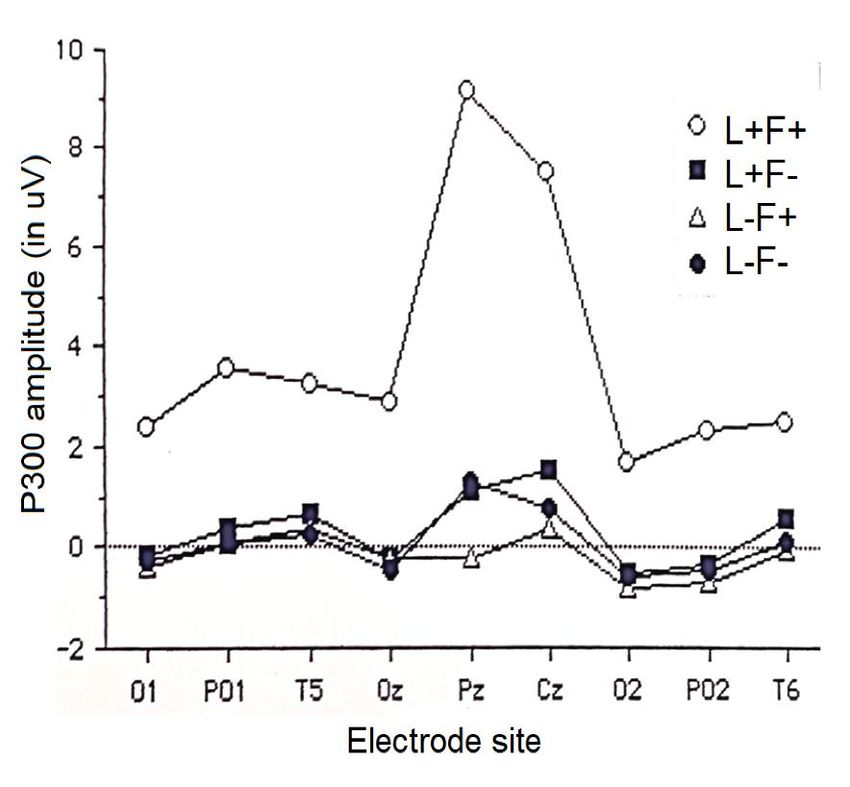
Preprints (www.preprints.org) | NOT PEER-REVIEWED | Posted: 4 January 2021                   doi:10.20944/preprints202101.0031.v1

                                  2.2.Stimuli

                                       Stimuli were three spatial frequency gratings whose contrast was degraded to obtain
                                 a quasi-sinusoidal luminance variation. Their spatial frequency was 1.5, 3 and 6 cycles
                                 degree (c/deg) at the viewing distance of 114 cm, respectively. Gratings were briefly
                                 flashed in the upper left or right visual hemifields, with respect to the center of the screen
                                 where a small cross acted as fixation point.

                                       The background was gray and isoluminant with respect to gratings to avoid percep-
                                 tual after effects or consecutive image phenomena. Within each quadrant, the stimulation
                                 started at 0 30' of visual angle above the fixation point and extended up to 4° 30' above it,
                                 while laterally the stimulus started from 2° and went up to 6° 03'. The stimulus duration
                                 was 80 ms. Interstimulus interval (ISI) ranged randomly between 850 and 1000 ms. Since
                                 participants had to keep their gaze on the fixation point, the decentralization of the stimuli
                                 allowed the stimulation of the extrafoveal retinal areas. The gratings presented to the left
                                 or to the right with respect to the fixation point were reversed by 180° in order to obtain
                                 specular stimuli that provided an identical cortical representation whether they were pro-
                                 jected to the right or left of the hemi-retinas.
                                  2.3.Procedure

                                       Participants sat inside a silent cubicle with medium soundproofing and weak sym-
                                 metrical lighting in front of a double-glazed window measuring 70x55 cm. Outside the
                                 cubicle was a 17" Macintosh monitor used for the presentation of visual stimuli that was
                                 connected to an IBM PC controlling stimulus presentation, located outside the cubicle. A
                                 30 channels "Electro-Cap" cap was applied to each subject for recording his or her EEG
                                 waves. Two extra pairs of surface electrodes were applied to record vertical and horizontal
                                 ocular movements (EOG). Averaged-ears acted as reference electrodes. All the electrodes
                                 were connected to a panel interfaced with a 32-channel SynAmps amplifier. The amplifi-
                                 cation unit was in turn connected to another IBM PC in which "NeuroScan 3.0" software
                                 controlled the continuous recording of the EEG traces, and stimulus/response synchroni-
                                 zation. The subjects responded through a "StimPad" push-button panel interfaced with
                                 "NeuroScan 3.0" software, so that the response signals, recorded on the rough traces, might
                                 later be analyzed through "Respwin" software in order to obtain the data relating to the
                                 behavioral performance of the subject.

                                       Subjects were provided with written instructions describing the experimental task.
                                 A "training" phase preceded the experimental session, so that participants might familiar-
                                 ize with the different types of stimuli and experimental setting. This training phase ended
                                 when the subject showed an optimal ability to discriminate the various spatial sequences
                                 of gratings.

                                        The six types of stimuli (3 frequencies for 2 locations) were projected in random order
                                 180 times (30 repetitions for each type of stimulus). Participants were administered 30 dif-
                                 ferent sequences (of 180 stimuli each), featuring a specific stimulus selection task require-
                                 ment. At the beginning of each run, subjects were given the experimental instructions of
                                 paying attention to gratings of one specific frequency at one spatial location (e.g., "during
                                 this run, pay attention and respond to the high frequency grating to the right visual field,
                                 and ignore all other types of stimuli"). Participants were instructed to press a button with
                                 the index finger of one of the two hands as quickly and efficiently as possible, while ig-
                                 noring non-target stimuli. In half of the trials subjects used the right hand and in the re-
                                 maining half the left hand. The order of the hands was randomized between trials and
                                 between subjects. There were four attentional conditions: attention to 6/deg spatial fre-
                                 quency gratings on the right, to 6/deg spatial frequency gratings on the left, to 1.5 c/deg
                                 spatial frequency gratings on the right and to 1.5 c/deg spatial frequency gratings on the
                                 left. 3 c/deg spatial frequency gratings were included as distractor stimuli since they were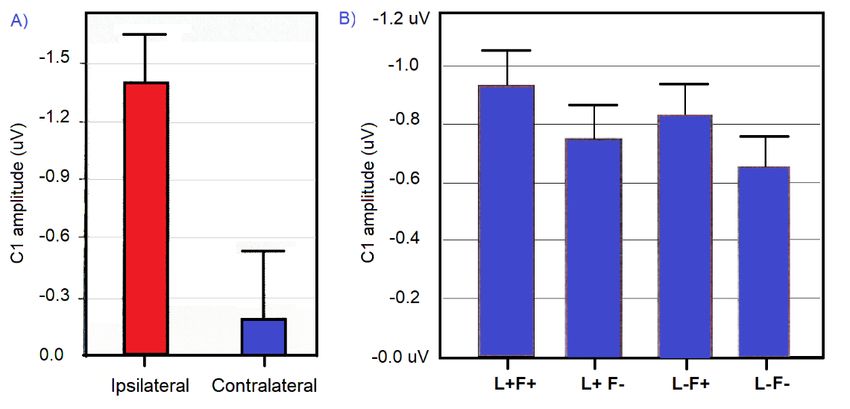
Preprints (www.preprints.org) | NOT PEER-REVIEWED | Posted: 4 January 2021                       doi:10.20944/preprints202101.0031.v1

                                 never a target. Stimuli might therefore be target in both spatial frequency and location
                                 (L+F+), target only in location (L+F-), target only in spatial frequency (L-F+) and non-tar-
                                 gets (L-F-).
                                  2.4. EEG recordings

                                       EEG data were continuously recorded from 30 scalp sites according to the 10–20 Interna-
                                 tional System at a sampling rate of 500 Hz. Two pairs of bipolar electrodes were applied to
                                 the subject for the detection of saccades and vertical eye movements. Two electrodes
                                 placed on the earlobes were used as reference electrodes, while the ground electrode was
                                 included in the recording cap in the center-frontal position. The EEG and electro-oculogram
                                 (EOG) were filtered with a half-amplitude band pass of 0.016–50 Hz. Electrode impedance was
                                 maintained below 5 kΩ. Computerized artifact rejection was performed prior to averaging in
                                 order to discard epochs in which ocular movements, blinks or other artifacts occurred. The
                                 artifact rejection criterion was a peak-to-peak amplitude exceeding 50 μV and resulted in a
                                 rejection rate of ∼15%. Event-related potentials (ERPs) going from 100 ms before through
                                 1000 ms after stimulus onset were averaged off-line. ERP components were measured when in
                                 time and where on scalp they reached their maximum amplitudes.
                                  2.5. Statistical analysis

                                       For each subject mean area amplitude values of C1 (60-110 ms), P1 (110-160 ms), Selection
                                 Negativity (N2, 165-330 ms) and P300 (330-600 ms) ERP responses were quantified and sub-
                                 jected to repeated-measures analyses of variance (ANOVA). ERP responses to target gratings
                                 (1.5 c/deg left, 1.5 c/deg right, 6 c/deg left, 6 c/deg right) gratings were compared to the re-
                                 sponses to the same gratings in the other attention condition (when irrelevant, when shared
                                 one feature (i.e., either frequency or location) with target, or when target). Factors were Atten-
                                 tional condition, Hemisphere (for C1 and P1 component) and Electrode. Attention condition
                                 had 4 levels of variance: target (L+F+), location specific (L-F+), frequency specific (L+F-), irrel-
                                 evant (L-F-). Hemisphere had 2 levels of variance (left and right). Electrode had 3 levels of
                                 variance: occipital (O1,O2), lateral-occipital (OL-OR), occipito/temporal (T5-T6) for sensory
                                 components C1 and P1, and 9 levels for later components Selection Negativity and P300 (O1,
                                 O2, OL, OR, T5, T6, Oz, Cz, Pz).

                                       Response times (RTs) and the percentage of correct responses (hits) were recorded and
                                 quantified. RTs that exceeded the mean value ±2 standard deviations were discarded, which
                                 resulted in a rejection rate of approximately 5%. Both RTs and accuracy percentages were sub-
                                 jected to separate multifactorial repeated-measures ANOVAs with 3 within-subjects factors,
                                 whose factors of variability were: visual field of presentation (left or right), grating spatial fre-
                                 quency (1.5 or 6 c/deg), response hand (left or right).

                                  3. Results
                                  3.1. Behavioural data

                                       The analysis of variance performed on the response times of the subjects did not result
                                 in any statistical significance, except for a very close to significance visual field factor for
                                 reaction times analyses (F(1,6)=5.6, p=0.055). Response times were faster when stimuli
                                 were presented in the right visual field (RVF, left hemisphere) compared to the left
                                 visual field (LVF, right hemisphere). False alarms responses incorrectly directed to
                                 non-targets (i.e., 3 c/deg gratings) were less than 2% of the total amount of emitted
                                 responses. Omissions (lack of response to 1.5 and 6 c/deg target gratings) was slightly
                                 superior to 3 % of emitted responses. Accuracy analyses did not yield any statistical sig-
                                 nificance.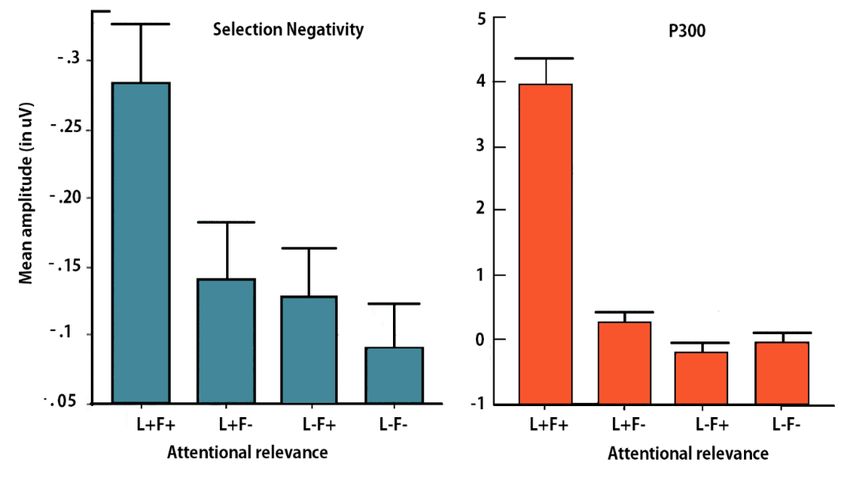
Preprints (www.preprints.org) | NOT PEER-REVIEWED | Posted: 4 January 2021                   doi:10.20944/preprints202101.0031.v1

                                  3.2.Electrophysiological data
                                  C1 component.

                                       C1 response was much larger in the ipsilateral than contralateral field (see Fig.
                                 1), as shown by hemisphere per visual field factors interaction (F (1,6)=14.3, p
Preprints (www.preprints.org) | NOT PEER-REVIEWED | Posted: 4 January 2021 doi:10.20944/preprints202101.0031.v1
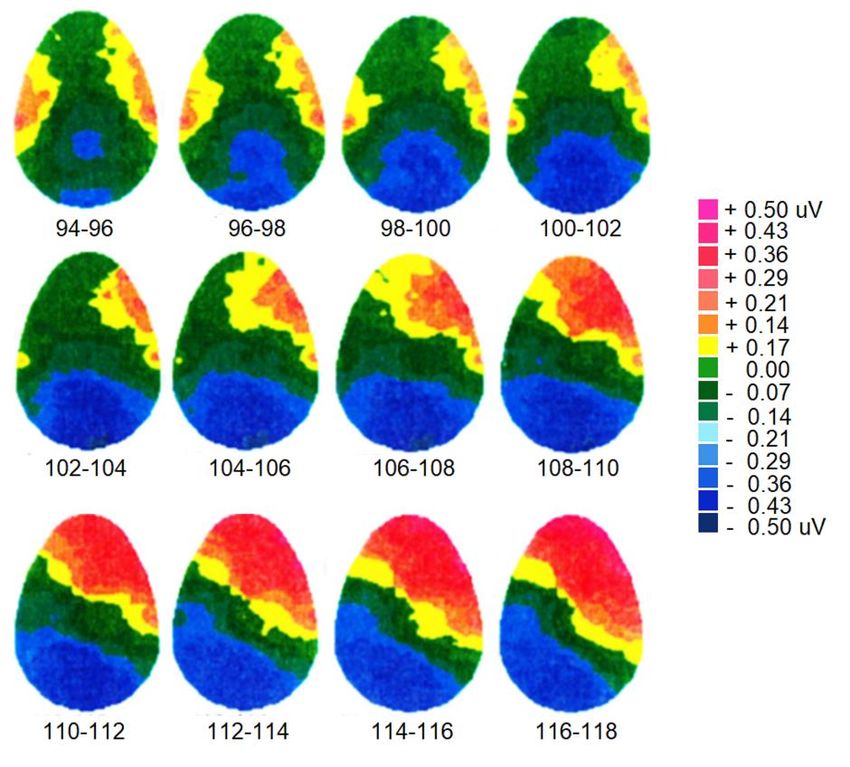
Figure 2. Effect of spatial frequency specific attentional selection (L+F+ minus L+F-), re-
gardless of visual field of presentation. Temporal series of topographical distribution of
surface voltage (top view) recorded between 94 and 118 ms of post-stimulus latency (every
2 ms) in the C1 latency range. The data indicate an early enhanced negativity (larger C1
response) to target frequencies focused over mesial-occipital scalp areas, which progres-
sively spread over the scalp in time. It is also visible a hemispheric asymmetry in the topo-
graphical distribution of attentional selection. The asymmetry would indicate a greater
ability of the left visual cortex in the discrimination of fine differences in spatial frequency.
C1 response was strongly modulated by attentional factors, in interaction with cere-
bral hemisphere (F(4,24) =3.8, pPreprints (www.preprints.org) | NOT PEER-REVIEWED | Posted: 4 January 2021 doi:10.20944/preprints202101.0031.v1
Figure 3. Topographical maps (top view) of scalp voltage of C1 component recorded in re-
sponse to 1.5 c/deg gratings in the left visual field, when target and when non-target. As can
be observed, the response was ipsilateral to the stimulated field, and was modulated by atten-
tion, being more negative to target- than non-target gratings.
P1 Component.
The significant electrode factor showed that P1 was more focused over occipital (O1,
O2, OL, OR) than infero/temporal scalp areas (F (2,12)= 4.68, pPreprints (www.preprints.org) | NOT PEER-REVIEWED | Posted: 4 January 2021 doi:10.20944/preprints202101.0031.v1
post hoc comparisons, p=0.0001). The attentional effect was smaller for stimuli pre-
sented in the LVF (right hemisphere) as shown by the significant triple interaction of
Attention x Electrode x Hemisphere (F(8,48)=2.2, pPreprints (www.preprints.org) | NOT PEER-REVIEWED | Posted: 4 January 2021 doi:10.20944/preprints202101.0031.v1
Figure 6. Mean area values recorded in response to spatial frequency gratings when target and
when task-irrelevant, at various central, parietal and posterior scalp sites, regardless of spatial
frequency of stimulation. A maximum distribution of this ERP component at midline cen-
tro/parietal scalp areas can be clearly observed.
4. Discussion
Aim of this study was to explore the existence of hemispheric asymmetries for
attentional selection of spatial frequency gratings. Overall, RTs to target gratings pre-
sented in the RVF (left hemisphere) were faster than those to stimuli presented in the
LVF (right hemisphere), regardless of gratings spatial frequency and response hand.
This would support the hypothesis according to which the left hemisphere would
have a greater selective capacity in subtle discrimination tasks [38], a more analytical
attentional strategy [39], and would be dominant in object-based attentional selection
[9].
Moreover, ERP data showed that selective attention modulated the earliest sen-
sory responses. C1 was enhanced in negativity in response to targets (L+F+) than fre-
quency-specific stimuli (L+F-). In turn, C1 elicited by the latter was more negative than
that elicited by spatial frequency gratings irrelevant in both features. These results fit
well with the more recent literature on ERP attentional modulation of striate cortex
during selective attention to grating spatial frequency [37,40].
P1 was also modulated by attention, being more positive to targets than location-
specific stimuli. In turn, irrelevant stimuli elicited a smaller P1 than gratings sharing
only one feature with target. As predicted by the literature, C1 was larger to ipsilateral
stimuli [41,42] and enhanced in negativity by attention [43], while P1, focused on lat-
eral occipital sites and enhanced in positivity by attention [44,37], was larger to con-
tralateral stimuli.
The attentional effects grew as post-stimulus processing latency increased and
showed a more focused attentional gating for later latency components. Indeed, Selec-Preprints (www.preprints.org) | NOT PEER-REVIEWED | Posted: 4 January 2021 doi:10.20944/preprints202101.0031.v1
tion negativity, and even more, P300 responses were strongly enhanced by spatial fre-
quency targetness, and less responsive to the attentional relevance of one single fea-
ture (either location or spatial frequency of gratings). This evidence fits well with pre-
vious ERP literature on spatial frequency selection [45,30,31,32,27], demonstrating that
the bandwidth of selective attention effect narrowed during the processing time course.
In the present investigation, the most interesting piece of data was the hemi-
spheric asymmetry in attentional selection, evidenced by C1 and P1 sensory re-
sponses, also fitting with behavioral data trend. Indeed, C1 (60-100 ms) data showed
that for both 6 c/deg gratings (p=0.0008) and 1.5 c/deg gratings the frequency-specific
attentional effect (L+F+ vs. L+F-) was stronger over the left hemisphere, irrespective of
visual field of stimulation. Consistently, at P1 level (110-16 ms) the attentional effect was
larger for stimuli presented in the RVF (left hemisphere), as shown by the significance
of the triple interaction of Attention x Electrode x Hemisphere.
This evidence of a left hemispheric advantage is consistent with previous ERP studies on
object-based selective attention for shape [22], orientation [46], color [20], as well as local vs.
global stimuli [4] and illusory contour detection [17]. More closely, these data recall the left-
sided attentional effect for N1 response (100-200 ms) found in a task in which the orientation
of spatial frequency gratings was the target feature [47]. A N165 attentional modulation was
also left-sided in a task requiring the selection of the check size of checkerboards of different
spatial frequencies [29].
Overall, these data (which, in our knowledge, are the earliest-latency attention effect of
a hemispheric asymmetry in the selection of spatial frequency), fully support the theory ad-
vanced by Sergent [48] according to which the left hemisphere would be dominant in the pro-
cessing of local elements of visual information, such as small check sizes, subtle bars or multi-
ple luminance variations. Indeed, regardless of response hand, we also found in the present
study that targets were more quickly detected when appeared in the observers’ RVF (left hem-
isphere). From a broader perspective, this line of evidence might also account for the left hem-
ispheric lateralization of the visual word form area (VWFA, namely the fusiform gyrus of the
occipito/temporal cortex) devoted to orthographic processing [49,50], since letters are charac-
terized by higher spatial frequencies. On the opposite side, the right hemispheric advantage
for low spatial frequencies, global processing would explain the right-sided lateralization (at
least in the male brain) of the fusiform face area (FFA) for the holistic recognition of faces [51,52].
Study limits. One limit of the present investigation might be the limited sample size, so that
further investigation might be needed to corroborate the present findings that, however, ap-
pear solid from the statistical point of view.
Acknowledgements The authors are grateful to Alessandro Vegliach (AAS1, Univ. of Trieste)
for his support in data collection.
Conflicts of Interest: The authors declare no conflict of interest.
5. References
1. Christian, S. Cerebral Asymmetries in Sensory and Perceptual Processing, 1st Ed, Elsevier, North Holland 1997.
ISBN: 9780444825100.
2. Hellige, J.B.; Laeng, B.; Michimata, C. Processing asymmetries in the visual system. In K. Hugdahl & R. Westerhausen
(Eds.), The two halves of the brain: Information processing in the cerebral hemispheres (p. 379–415). MIT Press, 2010.
3. Hugdahl, K. Hemispheric asymmetry: contributions from brain imaging. Wiley Interdiscip Rev Cogn Sci. 2011
Sep;2(5):461-478.Preprints (www.preprints.org) | NOT PEER-REVIEWED | Posted: 4 January 2021 doi:10.20944/preprints202101.0031.v1
4. Gable, P.A.; Poole, B.D.; Cook, M.S. Asymmetrical hemisphere activation enhances global-local processing. Brain Cogn.
2013, 83, 337–341.
5. Van Kleeck, M.H. Hemispheric differences in global versus local processing of hierarchical visual stimuli by normal sub-
jects: New data and a meta-analysis of previous studies. Neuropsychol 1989, 27, 1165–1178.
6. Yamaguchi, S.; Yamagata, S.; Kobayashi, S. Cerebral asymmetry of the “top-down” allocation of attention to global and
local features. J. Neurosci. 2000, 20, RC72
7. Yovel, G.; Levy, J.; Yovel, I. Hemispheric asymmetries for global and local visual perception: effects of stimulus and task
factors. J Exp Psychol Hum Percept Perform. 2001 Dec;27(6):1369-85.
8. Johannes, S.; Wieringa, B.M.; Matzke, M.; Münte, T.F. Hierarchical visual stimuli: Electrophysiological evidence for sepa-
rate left hemispheric global and local processing mechanisms in humans. Neurosci. Lett. 1996, 210, 111–114.
9. Proverbio, A.M. Left and Right Hemisphere Role for Selective and Sustained Attention: An Electrophysiological Ap-
proach. Ph.D. Thesis, University of Padua, Padua, 1993.
10. Proverbio, A.M.; Zani, A.; Avella, C. Hemispheric asymmetries for spatial frequency discrimination in a selective attention
task. Brain Cogn. 1997, 34, 311–320.
11. Robertson, L.C.; Lamb, M.R. Neuropsychological contributions to theories of part/whole organization. Cognit. Psy-
chol. 1991, 23, 299–330.
12. Robertson, L.C.; Lamb, M.R.; Knight, R.T. Effects of lesions of temporal-parietal junction on perceptual and attentional
processing in humans. J. Neurosci. 1988, 8, 3757–3769.
13. Navon, D. Forest before trees: The precedence of global features in visual perception. Cognit. Psychol. 1977, 9, 353–383.
14. Christie, J.; Ginsberg, J.P.; Steedman, J.; Fridriksson, J.; Bonilha, L.; Rorden, C. Global versus local processing: seeing the
left side of the forest and the right side of the trees. Front Hum Neurosci. 2012 Feb 22;6:28.
15. Proverbio, A.M.; Minniti, A.; Zani, A. Electrophysiological evidence of a perceptual precedence of global vs. local visual
information. Cognit. Brain Res. 1998, 6, 321–334.
16. Fink, G.R.; Halligan, P.W.; Marshall, J.C.; Frith, C.D.; Frackowiak, R.S.; Dolan, R.J. Where in the brain does visual attention
select the forest and the trees? Nature 1996 Aug 15;382(6592):626-8.
17. Proverbio, A.M.; Zani, A. Electrophysiological indexes of illusory contours perception in humans. Neuropsychol 2002, 40,
479–491.
18. Baas, J.M.; Kenemans, J.L.; Mangun, G.R. Selective attention to spatial frequency: An ERP and source localization analy-
sis. Clin. Neurophysiol. 2002, 113, 1840–1854.
19. Georgopoulos, A.P.; Whang, K.; Georgopoulos, M.A.; Tagaris, G.A.; Amirikian, B.; Richter, W.; Kim, S.; Uǧurbil, K. Func-
tional magnetic resonance imaging of visual object construction and shape discrimination: Relations among task, hemi-
spheric lateralization, and gender. J. Cognit. Neurosci. 2001, 13, 72–89.
20. Proverbio, A.M.; Burco, F.; Del Zotto, M.; Zani, A. Blue piglets? Electrophysiological evidence for the primacy of shape
over color in object recognition. Cognit. Brain Res. 2004, 18, 288–300.
21. Milham, M.P.; Banich, M.T.; Webb, A.; Barad, V.; Cohen, N.J.; Wszalek, T.; Kramer, A.F. The relative involvement of ante-
rior cingulate and prefrontal cortex in attentional control depends on nature of conflict. Cognit. Brain Res. 2001, 12, 467–
473.
22. Orlandi, A.; Proverbio, A.M. Left-Hemispheric Asymmetry for Object-Based Attention: an ERP Study. Brain Sci. 2019,
8;9(11), 315. doi: 10.3390/brainsci9110315.
23. Corbetta, M., & Shulman, G. L. (2011). Spatial neglect and attention networks. Ann Rev Neurosci, 34, 569–599.
24. Nobre, A.C.; Sebestyen, G.N.; Gitelman, D.R.; Mesulam, M.M.; Frackowiack, R.S.; Frith, C.D. Functional localization of the
system for visuospatial attention using positron emission tomography. Brain 1997;120:515–533.
25. Pardo, J.V.; Fox, P.T.; Raichle, M.E. Localization of a human system for sustained attention by positron emission tomogra-
phy. Nature. 1991 Jan 3;349(6304): 61-4.
26. Proverbio, A.M.; Zani, A.; Avella, C. Differential activation of multiple current sources of foveal VEPs as a function of
spatial frequency. Brain Top 1996, 9, 59–68.
27. Martınez, A.; Di Russo, F.; Anllo-Vento, L.; Hillyard, S.A. Electrophysiological analysis of cortical mechanisms of selective
attention to high and low spatial frequencies. Clin. Neurophysiol. 2001, 112, 1980–1998.
28. Dos Santos, N.A.; Andrade, S.M.; Fernandez Calvo, B. Detection of spatial frequency in brain-damaged patients: influence
of hemispheric asymmetries and hemineglect. Front Hum Neurosci. 2013 Apr 3;7:92.
29. Zani, A.; Proverbio, A.M. ERP signs of early selective attention effects to check size. Electroencephal. Clin. Neurophys-
iol. 1995, 95, 277–292.
30. Harter, M.R.; Previc, F.H. (1978). Size-specific information channels and selective attention: visual evoked potentials and
behavioural measures. Electroenceph. Clin. Neurophysiol. 1978, 45, pp. 628-640.
31. Harter, M.R., White C.T. Evoked cortical response to checkerboard patterns: effect of check-size as a function of visual
acuity. Electroenceph. Clin. Neurophysiol. 1970, 28, pp. 48-54.
32. Harter, M.R., C.J. Aine, C. Schroeder (1982). Hemispheric differences in the neural processing of stimulus location and
type: effects of selective attention on visual evoked potentials. Neuropsychol. 1982, 20, pp. 421-438.
33. Mauguiere, F.; Giard, M.H.; Ibanez, V.; Pernier, J. Sequential spatial maps of visual potentials evoked by checkerboard-
pattern reversal: effect of the retinal field stimulated on response topography. Rev Electroencephalogr Neurophysiol Clin
1985, 15, pp. 129-137.Preprints (www.preprints.org) | NOT PEER-REVIEWED | Posted: 4 January 2021 doi:10.20944/preprints202101.0031.v1
34. Hudnell, H.K.; Boyes, W.K.; Otto, D.A. Stationary pattern adaptation and the early components in human visual evoked
potentials. Electroencephalogr Clin Neurophysiol. 1990, 77, pp. 190-198.
35. Blumhardt, L.D.; Barret, G.; Halliday, A.M.; Kriss, A. The effect of field size on the pattern reversal visual evoked response.
Clin Vision Sci 1989, 4, pp. 27-40.
36. Bodis-Wollner, I.; Brannan, J.R.; Nicoll, J.; Frkovic, S.; Mylin, L.H. A short latency cortical component of the foveal VEP is
revealed by hemifield stimulation. Electroencephal Clin Neurophysiol 1992, 84, pp. 201-208.
37. Proverbio, A.M.; Del Zotto, M.; Zani, A. Electrical neuroimaging evidence that spatial frequency-based selective attention
affects V1 activity as early as 40-60 ms in humans. BMC Neurosci. 2010, May 6;11:59.
38. Reuter-Lorentz, P.A.; Kinsbourne, M.; Moscovitch, M. Hemispheric control of spatial attention. Brain Cogn. 1990, 12: 240-
266.
39. Palmer, T.; Tzeng, O.J. Cerebral asymmetry in visual attention. Brain Cogn. 1990, 13: 46-58. 1.
40. Papera, M.; Richards, A. Attentional gain and processing capacity limits predict the propensity to neglect unexpected
visual stimuli. Psychophysiol. 2016 May;53(5):634-49. doi: 10.1111/psyp.12614.
41. Jeffreys, D.A.; Axford, J.G. Source locations of pattern-specific components of human visual evoked potentials. I. Compo-
nent of striate cortical origin. Exp Brain Res. 1972, 16, 1–21.
42. Zani, A.; Proverbio, A.M. Selective attention to spatial frequency gratings affects visual processing as early as 60 msec.
poststimulus. Percept Mot Skills. 2009 Aug;109(1):140-58.
43. Zani, A.; Proverbio, A.M. Is that a belt or a snake? Object attentional selection affects the early stages of visual sensory
processing. Behav Brain Funct 2012, 8, 6.
44. Zani, A.; Proverbio, A.M. Endogenous attention to object features modulates the ERP C1 component, Cog Neurosci
2018, 9:1-2, 66-67.
45. Czigler, I.; Balázs, L.; Lénárt, A. Attention to features of separate objects: an ERP study of target-shooters and control
participants. Int J Psychophysiol. 1998 Dec;31(1):77-87. doi: 10.1016/s0167-8760(98)00045-2.
46. Orlandi, A.; Proverbio, A.M. ERP indices of an orientation-dependent recognition of the human body schema. Neuropsy-
chol. 2020, Sep;146, 107535.
47. Proverbio, A.M.; Esposito, P., Zani, A. Early involvement of the temporal area in attentional selection of grating orienta-
tion: an ERP study. Brain Res Cogn Brain Res. 2002 Feb;13(1):139-51.
48. Sergent, J. The cerebral balance of power: Confrontation or cooperation? J Exp Psychol: Hum Percept Perform 1982, 8(2), 253–
272
49. Proverbio, A.M.; Zani, A.; Adorni, R. The left fusiform area is affected by written frequency of words. Neuropsychol. 2008;
46(9):2292-9.
50. Fink, G.R.; Canário, N.; Jorge, L.; Castelo-Branco, M. Distinct mechanisms drive hemispheric lateralization of object recog-
nition in the visual word form and fusiform face areas. Brain Lang. 2020 Nov;210:104860.
51. Halligan, P.W.; Marshall, J.C.; Frith, C.D.; Frackowiak, R.S.J.; Dolan, R.J. Where in the brain does visual attention select the
forest and the trees? Nature 1996, 382, 626.
52. Hildesheim, F.E.; Debus, I.; Kessler, R.; Thome, I.; Zimmermann, K.M.; Steinsträter, O.; Sommer, J.; Kamp-Becker, I.; Stark,
R.; Jansen, A. The Trajectory of Hemispheric Lateralization in the Core System of Face Processing: A Cross-Sectional Func-
tional Magnetic Resonance Imaging Pilot Study. Front Psychol. 2020 Oct 2;11:507199.You can also read