Climate dynamics: temporal development of the occurrence frequency of heavy precipitation in Saxony, Germany
←
→
Page content transcription
If your browser does not render page correctly, please read the page content below
B      Meteorol. Z. (Contrib. Atm. Sci.), Vol. 29, No. 5, 335–348 (published online May 13, 2020)
       © 2020 The authors
                                                                                                                              Climatology

Climate dynamics: temporal development of the occurrence
frequency of heavy precipitation in Saxony, Germany
Andrea S. Schaller1∗ , Johannes Franke2 and Christian Bernhofer1
1
  Chair of Meteorology, Institute of Hydrology and Meteorology, Faculty of Environmental Sciences, Technische
Universität Dresden, Germany
2
  Department of Climate and Air Quality, Saxon State Agency for Environment, Agriculture and Geology,
Dresden, Germany,
(Manuscript received December 31, 2015; in revised form February 28, 2020; accepted March 12, 2020)

             Abstract
             Several studies showed the impact of global climate change in Germany and Saxony including the risk of
             increasing precipitation extremes. Here, heavy precipitation was analyzed on the basis of daily precipitation
             sums using the 95th percentile (index R95p). The long term development was studied for selected stations
             (1917–2013). Transects with high spatial resolution (1×1 km) (1961–2015) complemented the study to
             gain information about spatial temporal development of the occurrence of precipitation extremes. The non
             parametric kernel occurrence rate estimation has been applied to reveal changes in the temporal development
             of daily totals. The most distinct changes have been found for the seasons and the growing seasons and only
             slight changes for the calendar year and the meteorological half-years. The findings of this study showed
             a shifting seasonality with decreasing number of heavy precipitation events in the growing season I (April,
             May, June) and increasing number of events in growing season II (July, August, September). Furthermore,
             a distinct periodicity has been revealed in all findings for all seasons, particularly striking in the growing
             seasons, indicating the influence of large scale drivers as potentially the North Atlantic Oscillation on local
             precipitation extremes. Our data showed, that kernel occurrence rate estimation is a suitable approach to
             analyze the temporal development of heavy precipitation with a high temporal and spatial resolution.
             Keywords: heavy precipitation, precipitation extremes, kernel occurrence rate estimation regional climate
             change, trend variability and stability, shifting seasonality

1 Introduction                                                                 trends only for a few locations and pointed out the strik-
                                                                               ing seasonality in the trend pattern of precipitation ex-
Extreme weather events, respectively changes in climate                        tremes in Europe. In Germany the occurrence of pre-
extremes, are an ongoing research topic all over the                           cipitation extremes depends on seasons with regional
world (Karl and Easterling, 1999; Easterling et al.,                           variances (Trömel and Schönwiese, 2007). Seasonal
2000; Tebaldi et al., 2006; WMO, 2013). The IPCC                               analyzes of heavy precipitation for Saxony (Eastern Ger-
special report focuses on the management of the risks of                       many) gave a very inconsistent impression. For winter
extreme events and disasters to advance climate change                         increases have been found for Germany (Zolina et al.,
adaption (Field, 2012). Especially heavy or extreme                            2008), central-western Europe (Zolina et al., 2009) and
precipitation is of particular interest, due to its high                       central and eastern Europe (Bartholy and Pongrácz,
variability compared to other climate elements.                                2007), whereas Trömel and Schönwiese (2007) re-
   Increasing heavy precipitation trends have been re-                         ported nearly no changes to small increases for the
ported worldwide (Frich et al., 2002; Groisman et al.,                         north-eastern part of Germany for extreme precipitation
2005; Alexander et al., 2006; Moberg et al., 2006).                            in the winter months. In the summer season heavy pre-
A complex and non-uniform spatial pattern of extreme                           cipitation trends are weak, rarely significant and spa-
precipitation changes were observed for the last cen-                          tially not coherent (Moberg and Jones, 2005; Moberg
tury on a regional scale in Europe (Alpert et al., 2002;                       et al., 2006). Wetting trends have been identified for cen-
Klein Tank and Können, 2003; Brunetti et al., 2004;                            tral and western Europe (Moberg and Jones, 2005).
Moberg and Jones, 2005; Zolina et al., 2010). For Eu-                          For the north-eastern part of Germany a decrease of
rope increasing heavy precipitation tendencies with low                        the occurrence of relatively high precipitation have been
spatial coherency have been identified (Klein Tank and                         noticed (Trömel and Schönwiese, 2007). Increasing
Können, 2003). Zolina et al. (2005) confirmed robust                           summer precipitation trends have been reported for most
                                                                               of the Czech Republic (Kyselý, 2009), with Czech Re-
∗ Corresponding  author: Andrea S. Schaller, Chair of Meteorology, Institute   public being important due to its location at the south-
of Hydrology and Meteorology, Faculty of Environmental Sciences, Techni-       east border of Saxony. Diverse heavy precipitation ten-
sche Universität Dresden, Pienner Str. 23, 01737 Tharandt, Germany, e-mail:    dencies have been reported for spring: For west Ger-
Andrea.Schaller@mailbox.tu-dresden.de

                                                                                                                           © 2020 The authors
DOI 10.1127/metz/2020/0771                                     Gebrüder Borntraeger Science Publishers, Stuttgart, www.borntraeger-cramer.com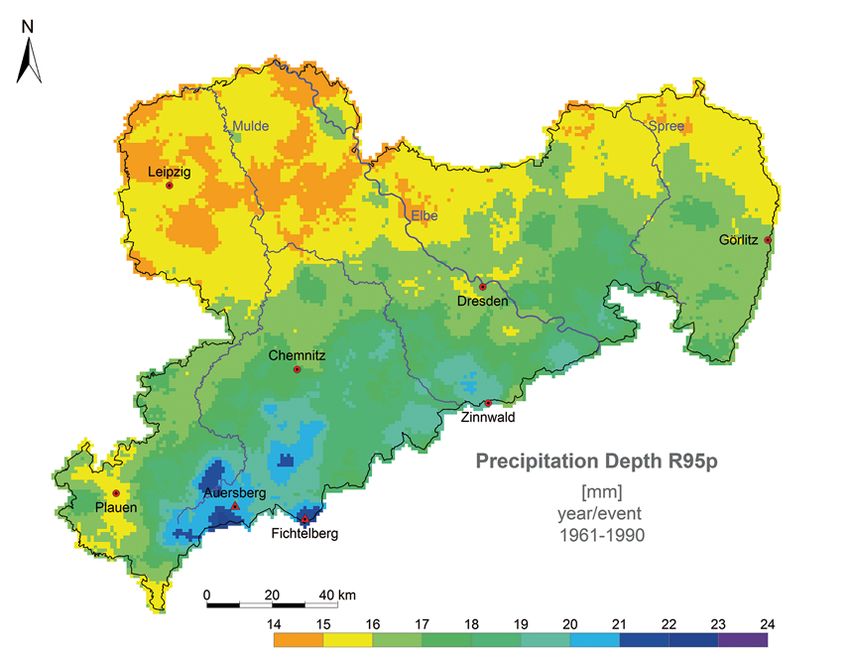
336 A.S. Schaller et al: Occurrence frequency of heavy precipitation in Saxony Meteorol. Z. (Contrib. Atm. Sci.)
29, 2020
many heavy precipitation increased (Hundecha and cipitation events, which means all precipitation events
Bárdossy, 2005). In Czech Republic on the other hand reaching the 95th percentile was included. Therefore,
significant declines in the frequency of heavy precipi- the index R95p, referring to the Climate Change In-
tation were found in spring (Kyselý, 2009). In autumn dices by the WMO, was used. The nonparametric Kernel
Germany shows a non-uniform spatial extreme precipi- Occurrence Rate Estimation was used to identify peri-
tation pattern, with increasing heavy precipitation (mag- ods of high and low occurrence frequencies (Mudelsee
nitude and frequency) in west Germany (Hundecha et al., 2004). The main advantages of this method is the
and Bárdossy, 2005) and decreasing in north-east Ger- completely unsusceptible to outliners (Dalelane and
many (Trömel and Schönwiese, 2007). Deutschländer, 2013). The study area was eastern
Heavy precipitation analyzes of Germany and Czech Germany and particularly the Free State of Saxony with
Republic showed opposed heavy precipitation tenden- its exposed geographic position (influence of the up-
cies for some seasons. Trömel and Schönwiese (2007) lands to typical weather conditions and increasing con-
stated different spatial trends in the western and east- tinental climate from west to east). Times series of lo-
ern part of Germany regarding the behavior of precip- cal measured daily precipitation sums are the bases for
itation extremes. Previous studies concerning precipita- Station Mode Data (1917–2013) and Grid Mode Data
tion extremes in Germany underrepresented the east part (1961–2015) as well. For Grid Mode Data interpolated
of Germany using far too few or unrepresentative mea- time series with a resolution of 1×1 km are used to as-
suring stations. This problem is visualized in Zolina sure a high spatial resolution.
et al. (2008), leading to the question: What kind of ex-
treme precipitation behavior can be found in the east of
Germany? 2 Data and methods
Extreme precipitation can be defined by amount of
precipitation and frequency of precipitation events. Ex- The analyzes is based on daily precipitation data from
treme precipitation events affect the environment, hu- meteorological stations in the Free State of Saxony,
man life and the economy. Increasing numbers of heavy Germany. The occurrence frequency of heavy precip-
precipitation events would have a great impact on their itation was evaluated using the index R95p, which
vulnerability and would lead to damage. Consequently, thereby functions as peak over threshold approach. In
the frequency of these events is an important parame- order to quantify the temporal development of the oc-
ter. There are several ways to define the frequency of currence frequency over time the kernel occurrence
precipitation extremes. A common way is the Climate rate estimation was applied to Station Mode Data as
Change Indices introduced by the World Meteorologi- well as Grid Mode Data, covering the time period
cal Organization (WMO) (Karl et al., 1999; Peter- 01.01.1917–31.12.2015.
son et al., 2001; Peterson, 2005). For the percentile
based Indices, the WMO considers the 95th and the 2.1 Study Area
99th percentile as the relevant percentiles. Groisman The Free State of Saxony is a landlocked Federal State
et al. (2005) refers to heavy precipitation regarding the and lies in the east of Germany. The regional climate is
95th percentile and to extreme precipitation regarding characterized by a westerlies temperate climate and is
the 99th percentile. influenced by Mediterranean and continental air masses.
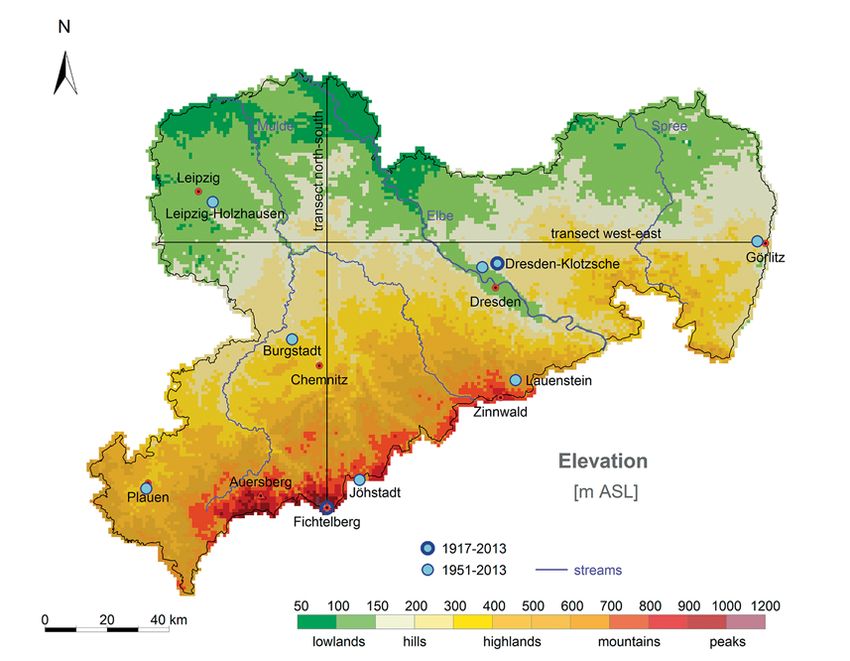
Precipitation has a high spatial variability. Due to The topographic relief of Saxony can be described from
the complex and non-uniform changing spatial patterns north to south by low lands (plains) followed by down
of extreme precipitation in Europe, studying regional lands and hill lands of the Ore Mountains (Fig. 1). Pre-
heavy precipitation characteristics requires data in high cipitation is mainly determined by the location of the
resolution. Highly important, due to analyzing precipi- mountains to the prevailing wind direction. Dominat-
tation as an element with high variability, is the focus on ing is the west-southwest-wind leading to orographic
temporal development. Trend analyzes of certain time lift on the windward side and foehn winds on the lee-
periods strongly depend on start and end date. Analy- ward side of the northern edge of the Ore Mountains.
zing different periods of one time series can result in Therefore, the highest precipitation of Saxony can be
different trends in direction and magnitude. Therefore, found at the western slopes of the Ore Mountains. For
methods with the ability to consider the temporal devel- this study, eight stations representing all landforms have
opment are of special interest. been analyzed. Furthermore, the transects North–South
The focus of this study is the temporal develop- and West–East are used to give a spatial insight.
ment of the occurrence of heavy precipitation as an ex-
treme weather event. Consequently, we have analyzed 2.2 Data basis
the occurrence frequency of heavy precipitation with
high temporal and spatial resolution for the seasons, the Local measured values of corrected daily precipita-
growing seasons, the meteorological half-years and the tion totals were used as database. The position of
calendar year separately. The summer months are partic- the measuring stations for Station Mode Data can be
ularly important because of their tremendous effects on seen in Fig. 1. Station Mode Data cover the time
agriculture. This study focused on moderate heavy pre- span 1917–2013 (Dresden-Klotzsche, Fichtelberg) and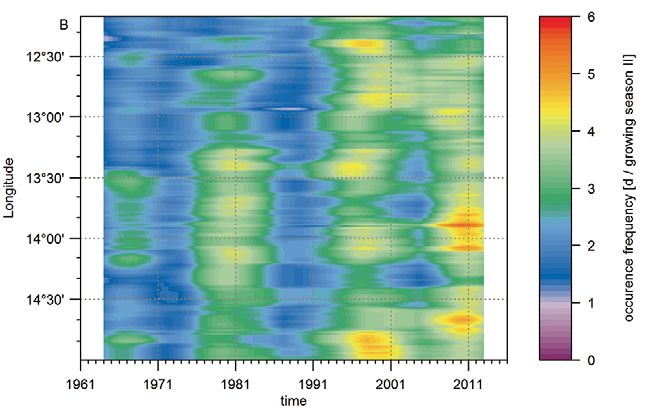
Meteorol. Z. (Contrib. Atm. Sci.)            A.S. Schaller et al: Occurrence frequency of heavy precipitation in Saxony      337
29, 2020

Figure 1: Elevation map of the Free State of Saxony with selected measuring stations and transects.

1951–2013 (Burgstadt, Görlitz, Jöhstadt, Lauenstein,                  the natural regions of Saxony. The transect West–East
Leipzig-Holzhausen, Plauen). Due to station relocation,               shows the course through the station Görlitz (Fig. 1).
the timeseries of the stations Wahnsdorf (1917–1960)                  The eastwards increasing continental influence is of spe-
and Dresden-Klotzsche (1961–2013) have been assem-                    cial interest. The transect north-south ends at the station
bled. Grid Mode Data for the transects cover the time                 Fichtelberg in the Ore Mountains. It represents the max-
span 1961–2015. Local measured values of corrected                    imal north-south expansion with the highest altitude dif-
daily precipitation stations are the database for the Grid            ference and represents all natural regions.
Mode Data. At the IHM (Institute for Hydrology and                        The analyzes focused on the change of the occur-
Meteorology) the local measured values (raw data of                   rence rate during the course of the year. Therefore, each
the Deutscher Wetterdienst) have been made to homoge-                 time series has been analyzed for several time periods,
nous and consistent data sets. Subsequently, these time               namely the seasons: spring (March, April, May), sum-
series were spatially interpolated (Indicator Kriging) for            mer (June, July, August), autumn (September, October,
each day using ReKis (Regionales Klimainformation-                    November), winter (December, January, February), for
ssystem) with a resolution of 1×1 km. After registration              growing season I (April, May, June) and growing sea-
the data sets are available online at http://www.rekis.               son II (July, August, September). Additionally, the me-
org. A study by Kronenberg and Bernhofer (2015)                       teorological summer half-year (April-September), the
ensured the plausibility of the data set. The extraction-             meteorological winter half-year (October-March) and
tool ExtRa (Extrahierung Rasterzellen) has been used                  the calendar year have been regarded.
to extract time series for each grid point. As a result,
time series for about 20.00 pseudostations, each repre-               2.3 Peak-Over-Threshold (POT) Approach/
senting a 1×1 km grid of Saxony, have been extracted.                     inhomogeneous poisson process
Scatter plots comparing precipitation time series (raw
and processed) of Station Mode Data and location corre-               The main advantage of POT-Approaches is that only
sponding grid ensure the quality of the used Grid Mode                data of interest (the extremes) are included in the analy-
Data. Data for the transects consist of stripes with 1 km             zes. Quasi-continuous time series are reduced to days,
width, extracted from the Grid Mode Data. The transects               exceeding a defined threshold u. The remaining days of
give the possibility to visualize possible gradients of the           the time series can be seen as an inhomogeneous poisson
heavy precipitation behavior and therefore to represent               process, which is the condition for the kernel occurrence
338              A.S. Schaller et al: Occurrence frequency of heavy precipitation in Saxony              Meteorol. Z. (Contrib. Atm. Sci.)
                                                                                                                                 29, 2020

Figure 2: Precipitation total for Heavy Precipitation R95p event in mm for the Free State of Saxony for 1961–1990.

rate estimation. The threshold u has to be set, requiring            therefore shows distinct height dependence. The precip-
the independence of two consecutively events and there-              itation totals R95p decreases slightly from west to east.
fore catching the real extremes and gaining a statistical
acceptable sample size. For analyzing heavy precipita-               2.4 Kernel Occurrence Rate Estimation
tion events, the index R95p has been proven to achieve
suitable threshold values.                                           The kernel occurrence rate estimation is a nonparametric
    Heavy precipitation events are defined by the in-                kernel method developed by Diggle (1985) for smooth-
dex R95p. The index R95p is based on defining days                   ing poisson process data. The occurrence rate is esti-
with heavy precipitation according to statistical per-               mated by
centiles, rather than using arbitrary values, having the
                                                                                                       n         t − T
advantage of being geographically variable and catch-                                             −1                    i
                                                                                        λ̂(t) = h            K                      (2.1)
ing the “real” precipitation extremes (Manton et al.,                                                  i=1
                                                                                                                    h
2001). The index R95p is based on the Climate Change
Indices established by the WMO (Karl et al., 1999; Pe-               where K is the kernel function and h the bandwidth. The
terson et al., 2001; Peterson, 2005), and is computed                well known Epanechnikov-Kernel was used
as followed. The 95th percentile values were calculated                                             3
of daily precipitation totals, and for each time series in-                                   K(y) = (1 − yi )                      (2.2)
dividually, based on wet days with precipitation ≥ 1 mm                                             4
in the reference period 1961–1990. All time series are               Choosing the bandwidth h is a crucial step (Efro-
reduced to days reaching or exceeding that individually              movich, 1999). There are several methods available to
threshold value. All remaining days are considered as                estimate the optimal bandwidth h. Heidenreich et al.
days with heavy precipitation events.                                (2010) gave a detailed overview about commonly used
    Fig. 2 shows the spatial distribution of the precipita-          methods. The method to estimate the bandwidth h has to
tion totals R95p for Saxony. A heavy precipitation event             be selected depending on the data set, whereby among
is defined by exceeding the precipitation total R95p. The            others the sample size has a decisive role (Heiden-
mean precipitation totals for Saxony is about 17 mm.                 reich et al., 2010, 2013). For reasons of comparability a
The totals distinctly increase from north to south, and              unique bandwidth for all time series should be used. The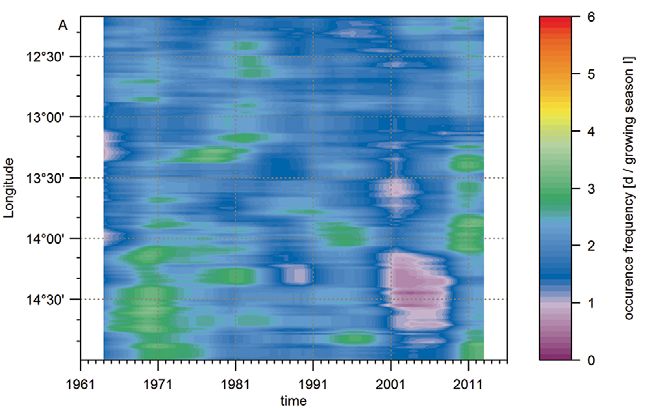
Meteorol. Z. (Contrib. Atm. Sci.) A.S. Schaller et al: Occurrence frequency of heavy precipitation in Saxony 339
29, 2020
primary aim was to determine a basic long term trend, 3.2 Temporal development in the growing
therefore a pragmatic bandwidth of h = 2190 days = season
6 years has been determined. Hence, the bandwidth fo-
cuses on periodicities above one decade and suppresses The temporal development has been determined for
shorter periodicities. Due to boundary effects λ̂(t) is un- the growing seasons for all regarded stations altogether
derestimated at the boundaries, thus λ̂(t) has to be disre- (Fig. 5). Especially since 1961 decreasing heavy precip-
garded at the boundaries with the range of 0.5·h. In order itation frequencies can be found in growing season I and
to reassure the bandwidth of 6 years, the bandwidth was increasing frequencies in growing season II. During pe-
adapted for the different time periods. riods with high heavy precipitation frequency in grow-
Information about the confidence intervals can be ing season II the heavy precipitation frequency was low
achieved with bootstrap approach, which is necessary in growing season I at the same time. This tendency
for unknown distributions. With the assumption that can be observed clearly for the 1950s, the 1980s and
the number of events in a time interval is Poisson dis- very distinctive since the 1990s, forming a gap between
tributed, the Bootstrap approach is not required (Sneth- heavy precipitation frequencies of the growing seasons.
lage, 1999). Growing season II shows decreasing tendencies since
The kernel occurrence rate estimation gives daily the 1970s.
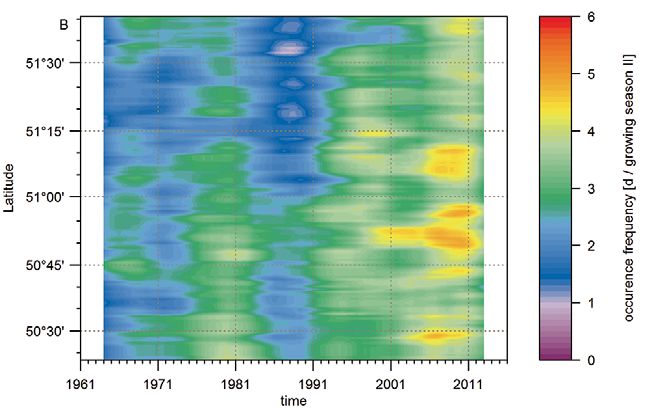
probabilities of heavy precipitation events. For the grow- The North–South transect (Fig. 6) and West–East
ing seasons, the occurrence frequencies were converted transect (Fig. 7) give the possibility to visualize the
to events per season for an easier understanding of the temporal development of heavy precipitation for cross-
data. sections through Saxony to give a spatial view. Thereby,
the x-axis of the transect Figures shows the temporal de-
velopment from 1961–2015 of the occurrence frequency
3 Results of heavy precipitation and the y-axis the spatial course
3.1 Long-term temporal development of of each transect. The transect North–South of the y-axis
heavy precipitation events R95p gives the course from north (upper part of the Figure) to
south (lower part of the Figure). The transect West–East
We found distinct patterns of the occurrence frequency shows the course from west (upper part of the Figure)
of heavy precipitation during the course of the year. to east (lower part of the Figure). For example the lower
The long-term temporal development has been ana- part of the Figure of the transect West–East shows the
lyzed from 1917 to 2013 for the stations Dresden- temporal development of the Görlitz area.
Klotzsche (Fig. 3) and Fichtelberg (Fig. 4). Addition- Overall both transects showed higher occurrence fre-
ally, the stations Görlitz, Leipzig-Holzhausen, Plauen, quencies for growing season II than for growing sea-
Jöhstadt, Burgstadt and Lauenstein from 1951 to 2013 son I (Fig. 6 and 7). In the transect North–South (Fig. 6)
have been analyzed to cover all regional characteristics the number of heavy precipitation events decreased in
(A1–S6). The following Figures focus on the temporal growing season I for the whole transect with the min-
development, due to the method individual numbers of imal turning point around the turn of the millennium.
single years cannot be overestimated. In the 1970s a weak north-south gradient can be de-
The occurrence frequency showed only an incon- tected, which later mitigated and then vanished. Alto-
siderable variance regarding the calendar year and gether the growing season II showed increasing occur-
the meteorological half-years for all stations. Stations rence of heavy precipitation events. In the 1970s and
with a higher altitude (Fichtelberg, Fig. 4A), Jöhstadt since the 1990s a north-south gradient can be identified.
Fig. S6A) showed slightly higher occurrence frequen- The local maxima of the heavy precipitation occurrence
cies for the calendar year. Heavy precipitation events were situated in the hills, highlands and the mountains
generally occurred more often in the meteorological on the windward side of the Ore Mountains. Since the
summer half-year, than in the meteorological winter 1990s overall decreasing occurrence of heavy precipi-
half-year (Fig. 4A, 5A, S1A–S6A). Only the station tation in growing season I and concurrently increasing
Fichtelberg showed a higher occurrence frequency in in growing season II have been found. In the West–East
the meteorological winter half-year than in the summer transect (Fig. 7) the occurrence of heavy precipitation
half-year during the 1940s, 1960s and since the 1990s decreased in growing season I from 1961–2015. The lo-
(Fig. 4A). cal maxima occurred around the 1970s in the east part of
The highest occurrence frequencies appeared in the the transect. Over time, this area showed the strongest
summer, compared to spring, autumn and winter. In- decrease. Beginning in the middle of the 1960s till the
creasing and decreasing tendencies can be found in all start of the 1970s a west-east gradient existed. At the
seasons for several stations for the short time series millennium turn the gradient reversed its direction to an
(A1–A6, B). The overall development of the long time east-west gradient. In growing season II increasing oc-
series (Fig. 3B, 4B) relativizes theses tendencies. The currence of heavy precipitation events have been found.
most distinct changes have been found during the sum- Local maxima occurred since the 1990s and were situ-
mer months, especially the growing seasons for all sta- ated west of the river Mulde, at the Elbe river and at the
tions (Fig. 3C, 4C, S1C–S6C). highlands of east part of the transect.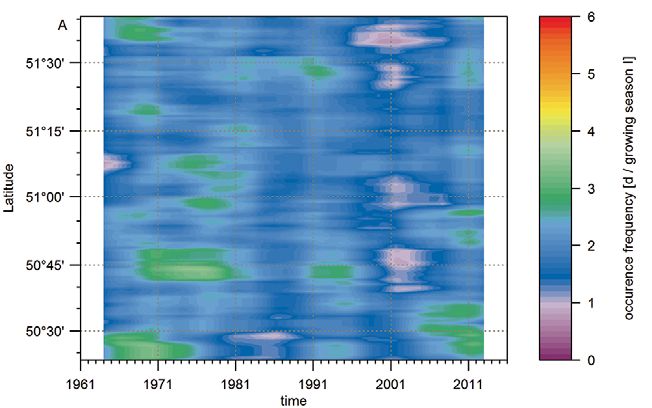
340              A.S. Schaller et al: Occurrence frequency of heavy precipitation in Saxony              Meteorol. Z. (Contrib. Atm. Sci.)
                                                                                                                                 29, 2020

Figure 3: Occurrence frequency of heavy precipitation R95p per day for Dresden-Klotzsche for the year and the meteorological half-
years (A), the seasons (B) and the growing seasons (C) for 1917–2013.

Figure 4: Occurrence frequency of heavy precipitation R95p per day for Fichtelberg for the year and the meteorological half-years (A), the
seasons (B) and the growing seasons (C) for 1917–2013.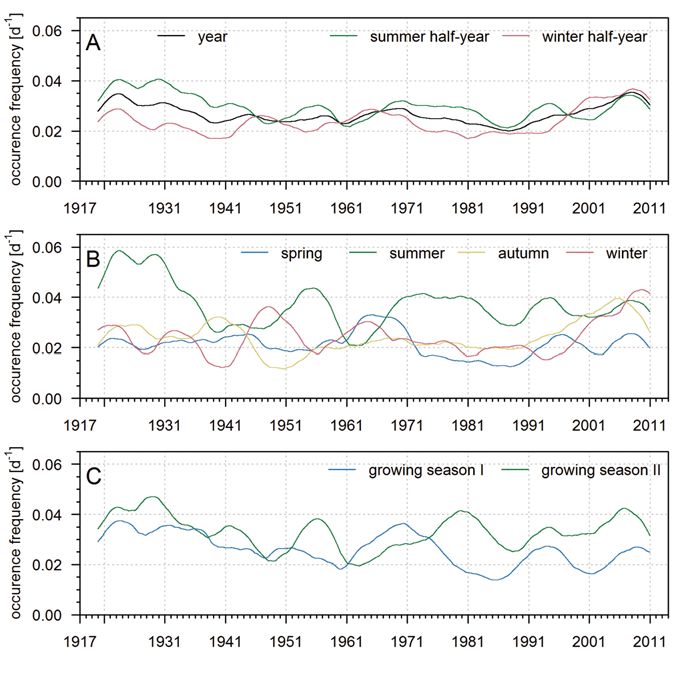
Meteorol. Z. (Contrib. Atm. Sci.)             A.S. Schaller et al: Occurrence frequency of heavy precipitation in Saxony              341
29, 2020

Figure 5: Occurrence frequency of heavy precipitation R95p in days per season in the growing seasons for the stations Fichtelberg, Dresden-
Klotzsche for 1917–2013 and Görlitz, Leipzig-Holzhausen, Plauen, Jöhstadt, Burgstadt, Lauenstein for 1951–2013.

Figure 6: Occurrence frequency of heavy precipitation R95p in days per season for transect North–South for growing season I (A) and
growing season II (B) for 1961–2015.

3.3 Periodicity                                                        Longer time intervals as meteorological half-years and
                                                                       the calendar year showed a weaker periodicity than
                                                                       the seasons and growing seasons. Furthermore, high
All analyzed stations (Figs. 3–5, A1–A6) and tran-                     occurrence frequencies in summer and low occur-
sects showed a distinct periodicity for the sub-                       rence frequencies in winter appeared simultaneously
periods (Figs. 6–7), which was alternating between                     (Figs. 3B–4B, A1B, A2B, A3B–A6B). Such opposed
high and low occurrence frequencies. Temporarily in-                   developments have been found distinctly in the growing
creases and decreases of the occurrence frequency pro-                 seasons (Figs. 5–7) and the meteorological half-years
ceeded equally (on their level) in several sub-periods.                (Figs. 3A–4A, A1A–A6A) for the whole time span.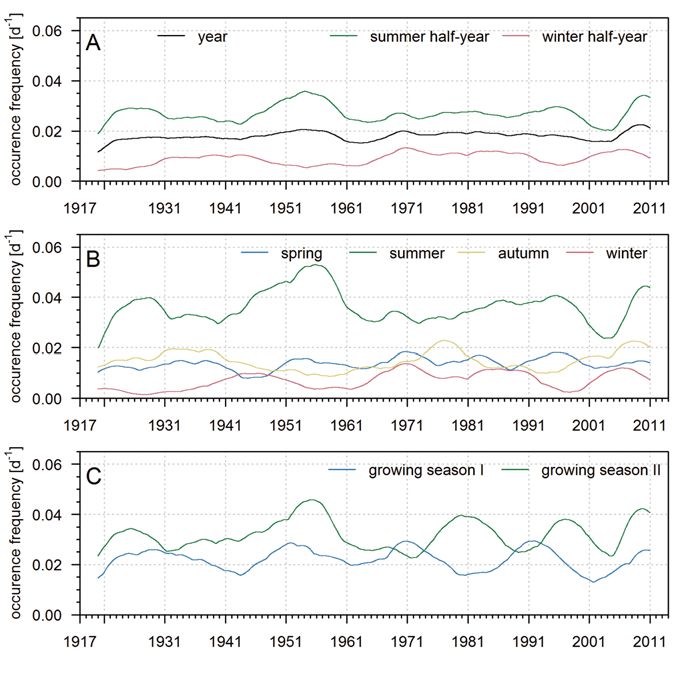
342              A.S. Schaller et al: Occurrence frequency of heavy precipitation in Saxony             Meteorol. Z. (Contrib. Atm. Sci.)
                                                                                                                                29, 2020

Figure 7: Occurrence frequency of heavy precipitation R95p in days per season for transect West–East for growing season I (A) and growing
season II (B) for 1961–2015.

4 Discussion                                                          served changes in growing season I and II were found to
                                                                      be more distinct than the results of spring and summer.
The study revealed high variances in the development of                   Our findings revealed decreasing occurrence fre-
the occurrence frequency of heavy precipitation events                quencies in growing season I and increasing occurrence
R95p for the seasons and growing seasons and less for                 frequencies in growing season II for several stations and
the calendar year and the meteorological half-years. The              the transects for 1951/1961–2015. This is in accordance
intensity of the occurrence frequency of the seasons fol-             with a study by Lupikasza et al. (2011). Heavy pre-
lowed the precipitation pattern during the course of the              cipitation frequencies were analyzed for 1951–2006 for
year. The highest precipitation frequency was found in                central-eastern Germany with decreasing spring trends
summer associated to the thermally induced convective                 and increasing summer trends (Lupikasza et al., 2011).
(heavy) precipitation behavior. In autumn the occurrence              Therefore, the common months (April, May for spring,
frequency of heavy precipitation events R95p decreased                growing season I and July, August for summer, grow-
and dropped in winter to the lowest level of the year.                ing season II) showed the same trend direction. (Hänsel
In spring the occurrence frequency increased and rose                 et al., 2009).
to the highest level of the year in summer. This heavy                    Against the background of slight changes regarding
precipitation behavior during the course of the year was              the calendar year in our study, the observed changes in
persistent but still changes were observed for the long-              the growing seasons can be interpreted as shift during
term temporal development of the occurrence frequency.                the course of the year or shifting seasonality. Changes
Basically, progressing on the same level of the occur-                in the annual precipitation distribution have also been
rence frequency, distinct variances have been observed                found by Hänsel et al. (2009) for the period 1951–2006
in the seasons, especially in summer months. The ob-                  for Saxony. In their study, uniform negative trends for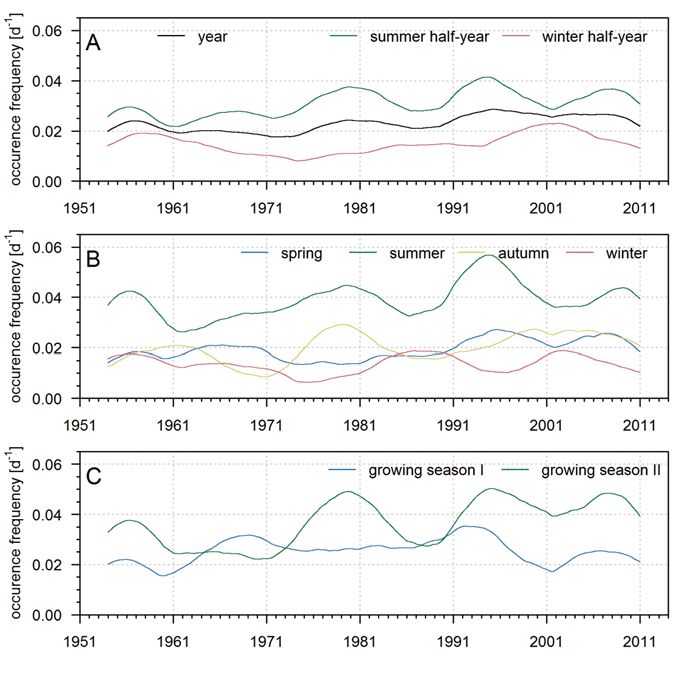
Meteorol. Z. (Contrib. Atm. Sci.)       A.S. Schaller et al: Occurrence frequency of heavy precipitation in Saxony     343
29, 2020

April to July and a shift of the maximum of the monthly         Multidecadal Oscillation on extreme precipitation in Eu-
precipitation from June/July to July/August were de-            rope has been stated for all seasons (Casanueva et al.,
scribed.                                                        2014). The East Atlantic Pattern influences summer pre-
    Increasing heavy precipitation in the summer sea-           cipitation extremes (Casanueva et al., 2014). Both os-
son may be explained with increasing convective pre-            cillation patterns can also be a source for the periodicity
cipitation due to temperature increases as follows: In-         in our data. Additionally, the periodicity could also be
creasing temperatures and heat waves have been de-              explained by long-term-memory. However, further stud-
scribed for East Germany for the summer season                  ies have to be conducted to reveal the source of the peri-
by Hoy et al. (2017). With higher temperatures the              odicity.
intensity of extreme precipitation strongly increases               As Dalelane and Deutschländer (2013) stated,
(Lenderink and van Meijgaard, 2008; Haerter                     the nonparametric kernel estimation has only rarely been
et al., 2010; Hardwick Jones et al., 2010). These in-           used in climatology. They showed that this method is ef-
creases exceed the atmosphere’s water-holding capacity          fective for analyzing temperature extremes (Dalelane
(Clausius-Clapeyron rate) (Lenderink and van Meij-              and Deutschländer, 2013). Our analyzes showed, that
gaard, 2008). Stratiform precipitation extremes in-             kernel occurrence rate estimation is a suitable approach
crease with temperature at approximately the Clausius-          to visualize the temporal development of heavy precipi-
Clapeyron rate, whereas convective precipitation ex-            tation with a high temporal and spatial resolution.
ceeds the Clausius-Clapeyron rate (Berg et al., 2013).
Therefore, increasing temperatures may lead to increas-
ing convective precipitation extremes.                          5 Conclusion
    Our findings also revealed a distinct periodicity al-
ternating between high and low occurrence frequen-              The aim of this study was to show first results on spa-
cies. The periodicity has been found in all stationary          tial and temporal development of heavy precipitation in
analyzes and in all analyzed sub-periods in different           Saxony. The temporal development of the heavy precip-
intenseness. Sub-periods with high heavy precipitation          itation behavior and the influence of large scale drivers,
frequency as summer and growing season II showed the            namely atmospheric circulation patterns should be ana-
periodicity more distinct than other sub-periods, which         lyzed in further studies. Highly important in this regard
was not fixed to specific years. Consecutive sub-periods        is the influence of atmospheric circulation patterns on
showed different tendencies of periodicity as well. All         meso-scale characteristics of heavy precipitation (orog-
findings shown for Saxony revealed a certain periodicity.       raphy, wind exposure, precipitation shadow, direction of
Therefore, the periodicity may be explained by a phe-           mountain range and further more) with regard to the sea-
nomenon of a higher scale. Such phenomenon may be               sonality. The revealed changes in the heavy precipitation
the sunspot cycle, the North Atlantic Oscillation (NAO)         pattern during the summer months (shifting seasonal-
or other longterm atmospheric oscillations and telecon-         ity) should be investigated in further studies. Preferably,
nection patterns. So far, studies have shown that changes       analyzes should be performed on a larger scale with a
in the NAO have direct impact on regional precipitation         high resolution to achieve more information about the
(Hurrell, 1995; Hurrell et al., 2003; Romano and                extent of the changing patterns and gaining more infor-
Preziosi, 2013). Furthermore, the impact of the NAO             mation for agriculture and water supply.
appears to apply particularly at specific levels of precipi-
tation intensity, influencing the occurrence of heavy pre-
cipitation events and their intensity (Stone et al., 2000).
Markovic and Koch (2005) gave evidence for a tele-              Appendencies
connective influence of the NAO on the precipitation
pattern of Germany. So far, the influence of Atlantic           Figures A1–A6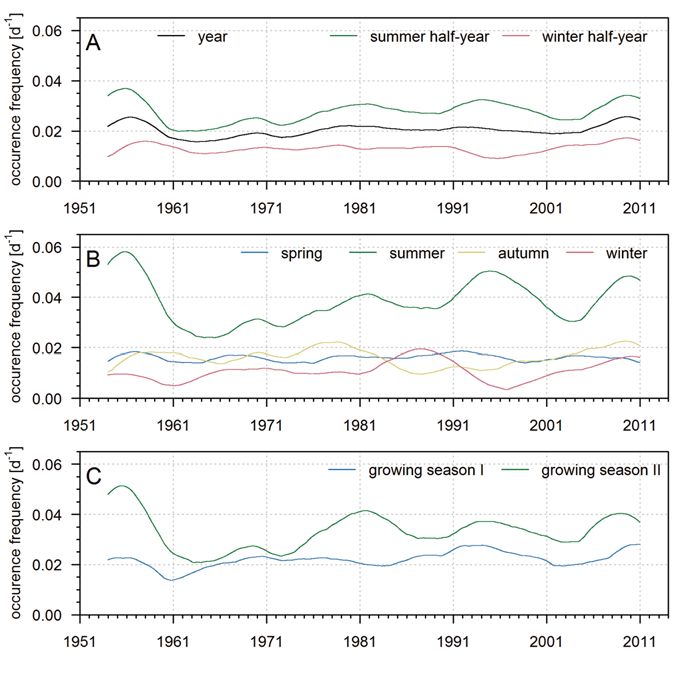
344              A.S. Schaller et al: Occurrence frequency of heavy precipitation in Saxony            Meteorol. Z. (Contrib. Atm. Sci.)
                                                                                                                               29, 2020

Figure A1: Occurrence frequency of heavy precipitation R95p per day for Leipzig-Holzhausen for the year and the meteorological half-
years (A), the seasons (B) and the growing seasons (C) for 1951–2013.

Figure A2: Occurrence frequency of heavy precipitation R95p per day for Görlitz for the year and the meteorological half-years (A), the
seasons (B) and the growing seasons (C) for 1951–2013.
Meteorol. Z. (Contrib. Atm. Sci.) A.S. Schaller et al: Occurrence frequency of heavy precipitation in Saxony 345 29, 2020 Figure A3: Occurrence frequency of heavy precipitation R95p per day for Burgstadt for the year and the meteorological half-years (A), the seasons (B) and the growing seasons (C) for 1951–2013. Figure A4: Occurrence frequency of heavy precipitation R95p per day for Plauen for the year and the meteorological half-years (A), the seasons (B) and the growing seasons (C) for 1951–2013.
346              A.S. Schaller et al: Occurrence frequency of heavy precipitation in Saxony            Meteorol. Z. (Contrib. Atm. Sci.)
                                                                                                                               29, 2020

Figure A5: Occurrence frequency of heavy precipitation R95p per day for Lauenstein for the year and the meteorological half-years (A),
the seasons (B) and the growing seasons (C) for 1951–2013.

Figure A6: Occurrence frequency of heavy precipitation R95p per day for Jöhstadt for the year and the meteorological half-years (A), the
seasons (B) and the growing seasons (C) for 1951–2013.
Meteorol. Z. (Contrib. Atm. Sci.) A.S. Schaller et al: Occurrence frequency of heavy precipitation in Saxony 347
29, 2020
References Heidenreich, N.-B., A. Schindler, S. Sperlich, 2010: Band-
width Selection Methods for Kernel Density Estimation-A Re-
view of Performance. – Available at SSRN 1726428, https://
papers.ssrn.com/sol3/papers.cfm?abstract_id=1726428.
Alexander, L.V., X. Zhang, T.C. Peterson, J. Cae-
Heidenreich, N.-B., A. Schindler, S. Sperlich, 2013: Band-
sar, B. Gleason, A.M.G. Klein Tank, M. Haylock,
width selection for kernel density estimation: a review of fully
D. Collins, B. Trewin, F. Rahimzadeh, A. Tagipour,
automatic selectors. – AStA Adv Stat Anal 97, 403–433.
K. Rupa Kumar, J. Revadekar, G. Griffiths, L. Vin-
Hoy, A., S. Hänsel, P. Skalak, Z. Ustrnul, O. Bochníèek,
cent, D.B. Stephenson, J. Burn, E. Aguilar, M. Brunet,
2017: The extreme European summer of 2015 in a long-term
M. Taylor, M. New, P. Zhai, M. Rusticucci, J.L. Vazquez-
perspective. – Int. J. Climatol. 37, 943–962.
Aguirre, 2006: Global observed changes in daily climate ex-
Hundecha, Y., A. Bárdossy, 2005: Trends in daily precipitation
tremes of temperature and precipitation. – J. Geophys. Res.
and temperature extremes across western Germany in the sec-
Atmos. 111, D05109.
ond half of the 20th century. – Int. J. Climatol. 25, 1189–1202.
Alpert, P., T. Ben-Gai, A. Baharad, Y. Benjamini, D. Yeku-
Hurrell, J.W., 1995: Decadal Trends in the North Atlantic Os-
tieli, M. Colacino, L. Diodato, C. Ramis, V. Homar,
cillation: Regional Temperatures and Precipitation. – Science
R. Romero, S. Michaelides, A. Manes, 2002: The paradox-
269, 676–679.
ical increase of Mediterranean extreme daily rainfall in spite
Hurrell, J.W., Y. Kushnir, G. Ottersen, M. Visbeck, 2003:
of decrease in total values. – Geophys. Res. Lett. 29, 31-31-
The North Atlantic Oscillation: climatic significance and en-
31-34.
vironmental impact. – American Geophysical Union.
Bartholy, J., R. Pongrácz, 2007: Regional analysis of extreme
Karl, T., D. Easterling, 1999: Climate Extremes: Selected
temperature and precipitation indices for the Carpathian Basin
Review and Future Research Directions. – In: Karl, T.,
from 1946 to 2001. – Global Planetary Change 57, 83–95.
N. Nicholls, A. Ghazi (Eds.): Weather and Climate Ex-
Berg, P., C. Moseley, J.O. Haerter, 2013: Strong increase in
tremes. Springer Netherlands, 309–325.
convective precipitation in response to higher temperatures. –
Karl, T.R., N. Nicholls, A. Ghazi, 1999: Clivar/GCOS/WMO
Nature Geosci. 6, 181–185.
workshop on indices and indicators for climate extremes
Brunetti, M., L. Buffoni, F. Mangianti, M. Maugeri,
workshop summary. – Weather and Climate Extremes.
T. Nanni, 2004: Temperature, precipitation and extreme
Springer, 3–7.
events during the last century in Italy. – Global and Planetary
Klein Tank, A.M.G., G.P. Können, 2003: Trends in Indices
Change 40, 141–149.
of Daily Temperature and Precipitation Extremes in Europe,
Casanueva, A., C. Rodríguez-Puebla, M.D. Frías, N. Gon-
1946–99. – J. Climate 16, 3665–3680.
zález-Reviriego, 2014: Variability of extreme precipitation
Kronenberg, R., C. Bernhofer, 2015: A method to adapt
over Europe and its relationships with teleconnection pat-
radar-derived precipitation fields for climatological applica-
terns. – Hydrol. Earth Syst. Sci. 18, 709–725.
tions. – Meteor. Appl. 22, 636–649.
Dalelane, C., T. Deutschländer, 2013: A robust estima-
Kyselý, J., 2009: Trends in heavy precipitation in the Czech
tor for the intensity of the Poisson point process of extreme
Republic over 1961–2005. – Int. J. Climatol. 29, 1745–1758.
weather events. – Wea. Climate Extremes 1, 69–76.
Lenderink, G., E. van Meijgaard, 2008: Increase in hourly
Diggle, P., 1985: A kernel method for smoothing point process
precipitation extremes beyond expectations from temperature
data. – Applied Statistics, 138–147.
changes. – Nature Geosci. 1, 511–514.
Easterling, D.R., G.A. Meehl, C. Parmesan, S.A. Chan-
Lupikasza, E.B., S. Hansel, J. Matschullat, 2011: Regional
gnon, T.R. Karl, L.O. Mearns, 2000: Climate Ex-
and seasonal variability of extreme precipitation trends in
tremes: Observations, Modeling, and Impacts. – Science 289,
southern Poland and central-eastern Germany 1951–2006. –
2068–2074.
Int. J. Climatol. 31, 2249–2271.
Efromovich, S., 1999: Nonparametric curve estimation: meth-
Manton, M.J., P.M. Della-Marta, M.R. Haylock, K.J. Hen-
ods, theory and applications. Springer.
nessy, N. Nicholls, L.E. Chambers, D.A. Collins,
Field, C.B., 2012: Managing the risks of extreme events and dis-
G. Daw, A. Finet, D. Gunawan, K. Inape, H. Isobe,
asters to advance climate change adaptation: special report of
T.S. Kestin, P. Lefale, C.H. Leyu, T. Lwin, L. Maitre-
the intergovernmental panel on climate change. – Cambridge
pierre, N. Ouprasitwong, C.M. Page, J. Pahalad,
University Press.
N. Plummer, M.J. Salinger, R. Suppiah, V.L. Tran,
Frich, P., L.V. Alexander, P. Della-Marta, B. Gleason,
B. Trewin, I. Tibig, D. Yee, 2001: Trends in extreme daily
M. Haylock, A.M.G.K. Tank, T. Peterson, 2002: Observed
rainfall and temperature in Southeast Asia and the South Pa-
coherent changes in climatic extremes during the second half
cific: 1961–1998. - – Int. J. Climatol. 21, 269–284.
of the twentieth century. – Climate Res. 19, 193–212.
Markovic, D., M. Koch, 2005: Wavelet and scaling analysis of
Groisman, P.Y., R.W. Knight, D.R. Easterling, T.R. Karl,
monthly precipitation extremes in Germany in the 20th cen-
G.C. Hegerl, V.N. Razuvaev, 2005: Trends in Intense Pre-
tury: Interannual to interdecadal oscillations and the North At-
cipitation in the Climate Record. – J. Climate 18, 1326–1350.
lantic Oscillation influence. – Water Resour. Res. 41, W09420.
Haerter, J.O., P. Berg, S. Hagemann, 2010: Heavy rain inten-
Moberg, A., P.D. Jones, 2005: Trends in indices for extremes
sity distributions on varying time scales and at different tem-
in daily temperature and precipitation in central and western
peratures. – J. Geophys. Res. Atmos. 115, D17102.
Europe, 1901–99. – Int. J. Climatol. 25, 1149–1171.
Hänsel, S., S. Petzold, J. Matschullat, 2009: Precipitation
Moberg, A., P.D. Jones, D. Lister, A. Walther, M. Brunet,
Trend Analysis for Central Eastern Germany 1851–2006. –
J. Jacobeit, L.V. Alexander, P.M. Della-Marta, J. Lu-
In: Støelcová, K., C. Mátyás, A. Kleidon, M. Lapin,
terbacher, P. Yiou, D. Chen, A.M.G. Klein Tank, O. Sal-
F. Matejka, M. Blaženec, J. Škvarenina, J. , Holécy adié, J. Sigró, E. Aguilar, H. Alexandersson, C. Al-
(Eds.): Bioclimatology and Natural Hazards. Springer Nether- marza, I. Auer, M. Barriendos, M. Begert, H. Berg-
lands, 29–38. ström, R. Böhm, C.J. Butler, J. Caesar, A. Drebs,
Hardwick Jones, R., S. Westra, A. Sharma, 2010: Observed D. Founda, F.-W. Gerstengarbe, G. Micela, M. Maugeri,
relationships between extreme sub-daily precipitation, surface
H. Österle, K. Pandzic, M. Petrakis, L. Srnec, R. Tolasz,
temperature, and relative humidity. – Geophys. Res. Lett. 37, H. Tuomenvirta, P.C. Werner, H. Linderholm, A. Philipp,
L22805.348 A.S. Schaller et al: Occurrence frequency of heavy precipitation in Saxony Meteorol. Z. (Contrib. Atm. Sci.)
29, 2020
H. Wanner, E. Xoplaki, 2006: Indices for daily temperature Trömel, S., C.D. Schönwiese, 2007: Probability change of ex-
and precipitation extremes in Europe analyzed for the period treme precipitation observed from 1901 to 2000 in Germany. –
1901–2000. – J. Geophys. Res. Atmos. 111, D22106. Theor. Appl.Climatol. 87, 29–39.
Mudelsee, M., M. Börngen, G. Tetzlaff, U. Grünewald, WMO, 2013: Global Climate 2001–2010: A Decade of Climate
2004: Extreme floods in central Europe over the past Extreme – Summary Report. – WMO, World Meteorological
500 years: Role of cyclone pathway “Zugstrasse Vb”. – Organization, Geneva, Switzerland.
J. Geophys. Res. Atmos. 109, D23101. Zolina, O., C. Simmer, A. Kapala, S. Gulev, 2005: On the
Peterson, T., 2005: Climate change indices. – WMO bulletin robustness of the estimates of centennial-scale variability in
54, 83–86. heavy precipitation from station data over Europe. – Geophys.
Peterson, T., C. Folland, G. Gruza, W. Hogg, A. Mokssit, Res. Lett. 32, L14707.
N. Plummer, 2001: Report on the activities of the working Zolina, O., C. Simmer, A. Kapala, S. Bachner, S. Gulev,
group on climate change detection and related rapporteurs. – H. Maechel, 2008: Seasonally dependent changes of pre-
World Meteorological Organization, Geneva. cipitation extremes over Germany since 1950 from a very
Romano, E., E. Preziosi, 2013: Precipitation pattern analysis dense observational network. – J. Geophys. Res. Atmos. 113,
in the Tiber River basin (central Italy) using standardized D06110.
indices. – Int. J. Climatol. 33, 1781–1792. Zolina, O., C. Simmer, K. Belyaev, A. Kapala, S. Gulev,
Snethlage, M., 1999: Is bootstrap really helpful in point pro- 2009: Improving Estimates of Heavy and Extreme Precipi-
cess statistics? – Metrika 49, 245–255. tation Using Daily Records from European Rain Gauges. –
Stone, D.A., A.J. Weaver, F.W. Zwiers, 2000: Trends in Cana- J. Hydrometeorol.10, 701–716.
dian precipitation intensity. – Atmos. Ocean 38, 321–347. Zolina, O., C. Simmer, S.K. Gulev, S. Kollet, 2010: Chang-
Tebaldi, C., K. Hayhoe, J. Arblaster, G. Meehl, 2006: Go- ing structure of European precipitation: Longer wet periods
ing to the Extremes. – Climatic Change 79, 185–211. leading to more abundant rainfalls. – Geophys. Res. Lett. 37,
L06704.You can also read