Shoot thinning of Semillon in a hot climate did not improve yield and berry and wine quality - OENO One
←
→
Page content transcription
If your browser does not render page correctly, please read the page content below
Received: 1 January 2020 y Accepted: 3 April 2020 y Published: 16 July 2020
DOI:10.20870/oeno-one.2020.54.3.2984

Shoot thinning of Semillon in a hot climate did not improve yield
and berry and wine quality

Roberta De Bei1, Xiaoyi Wang1,2, Lukas Papagiannis1, Sigfredo Fuentes3, Matthew Gilliham1,2,
Steve Tyerman1,2 and Cassandra Collins1.2*
1The University of Adelaide, School of Agriculture, Food and Wine, Waite Research Institute, PMB 1 Glen
Osmond, 5064, South Australia. Australia
2ARC Industrial Transformation Training Centre for Innovative Wine Production, Waite Research Institute, PMB 1

Glen Osmond, 5064, South Australia, Australia
3The University of Melbourne, Faculty of Veterinary and Agricultural Sciences, Parkville, 3010 Victoria, Australia

*Corresponding author: cassandra.collins@adelaide.edu.au

     ABSTRACT

Aim: Shoot thinning is a common canopy management practice used to obtain a desired shoot density and to
improve canopy microclimate. Since thinning is often carried out manually, the cost can be high. In this study the
effect of severe shoot thinning (50 % of shoots removed) applied at EL 15 was investigated by comparing yield
components, canopy size, berry and wine chemistry, and sensory attributes to a non-thinned control for the variety
Semillon. The objective was to determine whether shoot thinning could change canopy architecture and lead to
improved fruit and wine chemistry and sensory characteristics.
Methods and Results: The trial was carried out over four consecutive growing seasons (starting in 2014-15) in the
Semillon block of the Coombe vineyard (Waite Campus, the University of Adelaide). Canopy architecture was
monitored at key phenological stages in each season and yield components were assessed at harvest. The harvested
fruit was used for chemical and sensory analysis of the berries. Wines were made and their chemistry and sensorial
attributes assessed. Shoot thinning reduced the total leaf area in only two of the four seasons, but single shoot leaf
area and cane weight were higher in shoot-thinned vines in all seasons. Shoot thinning did not reduce yield, despite
a large reduction in bunch number, because of increased bunch weight. Shoot thinning did not change berry and
wine chemistry. Similarly, little differences were observed in the sensory profile of berries and wines, and the
assessors preferred the wines obtained from shoot thinned vines in the last season only.
Conclusions: In this study, shoot thinning increased the leaf area per shoot and the cane weight, but yield and grape
and wine chemistry were unaffected. The vine balance indices leaf area/yield and yield/pruning weight were also
unaffected by the treatment, despite its intensity (50 % of shoots removed).
Significance and impact of the study: The practice of shoot thinning when applied at EL stage 15 (8-9 leaves
separated) was not effective as a technique to improve canopy microclimate and berry and wine chemistry for the
white variety Semillon in a hot Australian climate. By not applying shoot thinning growers could potentially make
significant savings without affecting yield or wine properties. Further research is needed to explore the effect and
timing of shoot thinning on other varieties and in different environments.
    KEYWORDS
canopy management, shoot thinning, leaf area, canopy porosity, Semillon, hot climate

OENO One 2020, 54, 3, 469-484                                     © 2020 International Viticulture and Enology Society - IVES 469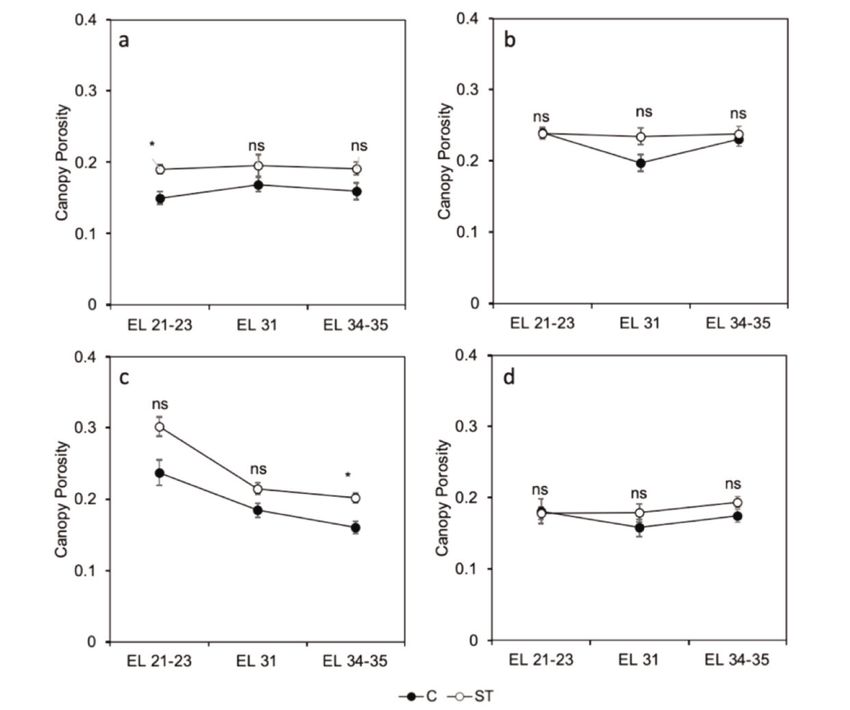
Roberta De Bei et al.

                  INTRODUCTION                                    those subjected to earlier shoot thinning scored
                                                                  higher than the control and vines which were
Practices implemented in the vineyard in order to                 thinned later in the season.
achieve vine balance and an optimal canopy
microclimate are known as canopy management                       Bernizzoni et al. (2011) applied shoot thinning
(Smart, 1992). Vineyard profitability can be                      on the Barbera variety when the shoots were 15-
increased using canopy manipulations to                           25 cm in length; the results showed a decrease in
improve canopy microclimate, grape quality, and                   yield (because of less bunches/vine) and berry
efficiency of spray application. The undesirable                  acidity, along with an increase in berry weights,
effects of excessive shading of developing                        bunch weights, total soluble solids, anthocyanins
grapes are well documented and include                            and phenolics. In another study, fruit parameters,
decreased sugar, tartaric acid, colour, phenolic                  such as pH and potassium, were found to
and flavour maturity (Gao and Cahoon, 1994;                       increase with shoot thinning severity
Morrison and Noble, 1990; Downey et al., 2006;                    (14 compared with 44 shoots/vine) when the
Ristic et al., 2007), and increased potassium and                 technique was carried out at EL 15-16 (Naor et
malic acid concentrations, pH and botrytis                        al., 2002). In conjunction with findings from
incidence (Smart and Robinson, 1991). Shading                     Reynolds et al. (1994a), Reynolds et al. (1994b)
has also been shown to reduce fruitfulness for                    and Reynolds et al. (1994c), the study concluded
future growing seasons (Dry, 2000), which in                      that wines decreased in quality with increased
turn promotes a vegetative growth cycle in the                    crop loads from higher winter pruning levels.
vine (Smart et al., 1986).                                        Both Bernizzoni et al. (2011) and Reynolds et al.
                                                                  (2005) highlighted the scarcity of specific studies
Count nodes left at winter pruning are not the                    on shoot thinning.
only nodes that can grow shoots; shoots can also
burst from latent and basal buds that were not                    The present study aimed to assess the effect of
considered during pruning (Pool et al., 1978).                    severe shoot thinning (50 % of total shoots
Shoots from non-count nodes can contribute to a                   removed) on the performance of Semillon grown
large proportion of non-fruit bearing canopy,                     in a hot Australian climate. Canopy architecture,
providing excess leaf area and thus shade,                        yield components, vine balance indices, grape
without contributing to yield (Smart and                          and wine chemistry and sensory attributes were
Robinson, 1991).                                                  assessed. By affecting canopy architecture, shoot
                                                                  thinning was expected to have a positive effect
Shoot thinning is often used to control shoot                     on the canopy microclimate, thus improving
density by removing shoots at a stage when                        berry and wine chemistry and sensory attributes.
fruitful ones can be determined and retained (15-
25 cm shoot length) (Bernizzoni et al., 2011).                        MATERIALS AND METHODS
This technique aims to improve canopy light                       1. Vineyard site
interception, leaf exposure, and ventilation, as
well as to reduce the number of carbohydrate                      Three rows of the variety Semillon (clone 32) in
sinks (developing shoots) with which other sinks                  the vineyard at the Waite Campus of the
(developing bunches) may compete (Smart,                          University of Adelaide, South Australia
1992). In highly regulated production areas, this                 (34°58’3.47»S; 138°38’0.43»E) were used for
technique is also used as an alternative to bunch                 the experiment. The trial was carried out over
thinning to achieve a target yield (Bernizzoni et                 four seasons starting in 2014-15; season one
al., 2011). The effects of shoot thinning on                      (S1=2014-15), season two (S2=2015-16), season
canopy architecture and fruit composition can                     three (S3=2016-17) and season four (S4=2017-
vary significantly depending on the timing of                     18). The vines were planted in 1990 on their own
application. Reynolds et al. (2005) showed that                   roots and trained to a bilateral spur-pruned
shoot thinning post flowering improved canopy                     cordon with the shoots vertically positioned and
microclimate in terms of leaf and bunch                           a spacing of 3 m between rows and 1.8 m
exposure compared with pre-flowering                              between vines. At pruning, 20 two-node
treatments. The later the technique was applied,                  spurs/vine were left to obtain approximately
the lower the total soluble sugars, titratable                    40 buds/vine. Vines were irrigated with 2 L/h in-
acidity, TA, anthocyanins and phenolics of                        line drippers and on average 0.5 ML/ha were
harvested berries (potential for delaying                         used in S1, S2 and S4. In S3, irrigation was not
maturity). In a sensory analysis of final wines,                  applied because of high seasonal rainfall.

470 © 2020 International Viticulture and Enology Society - IVES                             OENO One 2020, 54, 3, 469-484
Weather data were collected from the Kent Town At harvest, each middle vine was individually
weather station (station number 23090) of the harvested by counting and weighing the
Australian Bureau of Meteorology (http://www. bunches. To calculate yield components on a per
bom.gov.au/). The climate of the Adelaide Plains metre basis, the cordon length of each middle
region, where this vineyard is located, has been vine was also measured. Bunch weight was
described as hot (minimum GDD= 2072, calculated by dividing the total yield by the
maximum GDD = 2209) (Hall and Jones, 2010). number of bunches. From the harvested fruit,
samples of 50 berries were collected to be used
2. Trial design for the measure of total phenolics according to
Iland et al. (2004).
The trial was set up on three adjacent rows in a
fully randomised block design with each At pruning, the weight of all one-year-old wood
treatment repeated once along each row. Each was determined for each treatment replicate.
block consisted of nine consecutive vines (three
plots of three vines), and measurements were 4. Berry sensory assessment
carried out on each middle vine of each plot for a
Berry sensory assessments (BSA) were
total of nine vines per treatment.
conducted according to Olarte Mantilla et al.
Two treatments were assessed: a control (C) (no (2013) and as described in De Bei et al. (2019).
canopy interventions) and shoot thinning (ST). Briefly, 300 berries were collected from each
ST was carried out at EL stage 15 (Coombe, replicate in each season and kept at 4 °C until
1995) by removing exactly 50 % of the total assessment. A panel of 10 to 12 assessors with
shoots on the vines after counting. Double, short, previous BSA experience was first trained over
malformed and unfruitful shoots were preferably two 2-hour sessions as described in Olarte
removed. ST was carried out on October 18th, Mantilla et al. (2013), and an agreement was
14 th , 21 st and 16 th in S1, S2, S3 and S4 reached on the attributes to be assessed. A
respectively, which corresponded to GDD of number of 14 attributes were selected and
divided into three categories: pulp (juiciness,
127, 143, 121 and 139 respectively.
acidity, citrus flavour, tropical flavour, grassy
3. Canopy architecture, yield components and flavour, flavour intensity), skin (acidity,
grape composition bitterness, astringency, grape flavour, grassy
flavour) and seeds (colour, flavour, astringency).
The VitiCanopy app was used to measure canopy The formal assessments took place over three
size by taking an upward looking photo on each sessions, in which panellists were asked to taste
side of the middle vine in each panel for all either 12 or 15 three-berry samples. The
treatments (De Bei et al., 2016). The total leaf assessors were given a 0-15 line scale to assess
area per plant and per metre of cordon was then each attribute and a custom-designed App for
calculated according to the planimetric method mobile devices to collect the data. The App
described in De Bei et al. (2016). Measurements collated all the results for each assessor and sent
were carried out at the time of shoot thinning them to a nominated email account.
(EL 15), as well as around flowering (EL 21-23),
berries at pea size (EL 31) and veraison (EL 34- BSA was carried out in the sensory facility of
35). the University of Adelaide at the Waite Campus
with the approval of the University of Adelaide
From EL 35, samples of 100 berries were ethics committee (H2017-054).
collected weekly from each replicate to monitor
5. Winemaking
maturity. Harvest was carried out at Total
Soluble Solids (TSS) ranging between 21 and The harvested fruit from each replicate was
23 o Brix (to align with commercial harvest pooled into vented crates (20 kg) to be used for
levels). The 100 berry samples were used to winemaking. Three wines from each treatment
measure berry weight, after which the juice was were produced by maintaining the vineyard
extracted to measure pH, titratable acidity (TA) replicates. The fruit was cold soaked overnight
(Mettler Toledo auto titrator, Greifensee, at 2 °C and then crushed and de-stemmed using
Switzerland) and TSS (digital refractometer a combined crusher de-stemmer (Grifo
BRX-242 Erma Inc. Tokyo, Japan). Macchine Enologiche, Piadena, Italy). The
OENO One 2020, 54, 3, 469-484 © 2020 International Viticulture and Enology Society - IVES 471Roberta De Bei et al.
detailed winemaking procedure is described in Treatment comparisons within seasons were
De Bei et al. (2019). performed via t-test. ANOVA was performed to
extract effects of treatment, season and their
All finished wines were bottled using 375 mL interaction (treatment x season) over the four
glass bottles, then crown sealed and stored until years. Canopy architecture measures were
sensory and chemical analysis in a 22 °C analysed using repeated measures ANOVA and
controlled environment room. the means separated using Fisher’s LSD. Berry
and wine sensory results were analysed using the
6. Wine chemical analysis
product and sensory panel performance analysis
Wine pH and TA were measured as described by tool of the XLSTAT package. The significance
Iland et al. (2004) using an autotitrator (Crison level used to separate means was pTABLE 2. Effect of shoot thinning (ST) on yield components and leaf area of Semillon grown in the Coombe vineyard of the University of Adelaide,
Waite Campus, Adelaide, Australia.
Season Treatment Shoots LA at EL 35 LA/Shoot Yield (Y) Bunches Bunch weight Berry weight Pruning weight (P) Cane weight LA/Y
Y/P
(S) (T) (#/m) (m2/m) (m2) (kg/m) (#/m) (g) (g) (kg/m) (g) (m2/kg)
C 23.2 a 9.9 a 0.44 b 5.5 35.3 a 160.2 1.47 0.76 a 34.2 b 1.8 7.1
S1 ST 12.9 b 7.2 b 0.59 a 4.6 25.1 b 183.5 1.50 0.59 b 47.0 a 1.6 8.1
OENO One 2020, 54, 3, 469-484
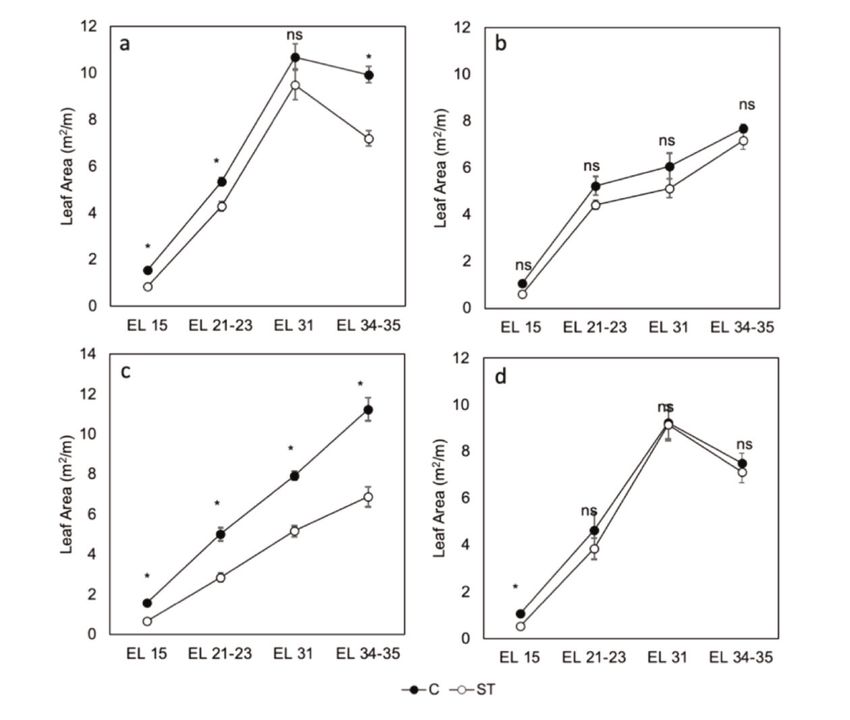
p valueRoberta De Bei et al. FIGURE 1. Total leaf area measured at four phenological stages (EL 15, 23, 32 and 37; Coombe, 1995) and in four seasons on Semillon vines grown in the Coombe vineyard of the University of Adelaide, Waite Campus, Adelaide, Australia. a=S1=season one=2014-15; b=S2=season two=2015-16; c=S3=season three=2016-17; d=S4=season four=2017-18 C=control (black marker), ST=shoot thinning (white marker). Line bars indicate the standard error of the means. Means were separated by repeated measures ANOVA and Fisher’s LSD test. * indicate significance at P
FIGURE 2. Canopy porosity measured at four phenological stages (EL 15, 23, 32 and 37;
Coombe, 1995) and in four seasons on Semillon vines grown in the Coombe vineyard
of the University of Adelaide, Waite Campus, Adelaide, Australia.
a=S1=season one=2014-15; b=S2=season two=2015-16; c=S3=season three=2016-17; d=S4=season four=2017-18 C=control
(black marker), ST=shoot thinning (white marker). Line bars indicate the standard error of the means.
Means were separated by repeated measures ANOVA and Fisher’s LSD test. * indicate significance at P0.05).
canopy porosity between treatments were
                                                                  Wine alcohol only differed in S3, reflecting the
observed.                                                         difference in harvest TSS. Total phenolics in the
4. Berry and wine chemistry                                       wines were only measured in the first three
                                                                  seasons. In S2 and S3, C and ST wines differed
Treatments C and ST were always harvested on                      in a non-conclusive way: ST wines were higher
the same day in each season and, apart from in                    in phenolics in 2015-16, while in 2016-17 they
S3, there was no difference in TSS. In S3, due to                 were lower. In the last season, malic acid was
heavy rainfall, the sanitary status of the grapes                 measured in the wines, but no differences
caused harvest date to be the same as C, despite                  (p>0.05) were found.
ST showing a much lower TSS. A tendency for                       5. Berry and wine sensory analysis
delayed ripening of ST was also observed in
2017-18. The pH of the must/juice never                           The expert panel assessed the fresh berries of
differed, while in the wines C showed a higher                    both treatments in each season and different
pH in S2. The acidity of the juice was again                      sensory profiles were evaluated. Juiciness of the

OENO One 2020, 54, 3, 469-484                                   © 2020 International Viticulture and Enology Society - IVES 475
TABLE 3. Effect of shoot thinning (ST) on berry and wine chemistry of Semillon grown in the Coombe vineyard of the University of Adelaide, Waite
Campus, Adelaide, Australia.
Titratable Berry total Berry
Treatment Total soluble Wine titratable Wine total
(S) pH acidity phenolics Epicatechins Alcohol Wine pH
Roberta De Bei et al.
(T) solids (Brix) acidity phenolics (au)
(g/L) (mg/g) (mg/g)
C 22.2 3.05 10.08 0.90 5.22 14.5 3.12 7.6 7.0
S1 ST 22.6 3.10 10.20 1.02 5.44 14.1 3.13 7.8 7.3
p-value ns ns ns ns ns ns ns ns ns
C 20.2 3.29 6.46 b 0.64 4.31 13.1 3.32 7.8 6.0
S2 ST 20.2 3.27 7.12 a 0.66 4.34 12.9 3.12 8.0 6.6
p-value ns ns 0.01 ns ns ns 0.03 ns ns
C 23 3.12 8.52 0.66 1.78 13.8 2.91 7.9 10.3
S3 ST 20.2 3.13 8.95 0.63 1.71 12.0 2.88 8.3 8.5
p-value 0.03 ns ns ns ns 0.02 ns ns ns
C 22.2 3.16 6.43 0.47 3.48 14.7 3.66 5.7 -
476 © 2020 International Viticulture and Enology Society - IVES
S4 ST 20.7 3.13 7.15 0.52 3.81 13.3 3.62 5.8 -
p-value ns ns ns ns ns ns ns ns
Treatment ns ns ns ns ns 0.006 0.03 ns ns
SeasonFIGURE 3. Radar plots of attributes found different at p 0.1 in the berries of Control (C) (solid line) and shoot thinning (ST) (dashed line) treatments for Semillon grown in the Coombe vineyard of the University of Adelaide, Waite Campus, Adelaide, Australia. a=S1=season one=2014-15; b=S2=season two=2015-16. P=Pulp, SK=Skin, S=Seeds, Fl=flavour. berries was different in each season [it was also generally more aromatic and in particular more the only discernible difference in the last season tropical than ST (Figure 4c). The tropical (p
Roberta De Bei et al.

FIGURE 4. Radar plots of attributes found different at p 0.1 in the wines of control (C) (solid line)
and shoot thinning (ST) (dashed line) treatments applied to Semillon grown in the Coombe vineyard,
Waite Campus, Adelaide.
a=S1=season one=2014-15; b=S2=season two=2015-16; c=S3=season three=2016-17; d=S4=season four=2017-18. A=Aroma,
Fl=flavour, MF=mouthfeel.

they are mostly from Europe or the USA. To the                    In a comprehensive study, Reynolds et al. (2005)
best of our knowledge, in the past decade, only                   compared the results of shoot thinning conducted
one published study - complementary to this                       at five phenological stages: from three expanded
one - has been carried out in Australia on Shiraz                 leaves to the stage of cell division
and Semillon in Adelaide (Wang et al., 2019).                     (corresponding to EL 9 to 31 (Coombe, 1995)).
                                                                  In other studies by Silvestroni et al. (2019, 2016)
Shoot thinning can be carried out mechanically                    and Bravetti et al. (2012), shoot thinning was
(Geller and Kurtural, 2013; Kurtural et al., 2013;                done at the phenological stages of pre-
Brillante et al., 2017), with little control over the             flowering/flowering. In our study, shoot thinning
type and number of shoots removed. More often                     was carried out at EL 15, when shoots were
studies have reported on manual shoot thinning                    between 15-30 cm in length and never more than
with the number of shoots being adjusted to 12                    40 cm (Morris et al., 2004), thus aligning with
to 20 per vine (Naor et al., 2002; Bravetti et al.,               timing of the operation in commercial vineyards
2012; Silvestroni et al., 2019; Silvestroni et al.,               in Australia.
2016) to obtain a per metre shoot density of 8 to
                                                                  1. Leaf area and canopy porosity
15, depending on the vine spacing of the trial
site. The choice of shoot density is likely based                 According to Smart (1988), shoot densities of 15
on the numerous studies demonstrating that a                      to 25 shoots/m improve canopy microclimate
density of 15 to 25 shoots per metre of cordon                    and allow the desired grape composition to be
can improve canopy microclimate (Reynolds et                      attained. In the present study, the shoot density
al., 1994a; Reynolds et al., 1994c; Smart, 1988).                 varied from 21 to 38 shoots/m in the C (average
In the present study, instead of adjusting the                    of 28.5) and from 12 to 19 shoots/m in ST
number of shoots to a defined amount per metre,                   (average=14.5). The variability in shoot number
exactly 50 % of the total number was removed;                     between seasons was likely due to the influence
this has not been trialled in previous studies.                   of the high rainfall observed in S3, which caused

478 © 2020 International Viticulture and Enology Society - IVES                             OENO One 2020, 54, 3, 469-484
a higher than usual number of non-count shoots Moreover, they found that the increased leaf area
to burst. The removed leaf area varied from 0.54 was mostly due to larger leaf blades (+57 %
to 0.86 m2/m of cordon. Leaf area could not be compared to C). Similarly, Myers et al. (2008)
measured after veraison, due to the installation of compared densities of 12, 20 and 28 shoots/vine
bird nets in the whole vineyard. However, given and found no differences in total leaf area per
the short veraison-to-harvest period (from 14 to plant; however, the leaf area per shoot increased
28 days in the four years) (De Bei et al., 2019) as the shoot density decreased.
and the fact that irrigation ceased at veraison, it
is assumed that leaf area at veraison would have Canopy porosity is a measure of canopy
been very similar to the one at harvest. openness; the higher the value, the more open a
canopy is. Canopy porosity is therefore linked to
The four seasons differed climatically, with S2 canopy microclimate (De Bei et al., 2016;
being extreme in terms of heat and low rainfall Fuentes et al., 2014). In S1 and S3, the shoot-
(especially in winter) and S3 in terms of low thinned vines were characterised by a tendancy
temperature and high rainfall. These two seasons for higher porosity throughout the season
also had the earliest (DOY21) and latest (significant only at EL 21-23 in S1 and EL 34-35
(DOY61) harvests respectively (De Bei et al., in S3). In the other two seasons, there were no
2019). differences in porosity between the treatments.
Reynolds et al. (2005) also observed similar
The within season canopy development pattern canopy behaviour (i.e., no differences in leaf and
in the two treatments and the four seasons was bunch exposure) when shoot thinning was
very similar. S1 and S4 (the two “average carried out at EL 15. According to Palliotti and
seasons”) showed a very comparable leaf area Silvestroni (2004), a grapevine canopy should
pattern with a steep increase until EL 31 and a have between 10 and 20 % gaps, while Smart
reduction thereafter, attributable to a routine (1987) recommends values of up to 40 %. In hot
canopy trimming operation. In general, in the Australian conditions, in order to avoid
early phenological stages and until flowering, ST excessive bunch exposure and the risk of
showed lower leaf area, apart from in S4. By EL sunburn damage, the more conservative value of
31, however, the ST canopies reached and 10-20 % are considered more adequate for white
followed the growth of C in three of the four varieties, such as Semillon. In all seasons, the
seasons. S3 was characterised by heavy rainfalls porosity values were in the range of 15 and 25
and during this season the C vines reached their %, in accordance with those recommended by
highest leaf area of the whole trial. ST, however, Palliotti and Silvestroni (2004).
despite following the growth pattern observed in
the C, never reached a similar leaf area; 2. Yield components
furthermore, the leaf area measured for ST at
veraison did not differ from previous seasons at Shoot thinning did not affect yield in this study.
the same phenological stage. In a two-season Reynolds et al. (2005) only found differences in
trial, Bernizzoni et al. (2011) reported no yield when shoot thinning was applied after EL
differences in final total main and lateral leaf 27. The two long term studies by Silvestroni et
area per vine upon a 40-50 % reduction in shoot al. (2016 and 2019) (four years for Sangiovese
number (as in S2 and S4 in this study). Miller et and six years for Montepulciano) did not show
al. (1996) saw no difference in final leaf area in any differences in yield when the number of
Concord pruned from 20 to 160 nodes per vine; shoots was reduced by 42 % and 44 % in
similarly, Myers et al. (2008) did not find Montepulciano and Sangiovese respectively.
differences in leaf area with shoot densities of Bravetti et al. (2012) also found no differences
12, 20 and 28 shoots/vine. in yield between a control and a shoot-thinned
treatment; however, in this case, the shoot
Despite the leaf area per plant not being different thinning only lowered the number of shoots per
in two of the four seasons, the single shoot leaf vine from 19 to 14. Other authors have reported
area was higher in ST (not significant in S3). lower yields in shoot-thinned vines (Naor et al.,
Bernizzoni et al. (2011) observed that, upon 2002 for Sauvignon Blanc; Morris et al., 2004
reductions of 40 and 50 % of shoots over two for French-American hybrids; Sun et al., 2012
seasons through shoot thinning, the total leaf for Corot noir; Myers et al., 2008 for
area was not different, but the single shoot leaf Sangiovese). Bernizzoni et al. (2011) found
area increased by 43 and 50 % respectively. vegetative growth compensation in ST vines
OENO One 2020, 54, 3, 469-484 © 2020 International Viticulture and Enology Society - IVES 479Roberta De Bei et al.
(Barbera variety) and, despite a 60 % reduction In an experiment conducted in California,
in bunch number, yield was only 25 % lower due Kliewer and Dokoozlian (2005) found that the
to compensation by heavier bunches and berries. optimal LA/Y ranged from 0.5 to 1.2, while Y/P
Similarly, in this study, ST compensated for the varied from 4 to 10 depending on the cultivar,
lower number of shoots and bunches by site and management. Smart and Robinson
increased bunch weight (not significantly in the (1991) recommend LA/Y values of 1.2 m2/kg. In
first season). Other studies have also found shoot this study LA/Y and Y/P were different between
thinning to produce less, but heavier, bunches treatments in only one of the four seasons (S3),
(Morris et al., 2004; Bernizzoni et al., 2011; when they were respectively lower and higher
Silvestroni et al., 2016; Silvestroni et al., 2019), for ST. This was an unusually wet season, with
while Reynolds et al. (2005) found no the highest measurements of yield for both
differences in bunch number and weight when treatments in the whole trial and the largest
amount of canopy (highest LA) and pruning
shoot thinning was applied at EL 15. Naor et al.
weight for C vines. Bravetti et al. (2012) also
(2002) speculated that the reduction of sinks
found lower LA/Y in ST, while Silvestroni et al.
(bunches and growing tips) in shoot-thinned (2019) report no effect of ST on the Ravaz index.
vines allows for greater allocation of assimilates In the four seasons, LA/Y varied from 1.1 to 1.8
and reserves to the remaining organs, thus m2/kg in C, and from 1.1 to 1.6 in ST, with a
making them stronger sinks. Berry weight four-year average of 1.5 and 1.4 respectively;
tended to be higher in ST, but significantly so these values are slightly higher than
only in one season, similar to observations by recommendations by Kliewer and Dookozlian
Naor et al. (2002). It can thus be speculated that (2005) and Smart and Robinson (1991). Despite
ST resulted in a higher number of berries per yields of over 5 kg/m, the vines in this
bunch, as shown by Wang et al., (2019); experiment can be considered to have been
however, berry number was not measured in this under-cropped according to these indices, thus
study. Moreover, the significantly heavier, and confirming once again their dependence on site,
more compact bunches produced by shoot- climate and cultivar (De Bei et al., 2019; Myers
thinned vines could make them more prone to et al., 2008). The crop load only differed
disease (to Botrytis in particular), as shown by between treatments in S3, varying from 7.1 to
Wang et al. (2019). Numerous studies reported 11.7 for C and 8.1 to 12.3 for ST (average C =
that pruning weight was not affected by number 8.7, ST= 10.5), and thus falling, on average,
of shoots per vine, due to a compensation within range of what is considered balanced,
mechanism which manifests itself as increased with a tendency of shoot-thinned vines to show
shoot vigour (Freeman et al., 1979; Reynolds higher Y/P. In contrast, other authors have
and Wardle, 1989; Reynolds et al., 1994b; reported lower crop load at lower shoot densities
Morris et al., 2004). This study supports these (Naor et al., 2002; Morris et al., 2004; Sun et al.,
findings: the pruning was the same in two of the 2012). When considering cane weight at pruning
four seasons, but the weight of the single canes as an indicator of balance, Smart and Smith
was much higher for ST in three of the four (1988) suggested an optimum between 20 and
30 g/cane. In this study, all the shoot-thinned
seasons. In the seasons when the difference was
vines can be considered out of balance with
not significant, ST canes were 30 % heavier.
canes weighing above 30 g in all seasons. Naor
Naor et al. (2002) found an increased pruning et al. (2002) also showed the two indices to be
weight at low shoot density in only the third year highly correlated (R 2 =0.86); in this study
of a three-year study. however, no relationship was found between the
3. Vine balance indices indices (R2=0.1).
The equilibrium between vegetative growth and 4. Berry and wine chemistry
yield which delivers the best possible fruit The trial was harvested at TSS between 20 and
composition for the target wine style is referred 22 °Brix to align with commercial harvest levels
to as vine balance. Commonly used indicators of for Semillon. In S3, the harvest TSS for ST was
vine balance are the yield to pruning weight much lower than for the C, indicating a delay in
(Y/P) ratio (also known as Ravaz index (Ravaz, ripening in this treatment. Similarly, the TSS in
1911) or crop load (Bravdo et al., 1985)) and the S4 was 1.5 °Brix lower for ST (not significant),
ratio of leaf area (m2) to yield (LA/Y). again indicating a delay in the ripening process
480 © 2020 International Viticulture and Enology Society - IVES OENO One 2020, 54, 3, 469-484compared to the C. This could be attributed to Higher juiciness was also found in the pulp of
the greater crop load of ST vines in the last two ST vines in S3; however, ST berries were also
seasons, as confirmed by the high Y/P. This described as grassy/green, which is indicative of
aligns with findings from Naor et al., (2002) less ripe fruit (Le Moigne et al., 2008) and in
which showed a delay in ripening when crop agreement with the delay in ripening observed
load increased; however, in contrast to the for ST in this rainy season (see above). Juiciness
present study, their crop load increased with was different in all four seasons, and was lower
higher shoot densities. Geller and Kurtural for ST in S2 and S4, which may suggest that this
(2013), on the other hand, observed faster attribute is linked more to the season (weather
ripening at lower shoot densities, and Reynolds conditions, irrigation) than to the canopy
et al. (2005) found higher TSS at harvest in management treatment. In S2, ST berries were
shoot thinned vines. Bernizzoni et al. (2011) also described as being more tropical, which is a
found increased TSS in shoot thinned vines, but desirable descriptor for Semillon. The berries
their yield differed between treatments and was were also generally characterised by enhanced
lower for ST. Of the other measured berry flavour intensity; in a commercial setting this is
chemistry attributes, in S2, only TA differed indicative of better-quality fruit.
between treatments and was higher for ST. This
is in agreement with Reynolds et al. (2005), who In their shoot thinning trial, Reynolds et al.
found that shoot thinning generally reduced TA, (2005) only found minor differences in wine
unless it was carried out before EL 15, in which sensory among all treatments. In our study, the
case it increased. Regarding berry chemistry results of the wine sensory analysis uncovered
parameters, Silvestroni et al. (2016 and 2019) differences between treatments in all the seasons
and Bravetti et al. (2012) did not report any and showed greater differences compared to the
differences between control and shoot thinned BSA. As many as ten out of the 21 assessed
vines for Montepulciano and Sangiovese. Morris attributes differed between treatments in S1. ST
et al. (2004) did not find any differences in TSS, had an enhanced confectionary aroma and
pH and TA after shoot thinning the varieties flavour, together with a greater tropical flavour
Aurore and Viollard Noir, while shoot-thinned and an overall higher fruit length, which could
Chancellor vines had higher TSS and pH at all be considered as desirable attributes for
harvest. Semillon wine and to be preferred by consumers
(Bogart and Bisson, 2006). Naor et al. (2002)
5. Berry and wine sensory and Sun et al. (2012) also found an increase in
Despite the recognised importance of Berry fruity characters at lower shoot densities. Work
Sensory Assessment (BSA) as a tool for helping on Merlot by Nicolli et al. (2018) found that
growers and winemakers to understand the link lower bud load left at pruning, and hence lower
between berry and wine characteristics (Olarte shoot densities, produced more aromatic and
Mantilla et al., 2012), its use is limited in floral wines. On the other hand, in the same
scientific research. BSA has been previously season, less desirable attributes, such as
used to assess the effect of canopy management bitterness, acidity and astringency were more
strategies, such as leaf plucking, on the sensory apparent in the control wines. In agreement with
profile of berries (Lohitnavy et al., 2010; De Bei the BSA, which showed enhanced flavour
et al., 2019); however, to the best of our intensity for ST, the wines in S2 were more
knowledge, no other studies have reported the intense in all the four different attributes (grassy
effect of shoot thinning on the sensory aroma, floral flavour, body and alcohol length).
characteristics of the grapes. In the third season, the control wines were
described as higher in all the different attributes,
In this study, BSA was carried out by an expert except for astringency. This is most likely due to
panel in all four seasons and it was found that the unfavourable weather conditions, leading to
shoot thinning affected the sensory profile of the the harvest of ST at a much lower TSS, which
berries. Particularly in the first season, the ST were hence less ripe than C. Interestingly, in the
berries were juicier, the skins were less acidic last season, C wines were assessed as being
and did not have as much of a grassy flavour as higher in all the attributes that were found to be
the control, and the seeds were less astringent. significantly different; however, in this case,
These attributes correspond to berry ripeness, they were not positive attributes, and in fact, ST
despite TSS not differing between treatments. wines were preferred (greater likeability score).
OENO One 2020, 54, 3, 469-484 © 2020 International Viticulture and Enology Society - IVES 481Roberta De Bei et al.
CONCLUSIONS Acknowledgements: This research was
financially supported by Wine Australia. Wine
Semillon vines grown in a hot Australian climate Australia invests in and manages research,
responded to an early season severe reduction in development and extension on behalf of
shoot number with an increase in leaf area per Australia’s grape growers and winemakers, and
shoot and a higher cane weight. Meanwhile, the Australian Government. We would like to
yield compensated for the reduced bunch thanks all of the Viticulture laboratory staff and
number via an increase in bunch weight and interns at the University of Adelaide, in
berries per bunch. Berry and wine chemistry and particular Ms Annette James, who assisted in
sensory were differentially affected by the data collection. The authors also acknowledge all
treatment depending on the season; however, the the sensory assessors who participated in the
effect on these parameters was minimal. study. A special thank you to the Coombe
vineyard staff, in particular Mr Phil Earl and
In contrast to what has been reported in previous Mr Ben Pike for their support with the trial.
literature, our study showed that in this trial the
variety Semillon achieved better vine balance REFERENCES
with shoot densities of between 20 and 40 per m. Bernizzoni F., Civardi S., Van Zeller M., Gatti M.
Probably due to the early application (EL 15), and Poni S., 2011. Shoot thinning effects on seasonal
lower densities were associated with excessive whole-canopy photosynthesis and vine performance
vegetative growth, which may have negatively in Vitis vinifera L. cv. Barbera. Australian Journal of
affected exposure. In Australian vineyards, it is Grape and Wine Research, 17, 351–357.
common to carry out shoot thinning at EL 15 doi:10.1111/j.1755-0238.2011.00159.x
(but not at the intensity reported in this study). Bogart K. and Bisson L., 2006. Persistence of vegetal
Practical implications, such as the difficulty in characters in winegrapes and wine. Practical Winery
removing shoots at later stages, must be taken & Vineyard Journal, 26, 13-20.
into account when considering the timely Bravdo B., Hepner Y., Loinger C., Cohen S. and
application of this management practice. The Tabacman H., 1985. Effect of crop level and crop
estimated cost of 700$/ha is likely to increase if load on growth, yield, must and wine composition,
the operation is carried out at a later and quality of Cabernet-Sauvignon. American
Journal of Enology and Viticulture, 36, 125-131.
phenological stage, since the removal of more
vigorous shoots could require the use of Bravetti B., Lanari, V., Manni E. and Silvestroni, O.,
secateurs, and extra time could be required to 2012. Canopy density modification and crop control
strategies on ‘Montepulciano’ (Vitis vinifera L.). Acta
remove the shoots from the canopy (if the wires
Horticulturae, 931, 331-337. doi:10.17660/
have already been lifted in a VSP system for ActaHortic.2012.931.37
example).
Brillante L., Martínez-Lüscher J. and Kurtural S.K.,
The findings from this study showed no 2017. Applied water and mechanical canopy
evidence to support the use of shoot thinning as management affect berry and wine phenolic and
aroma composition of grapevine (Vitis vinifera L., cv.
a management practice to obtain balanced vines,
Syrah) in Central California. Scientia Horticulturae,
or as a method of crop control, in Semillon in 227, 261-271. doi:10.1016/j.scienta.2017.09.048
Australian conditions. Alterations of the vine
Coombe B.G., 1995. Growth stages of the grapevine:
balance did not influence fruit composition; this
adoption of a system for identifying grapevine growth
study might therefore also suggest that new stages. Australian Journal of Grape and Wine
methods to determine vine balance may need to Research, 1, 104–110. doi:10.1111/j.1755-0238.
be adopted for more dependable results when 1995.tb00086.x
developing management strategies for different De Bei R., Fuentes S., Gilliham M., Tyerman S.,
climates, regions and varieties. Edwards E., Bianchini N., Smith J. and Collins C.,
2016. VitiCanopy: A free computer App to estimate
This study also confirms previous findings that canopy vigor and porosity for grapevine. Sensors, 16,
management practices aiming to manipulate 585. doi:10.3390/s16040585
canopy microclimate might be more effective in
De Bei R., Wang X., Papagiannis L., Cocco M.,
cool climates than in the hot Australian climate. O’Brien, P., Zito M., Ouyang J., Fuentes S.,
More research is needed to investigate the effect Gilliham M., Tyerman S. and Collins C., 2019.
of time and intensity of shoot thinning for other Postveraison leaf removal does not consistently delay
varieties in Australian environments. ripening in Sémillon and Shiraz in a hot Australian
482 © 2020 International Viticulture and Enology Society - IVES OENO One 2020, 54, 3, 469-484climate. American Journal of Enology and grapevine (Vitis vinifera cv. Syrah) cultivar under
Viticulture, 70, 398-410. doi:10.5344/ajev.2019. mechanical canopy management. HortScience, 48,
18103 576-583. doi:10.21273/HORTSCI.48.5.576
Downey M.O., Dokoozlian N.K. and Krstic M.P., Le Moigne M., Maury C., Bertrand D. and Jourjon F.,
2006. Cultural practice and environmental impacts on 2008. Sensory and instrumental characterisation of
the flavonoid composition of grapes and wine: a Cabernet Franc grapes according to ripening stages
review of recent research. American Journal of and growing location. Food Quality and Preference,
Enology and Viticulture, 57, 257-268. 19, 220-231. doi:10.1016/j.foodqual.2007.03.004
Dry P., 2000. Canopy management for fruitfulness. Lohitnavy N., Bastian S. and Collins C., 2010. Berry
Australian Journal of Grape and Wine Research, 6, Sensory attributes correlate with compositional
109-115. doi:10.1111/j.1755-0238.2000.tb00168.x changes under different viticultural management of
Freeman B.M., Lee T.H. and Turkington C.R., 1979. Semillon (Vitis vinifera L.). Food Quality and
Interaction of irrigation and pruning level on growth Preference, 21, 711-719. doi:10.1016/j.foodqual.
and yield of Shiraz vines. American Journal of 2010.05.015
Enology and Viticulture, 30, 218-223. Miller D.P., Howell G.S. and Flore J.A., 1996. Effect
Fuentes S., Poblete-Echeverría C., Ortega-Farias S., of shoot number on potted grapevines: I. Canopy
Tyerman S. and De Bei R., 2014. Automated development and morphology. American Journal of
estimation of leaf area index from grapevine canopies Enology and Viticulture, 47, 244-250.
using cover photography, video and computational Morris J.R., Main G.L. and Oswald O.L., 2004.
analysis methods. Australian Journal of Grape and Flower cluster and shoot thinning for crop control in
Wine Research, 20, 465-473. doi:10.1111/ajgw.12098 French-American hybrid grapes. American Journal of
Gao Y. and Cahoon GA., 1994. Cluster shading Enology and Viticulture, 55, 423-426.
effects on fruit quality, fruit skin color and Morrison J.C. and Noble A.C., 1990. The effects of
anthocyanin content and composition in Reliance leaf and cluster shading on the composition of
(Vitis hybrid). Vitis, 33, 205-209. Cabernet-Sauvignon grapes and on fruit and wine
Geller J.P. and Kurtural S.K., 2013. Mechanical sensory properties. American Journal of Enology and
canopy and crop-load management of Pinot gris in a Viticulture, 41, 193–200.
warm climate. American Journal of Enology and Myers J.K., Wolpert J.A. and Howell G.S., 2008.
Viticulture, 64, 65-73. doi:10.5344/ajev.2012.12045 Effect of shoot number on the leaf area and crop
Gladstones J., 2011. Wine, Terroir and Climate weight relationship of young Sangiovese grapevines.
Change. Winetitles: Adelaide, Australia. American Journal of Enology and Viticulture, 59,
422-424.
Hall A. and Jones G.V., 2010. Spatial analysis of
climate in wine grapegrowing regions in Australia. Naor A., Gal Y. and Bravdo B., 2002. Shoot and
Australian Journal of Grape and Wine Research, 16, cluster thinning influence vegetative growth, fruit
389-404. doi:10.1111/j.1755-0238.2010.00100.x yield, and wine quality of Sauvignon blanc
grapevines. Journal of the American Society for
Iland P., Bruer N., Edwards G., Colghiris S. and Horticultural Science, 127, 628-634. doi:10.21273/
Wilkes E., 2004. Chemical analysis of grapes and JASHS.127.4.628
wine: techniques and concepts, 2nd ed. Patrick Iland
Wine Promotions Pty Ltd: Adelaide, Australia. Nicolli K.P., Biasotob A.C.T., Souza-Silva E.A.,
Guerra C.C., dos Santos H.P., Welke J.E. and
Intrieri C. and Poni S., 1995. Integrated evolution of Zini CA., 2018). Sensory, olfactometry and
trellis training systems and machines to improve comprehensive two-dimensional gas chromatography
grape quality and vintage quality of mechanized analyses as appropriate tools to characterize the
Italian vineyards. American Journal of Enology and effects of vine management on wine aroma. Food
Viticulture, 46, 116-127. Chemistry, 243, 103-117. doi:10.1016/j.foodchem.
Julian J.W., Seavert C.F., Skinkis P.A., 2017.09.078
VanBuskirk P. and Castagnoli S., 2008. Vineyard Olarte Mantilla S.M., Collins C., Iland P.G., Johnson
economics: Establishing and producing Pinot noir T.E. and Bastian S.E.P., 2012. Review: Berry sensory
wine grapes in western Oregon. OSU Extension assessment: concepts and practices for assessing
Service. winegrapes sensory attributes. Australian Journal of
Kliewer W.M. and Dokoozlian N.K., 2005. Leaf Grape and Wine Research, 18, 245-255.
area/crop weight ratios of grapevines: Influence on doi:10.1111/j.1755-0238.2012.00203.x
fruit composition and wine quality. American Journal Olarte Mantilla S.M., Collins C., Iland P.G.,
of Enology and Viticulture, 56, 170-181. Kidman C.M., Jordans C. and Bastian S.E.P., 2013).
Kurtural S.K., Wessner L.F. and Dervishian G., 2013. Comparison of sensory attributes of fresh and frozen
Vegetative compensation response of a procumbent wine grape berries using Berry Sensory Assessment.
OENO One 2020, 54, 3, 469-484 © 2020 International Viticulture and Enology Society - IVES 483Roberta De Bei et al.
Australian Journal of Grape and Wine Research, 19, on performance of high-yielding Sangiovese
349-357. doi:10.1111/ajgw.12041 grapevines. American Journal of Enology and
Palliotti A. and Silvestroni O., 2004. Ecofisiologia Viticulture, 67, 407-418. doi:10.5344/ajev.2016.
applicata alla vite. Viticoltura ed Enologia Biologica. 15093
Ed agricole. Silvestroni O., Lanari V., Lattanzi T., Palliotti A.,
Pool R., Pratt C. and Hubbard H., 1978. Structure of Vanderweide J. and Sabbatini P., 2019. Canopy
base buds in relation to yield of grapes. American management strategies to control yield and grape
Journal of Enology and Viticulture, 29, 36-41. composition of Montepulciano grapevines. Australian
Ravaz M.L., 1911. L’effeuillage de la vigne. Ann. Journal of Grape and Wine Research, 25, 30-42
l’École Nat. Agric. Montpellier 11, 216-244. doi:10.1111/ajgw.12367
Reynolds A.G. and Wardle D.A., 1989. Impact of Smart R.E., 1992. Canopy management in
various canopy manipulation techniques on growth, Coombe, B.G. and Dry, PR. (eds) Viticulture Vol 2.
yield, fruit composition, and wine quality of Practices. 85-103.
Gewürztraminer. American Journal of Enology and Smart R.E. and Robinson S.M., 1991. Sunlight into
Viticulture, 40, 121-129. wine. Winetitles: Adelaide, Australia.
Reynolds A.G., Edwards C.G., Wardle D.A. and
Smart R.E. and Smith S., 1988. Canopy management:
Dever M., 1994a. Shoot density affects ‘Riesling’
grapevines II. Wine composition and sensory identifying the problems and practical solutions. New
response. Journal of the American Society for Zealand Society for Viticulture and Oenology, 109-
Horticultural Science, 119, 881–892. doi:10.21273/ 115.
JASHS.119.5.881 Smart R.E., 1986. Influence of light on composition
Reynolds A.G., Edwards C.G., Wardle D.A., and quality of grapes. In Symposium on Grapevine
Webster D.R. and Dever M., 1994b. Shoot density Canopy and Vigor Management, XXII IHC 206, 37-
affects ‘Riesling’ grapevines I. Vine performance. 48.
Journal of the American Society for Horticultural Smart R.E., 1988. Shoot spacing and canopy light
Science, 119, 874–880. doi:10.21273/JASHS. microclimate. American Journal of Enology and
119.5.874
Viticulture, 39, 325-333.
Reynolds A.G., Molek T. and De Savigny C., 2005.
Smart R.E., Robinson J.B., Due G.R. and Brien C.J.,
Timing of shoot thinning in Vitis vinifera: Impacts on
yield and fruit composition variables. American 1985. Canopy microclimate modification for the
Journal of Enology and Viticulture, 56, 343-356. cultivar Shiraz 1. Definition of canopy microclimate.
Vitis, 24, 17-31.
Reynolds A.G., Wardle D.A. and Dever M., 1994c.
Shoot density effects on Riesling grapevines: Sun Q., Sacks G.L., Lerch S.D. and Heuvel J.E.V.,
Interactions with cordon age. American Journal of 2012. Impact of shoot and cluster thinning on yield,
Enology and Viticulture, 45, 435-443. fruit composition, and wine quality of Corot noir.
Ristic R., Downey M.O., Iland P.G., Bindon K., American Journal of Enology and Viticulture, 63, 49-
Francis I.L., Herderich M. and Robinson S.P., 2007. 56. doi:10.5344/ajev.2011.11029
Exclusion of sunlight from Shiraz grapes alters wine Wang X., De Bei R., Fuentes S. and Collins C., 2019.
colour, tannin and sensory properties. Australian Influence of canopy management practices on canopy
Journal of Grape and Wine Research, 13, 53-65. architecture and reproductive performance of
doi:10.1111/j.1755-0238.2007.tb00235.x Semillon and Shiraz grapevines in a hot climate.
Silvestroni O., Lanari V., Lattanzi T., Palliotti A. and American Journal of Enology and Viticulture, 70,
Sabbatini P., 2016. Impact of crop control strategies 360-372. doi:10.5344/ajev.2019.19007
484 © 2020 International Viticulture and Enology Society - IVES OENO One 2020, 54, 3, 469-484You can also read