Impact of spectral effects on photovoltaic energy production: A case study in the United States
←
→
Page content transcription
If your browser does not render page correctly, please read the page content below
Impact of spectral effects on photovoltaic
                                                  energy production: A case study in the United States
                                                  José M. Ripalda1,* , Daniel Chemisana2 , José M. Llorens1 , and Iván Garcı́a3

                                                  1 Instituto   de Micro y Nanotecnologı́a - CSIC, Isaac Newton, 8, E-28760, Tres Cantos, Madrid, Spain
                                                  * j.ripalda@csic.es

                                                  2 Applied     Physics Section of the Environmental Sci. Dept, Universitat de Lleida, Jaume II 69, 25001, Lleida, Spain
                                                  3 Instituto   de Energı́a Solar, Universidad Politécnica de Madrid, Avda. Complutense 30, 28040, Madrid, Spain

                                                   The time averaged efficiency of photovoltaic modules in the field is generally lower than the efficiency under stan-
                                                   dard testing conditions due to the combined effects of temperature and spectral variability, affecting the bankability
arXiv:2003.08871v2 [physics.app-ph] 30 Mar 2020

                                                   of power plant projects. We report spectral correction factors ranging from -2% to 1.3% of the produced energy for
                                                   silicon modules depending on location and collector geometry. We find that spectral effects favor trackers if silicon
                                                   modules are used, but favor a fixed tilt instead if perovskites or CdTe are used. In high irradiance locations, the en-
                                                   ergy yield advantage of silicon based trackers is underestimated by 0.4% if spectral sensitivity effects are neglected.
                                                   As the photovoltaic market grows to a multi-terawatt size, these seemingly small effects are expected to have an
                                                   economic impact equivalent to tens of billions of dollars in the next few decades, far out-weighting the cost of the
                                                   required research effort.

                                                     Due to the rapid cost reduction of photovoltaics (PV), re-                   In the first section of this work we are concerned with
                                                  cent forecasts are predicting that several tens of terawatts                 the implications of thermal and spectral variability for main-
                                                  of PV capacity will be deployed before 20501 . This rep-                     stream PV technology based on fixed tilt silicon modules.
                                                  resents an investment of several tens of trillions of dollars.               Thin film technologies such as CdTe and perovskites are also
                                                  As a consequence there is a large economic drive to opti-                    discussed. We then examine the implications of our study
                                                  mize the choice of location and technology for new PV sys-                   for the energy production of tracking systems. In the next
                                                  tems. Key aspects to take into account are the geograph-                     section we also consider multijunctions under global spectra.
                                                  ical and temporal variations of the spectral irradiance, and                 We then quantify the band gap adjustments required at spe-
                                                  meteorological parameters such as ambient temperature and                    cific locations to maximize the produced energy. To conclude
                                                  wind speed. Changes in the spectral irradiance are mostly                    we discuss the uncertainty in our results as a function of the
                                                  driven by the position of the sun and atmospheric condi-                     number of spectra used per location.
                                                  tions2–7 , but also by the orientation of solar panels as de-                   A flow chart summarizing our methodology is shown in
                                                  fined by the plane of array (POA). Accurately accounting for                 Fig. 1. We have included in our calculations the most rel-
                                                  these effects requires detailed radiative transfer models in-                evant effects as detailed in the methods section and Ref.11 .
                                                  cluding multiple reflection, scattering, and absorption events               We use the Sandia PV Array Performance Model for solar
                                                  in the atmosphere including both cloudy and clear-sky con-                   cell temperatures using ambient temperature and wind speed
                                                  ditions8, 9 . Data from these radiative transfer models has only             data22 . In single junctions, the most pronounced effect of
                                                  recently become widely available through the National So-                    temperature is a reduction in the voltage due to a higher re-
                                                  lar Radiation DataBase (NSRDB) web service8–10 . Here we                     combination current23, 24 . An appropriate model for solar cell
                                                  use these spectral and meteorological datasets to obtain the                 temperatures is also required because of the Varshni shift of
                                                  PV efficiency and energy production as a function of loca-                   the bandgaps with temperature.
                                                  tion for a wide range of PV technologies. Previous studies
                                                  have found that spectral variability has a significant effect on
                                                  the energy production, but have not compared tracking with
                                                  fixed tilt collection geometries11–21 . Here we include the ef-
                                                  fects of wind, ambient temperature, and irradiance on solar
                                                  cell temperatures in addition to spectral variability includ-
                                                  ing the effects of clouds. Our results exemplify that consid-
                                                  eration of the combined effects of spectral and temperature
                                                  variations will allow to fine tune the optimal location, mod-
                                                  ule technology, and collection geometry for each PV project,
                                                  with an economic benefit far out-weighting the cost of the re-
                                                  quired research effort. Most importantly, we provide spectral
                                                  correction factors, for each location and PV technology, that                Figure 1 Flow chart of the methodology to calculate the yearly
                                                  can be used to improve the accuracy of conventional energy                   energy yield and time averaged PV efficiency as a function of
                                                  production forecasts.                                                        location. Further details are given in the Methods section.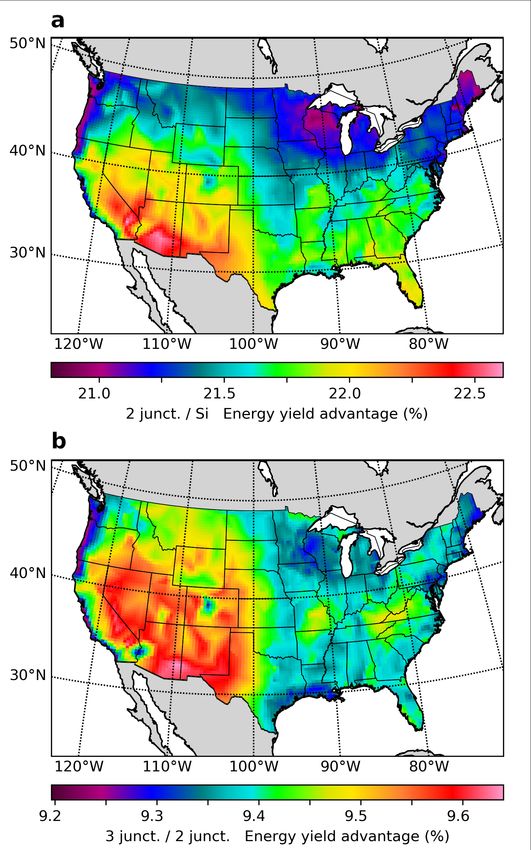
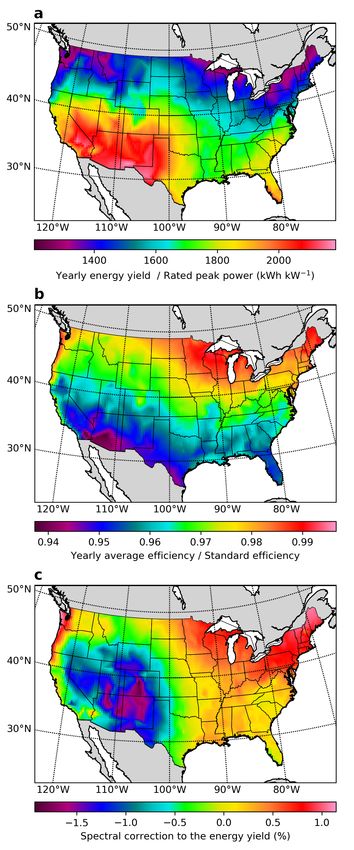
Silicon
A typical PV system uses silicon modules fixed at a tilt angle
roughly matching the latitude and oriented towards the south
(or to the north if in the southern hemisphere). We adjust the
tilt angle for each location as a function of latitude accord-
ing to the prescription given by Jacobson and Jadhav25 . We
have calculated the maximum realistically achievable yearly
energy production (Fig. 2a) and yearly averaged energy effi-
ciency (Fig. 2b) for such systems when considering spectral
and temperature variability effects. The trends in the energy
production map are opposite to those in the efficiency map
due to the effect of higher solar cell temperatures in high irra-
diance locations. The lower efficiency in the south is mostly
due to the effect of temperature on the recombination cur-
rent, and consequently on the voltage, but high temperatures
also further shift the silicon band gap away from the opti-
mal value for a single junction (1.35 eV according to Ref.11 ).
Temperature effects slightly reduce the economic advantage
of deployment in high irradiance locations.
    To quantify spectral sensitivity effects we compute spec-
tral correction factors fs as the ratio of the yearly energy
yield Ey obtained with the NSRDB POA spectral irradiance
s(λ) and the yearly energy yield obtained assuming the stan-
dard ASTM G-173-03 spectrum      R ∞s0 (λ) scaled to match the
NSRDB POA irradiance G = 0 s(λ) dλ as
                              Ey (s(λ))
                   fs =                     ,                 (1)
                          Ey (s0 (λ) G/G0 )
where G0 is the integrated irradiance of the standard spec-
trum. To clearly separate spectral effects, the spectra are the
only difference between these two energy yield calculations.
Because the standard solar spectrum is often assumed to fore-
cast the expected energy yield of new PV power plants, these
spectral correction factors can be used to correct such fore-
casts. But these spectral correction factors can also be used to
illustrate the relative importance of spectral sensitivity effects
for each location and type of PV system. We present in Fig.
2c the resulting spectral correction percentage as (fs − 1).
Neglecting spectral effects thus leads to overestimating the
energy yield in some of the locations with the highest produc-
tion potential by nearly 2% (high altitude locations in Col-
orado and New Mexico), while slightly underestimating it in
others (the Sonoran Desert at the border between California
and Arizona).
   Spectral variability effects in single junctions are due to
the absorption threshold of the semiconductor. These effects
show a clear correlation between topographic altitude and ef-
ficiency losses in Fig. 2c. By comparing the spectra at low          Figure 2 Silicon single junctions at a fixed optimal tilt angle.
altitude locations with the spectra from locations at high alti-     a, Yearly energy production relative to the rated peak power
tude, we observe that the efficiency is highest at low altitude      of the PV system. b, Yearly averaged efficiency relative to
due to higher infrared losses caused mostly by the water con-        the standard efficiency. c, Spectral correction factors to be
                                                                     used when calculating the efficiency or the energy production
tent of the atmosphere. Because these losses occur at ener-
                                                                     assuming the standard spectrum.
gies below the band gap, they have the effect of an apparent
efficiency increase that is not necessarily accompanied by an
energy yield increase.

                                                                                                                                2/10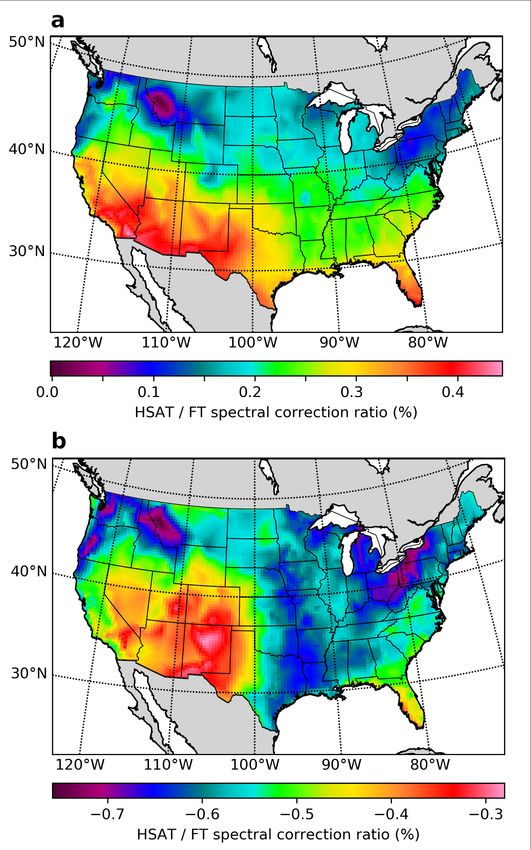
CdTe and perovskites                                               ratio (this will not be the case when studying the effect of
                                                                   tracking). We have assumed here the bandgap of the current
As a consequence of the rapid drop in price of silicon based
                                                                   record solar cell (1.5 eV)26 . The relevant result in Fig. 4 is the
PV modules with higher efficiencies, the market share of thin
                                                                   relative difference between locations, and not the absolute re-
film PV technologies based on CdTe and CuGaInSe2 has de-
                                                                   sult at each location, as the actual performance of perovskite
clined slightly in recent years, but thin film technologies are
                                                                   modules in the field is still largely unknown and we have not
likely to maintain a foothold in certain markets, applications
                                                                   included time dependent degradation effects27 .
or geographical regions. Here we center our attention on the
case of CdTe, as its higher band gap (1.45 eV for CdTe vs
1.12 eV for silicon) might make it advantageous in locations
with lower infrared irradiance or higher temperatures. The
spectral correction factors in Fig. 3 do indeed show a wide
geographical variation range.

                                                                   Figure 4 Relative energy yield difference between perovskite
                                                                   single junctions and silicon.

                                                                   Tracking
Figure 3 CdTe yearly spectral correction factor to the energy      Among all the utility scale PV systems installed in the US in
yield and the efficiency.                                          2016, 80% were tracking systems28 . The most common type
                                                                   of PV tracking is currently horizontal single axis (HSAT)
   In comparison with silicon, the performance of CdTe mod-        tracking. We present in Fig. 5 the ratio of the yearly energy
ules is more dependent on spectral effects due to its higher       production of silicon based HSAT systems relative to that of
bandgap. As recently suggested by Peters et al.20 , this is        fixed tilt systems.
related to infrared losses in the atmosphere caused by wa-            Using tracking to increase the average irradiance on the
ter, decreasing the POA irradiance without decreasing the          POA comes at the cost of increased solar cell temperatures.
energy yield as these changes occur at energies below the          But thermal effects are only slightly detrimental to the effi-
CdTe bandgap. As a consequence the efficiency of CdTe and          ciency of HSAT systems because their higher yearly energy
perovskite single junctions increases with increasing precip-      production (Fig. 5) is mostly due to a more spread out energy
itable water in the atmosphere.                                    production along the course of each day, and not to signifi-
   Due to their similar bandgap, the geographical distribu-        cantly higher peak POA irradiances. Furthermore, we find
tions of the energy yield, the efficiency, and the spectral cor-   that the spectral correction factors for silicon based tracking
rection factor, are very nearly the same for CdTe and per-         systems systems are more favorable that those of fixed tilt
ovskites, but with lower non-radiative recombination losses        systems. The ratio of spectral correction factors for HSAT
favoring perovskites over CdTe as we have optimistically as-       (fsHSAT ) and fixed tilt systems (fsFT ) is presented as a per-
sumed the performance parameters of record perovskite so-          centage as (fsHSAT /fsFT − 1) in Fig. 6. For silicon systems
lar cells before degradation26 . Further details are given in      (Fig. 6a), tracking is found to be favoured by spectral effects
the methods section. To compare the yearly energy yield of         in all of the locations that we have studied, and comparing
perovskite modules EyP with the energy yield of silicon EySi       Fig. 2a with Fig. 6a reveals that the spectral correction ratio
in a fixed optimal tilt geometry, we plot in Fig. 4 the rel-       is most favourable for tracking systems in those areas with
ative energy yield difference between perovskites and sili-        the highest yearly energy production. Spectral effects further
con as EyP /EySi − 1. The POA irradiance is the same in both       increase the energy yield advantage of silicon based track-
cases because the collection geometry is the same, and con-        ers because trackers collect more sunlight during sunrise and
sequently the efficiency ratio is the same as the energy yield     sunset, and during these times the spectrum peaks at lower

                                                                                                                                 3/10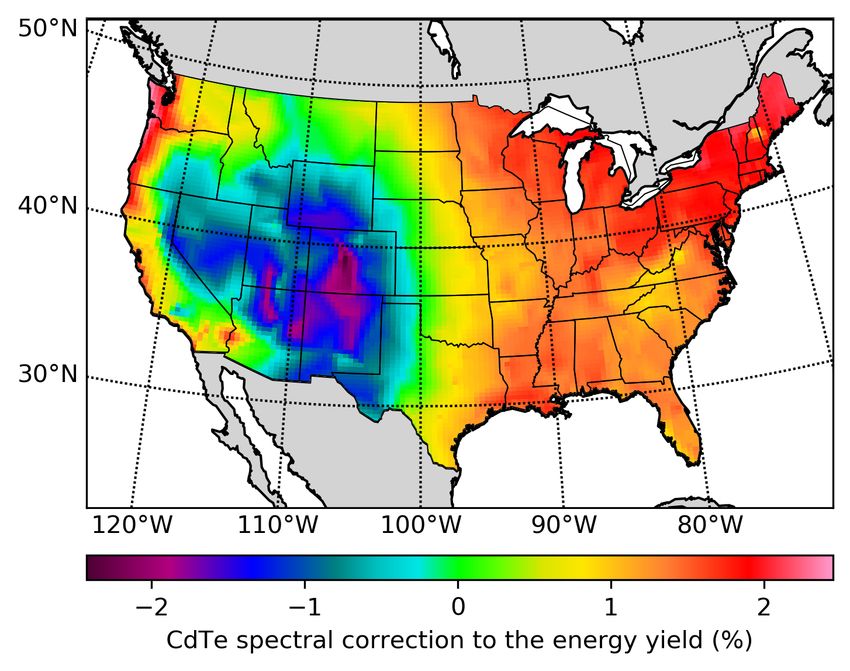
Figure 5 Yearly energy yield improvement factor obtained by
mounting silicon PV modules on horizontal single axis track-
ers rather than at a fixed tilt angle.

energies due to the higher air mass. Although this increases
losses due to photons with energy lower than the band gap,
the effect that prevails is a reduction in carrier thermaliza-
tion losses, as the band gap of silicon (1.12 eV) is smaller
than the optimal band gap for maximum yearly energy pro-
duction (1.35 eV)11 . Conversely, if perovskites or other high
band gap single junctions are used, spectral effects favor a
fixed tilt geometry, as shown in Fig. 6b. Because the POA
irradiance of tracking systems is higher than the POA irradi-
ance of fixed tilt systems, the energy yield is always higher
for trackers, but this advantage is reduced in the case of per-
ovskite absorbers due to spectral effects. The capital cost of    Figure 6 Ratio of spectral correction factors for tracking
utility scale PV power plants is 1.03 $/W for fixed tilt and      (HSAT) and fixed tilt (FT) systems. a, Silicon. b, Perovskite.
1.11 $/W for tracker systems28 . Because the cost difference
is only 7.76%, spectral effects make the return on investment
for silicon based trackers 5.8% more favorable.                   and modules only represent about 10% of the total cost28 ,
                                                                  allowing for multijunction module costs three times higher
                                                                  than current module costs. This target might be compat-
Multijunctions                                                    ible with a recent cost reduction road map for III-V mul-
An often raised concern about multijunction technology is         tijunctions published by NREL29 . Alternatively, multijunc-
its sensitivity to spectral variations. We present in Fig.7a      tions based on perovskites have recently surpassed the effi-
the energy yield ratio of an optimal series connected double      ciency of silicon single junctions30 , and reported degradation
junction relative to a silicon single junction under global ir-   rates are also improving rapidly31, 32 .
radiance with horizontal single axis tracking. In this case the      The areas most favourable for multijunctions in Fig.7a
POA irradiance is the same for both systems, and thus the         have a large overlap with the regions most favourable for
energy yield ratio is the same as the yearly average efficiency   tracking in Fig. 6b. This reinforces a synergy between these
ratio. The band gaps of the dual junction here discussed are      two technologies given by the fact that the revenue gener-
those found as optimal in our previous work, 1.126 eV and         ated by a photovoltaic system results from the product of a
1.687 eV for the bottom and top junctions respectively11 .        number of factors such as solar cell efficiency, inverter effi-
   We find that double junctions are most advantageous in         ciency, cell interconnection efficiency, POA irradiance, and
high irradiance locations due to a lower sensitivity to high      transmission of antireflective coatings and encapsulating ma-
temperatures. In the south, a 22% yearly energy yield advan-      terials. An increase in any of these factors makes it more
tage might provide a market entrance opportunity for dual         profitable to invest in increasing any of the other factors.
junction modules, especially in the residential market, where        The technical complexity and cost of multijunctions has a
area constraints increase the value of high efficiency systems,   super-linear trend with the number of junctions, whereas the

                                                                                                                            4/10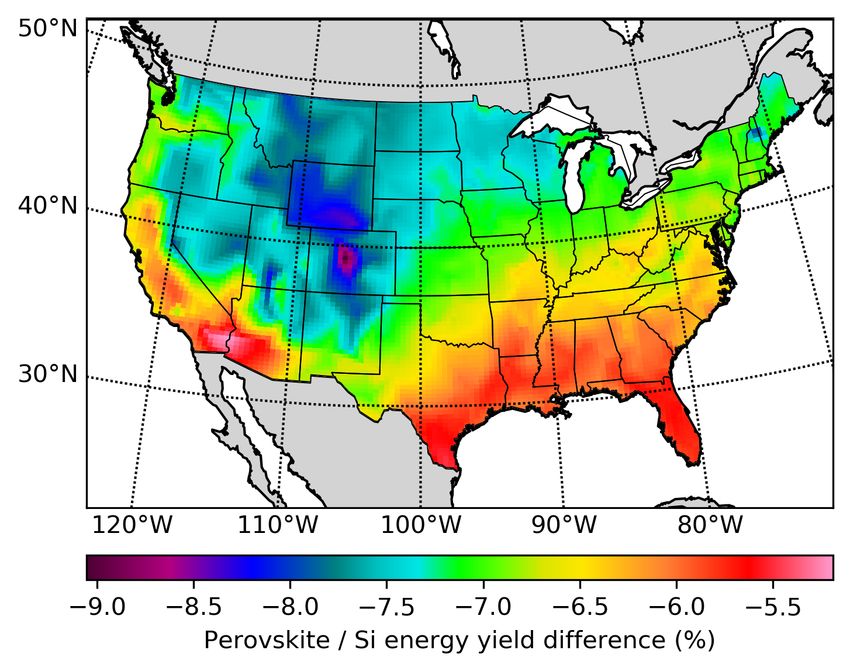
connected double and triple junction (not shown) are more
                                                                     adverse than those of the silicon single junction. They follow
                                                                     a geographical pattern closely matching that in Fig.2c, sug-
                                                                     gesting that the spectral sensitivity effects are mostly given
                                                                     by the absorption threshold of the silicon bottom junction.
                                                                     The spectral corrections range from -3.4% to -1.1% for the
                                                                     double junction and -4.4% to -2.1% for the triple junction.
                                                                     If the photocurrent from the silicon bottom junction is col-
                                                                     lected separately using a three or four terminal configuration
                                                                     (neglecting cell interconnection losses), the spectral correc-
                                                                     tions range from -2.2% to 1.5% for the double junction and
                                                                     -4.0% to -0.7% for the triple junction. So a multi-terminal
                                                                     configuration is most beneficial for the double junction. The
                                                                     energy yield of multi-terminal silicon based tandems has also
                                                                     been recently studied by Schulte-Huxel et al.33 , using tech-
                                                                     nologically relevant but not optimal band gaps (GaAs and
                                                                     GaInP), and Essig et al. recently reported record efficiencies
                                                                     with silicon based tandems using these materials29 . Using the
                                                                     corresponding band gaps (1.42 eV for GaAs and 1.85 eV for
                                                                     GaInP) with our model, we reproduce the results reported by
                                                                     Schulte-Huxel et al.33 , obtaining larger gains for the multi-
                                                                     terminal configuration than when using optimal band gaps.
                                                                     Thus the multi-terminal configuration is of most interest
                                                                     when the optimal band gaps for the series connected config-
                                                                     uration cannot be used due to technological constraints. This
                                                                     conclusion is also supported by the recent work by Mathews
                                                                     et al.34 .
                                                                        As an example of extreme spectral sensitivity, we have
                                                                     considered the case of an optimal series connected 6 junction
                                                                     device under global spectra. The band gaps of the 6 junction
                                                                     architecture here discussed are those of the current record for
                                                                     a solar cell under the global spectrum30, 35 . The energy yield
Figure 7 Energy yield ratios as a function of the number of          advantage over silicon single junctions (Ey6j /EySi − 1) ranges
junctions. The POA irradiance is here the same in all cases,         from 50.8% in the Rocky Mountains to 38.7% in New Eng-
so the efficiency ratio is the same as the energy yield ratio. a),   land. The spectral correction factor for the 6 junction device
Ratio of the energy yield obtained with an optimal double junc-      is shown in Fig. 8. The geographical pattern is almost the
tion to the energy yield of silicon under global irradiance with     opposite of all the previous cases, with high altitude loca-
horizontal single axis tracking. b) Ratio of the energy yield ob-
                                                                     tions being the least adversely affected by spectral sensitivity
tained with an optimal triple junction to the energy yield of an
                                                                     effects. This different pattern here suggests that the spectral
optimal double junction under global irradiance with horizontal
single axis tracking.                                                sensitivity of this device is of a fundamentally different type
                                                                     than in the previous cases. While silicon and silicon based
                                                                     multijunctions have a spectral sensitivity mostly determined
                                                                     by the absorption threshold of silicon, the spectral sensitiv-
efficiency has a sub-linear increase with the number of junc-
                                                                     ity of this 6 junction device is mostly given by the current
tions. So it remains unclear what would be the number of
                                                                     matching constraint. High altitude reduces losses caused by
junctions that maximizes the return on investment, partly due
                                                                     the atmosphere, reducing spectral variability and current mis-
to location dependent effects. The relative improvement in
                                                                     match effects in the 6 junction case.
the yearly energy production obtained by replacing an opti-
mal double junction with a triple junction is shown in Fig.7b.
In both cases the bottom junction is chosen to be silicon,           Fine tuning for specific locations
as its band gap is nearly optimal, and it has a high perfor-         As recently discussed by Parent et al., the energy yield of
mance/cost ratio. The middle and top junction band gaps for          multijunctions can be increased by optimizing the band gaps
the triple junction are those found as optimal for a silicon         using local spectra and meteorological conditions36 . We have
based series connected triple junction in our previous work,         re-optimized the band gaps of silicon based triple junctions
1.48, 1.94 eV, respectively11 .                                      at a few representative locations. In the data presented here
   As expected, the spectral correction factors for the series       (Table 1) the bottom junction band gap is fixed as we assume

                                                                                                                                5/10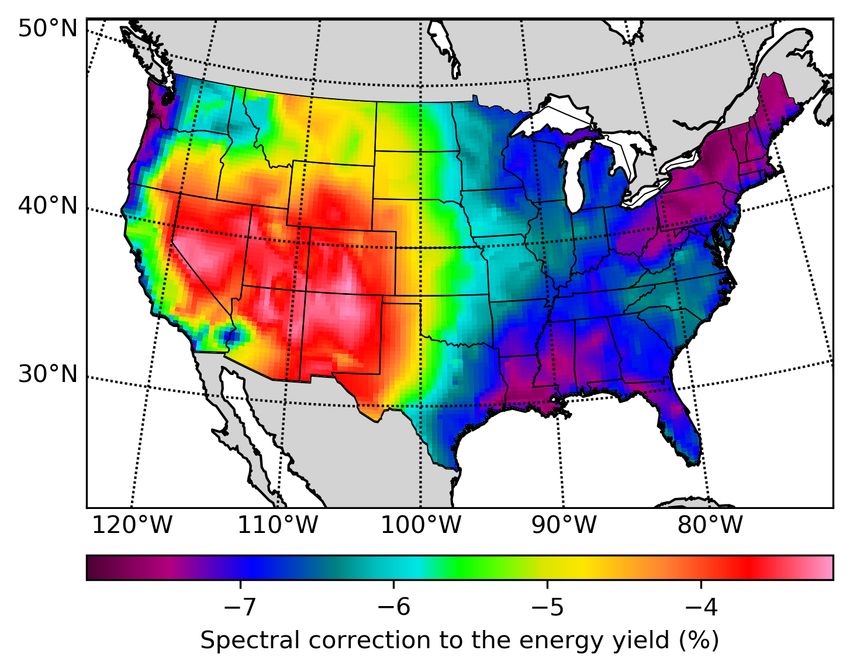
comprises 16 million spectra, each with 2002 wavelengths
                                                                  and associated meteorological data. The number of required
                                                                  spectra can be reduced using statistical techniques such as
                                                                  binning13 , and machine learning clustering11 . Here we clus-
                                                                  ter the spectra according not only to their spectral content as
                                                                  in our previous work11 , but also according to other correlated
                                                                  meteorological data such as wind speed and ambient temper-
                                                                  ature, as these also have an effect on PV efficiency.
                                                                     In the previous sections we have used 18 clustered spectra
                                                                  per location, as we have previously determined that this leads
                                                                  to an uncertainty in the results typically smaller than 0.2%
                                                                  while still reducing the computational cost by several orders
                                                                  of magnitude11 .
                                                                     In this section we study how the quality of the obtained
                                                                  results improves as the number of spectra is increased, using
                                                                  as a reference the results obtained with the whole data-set.
Figure 8 Spectral correction factor for the yearly energy pro-    In Fig. 9 we show the efficiency error statistics as a function
duction of a 6 junction solar cell with the band gaps of the      of the number of spectra for triple junction modules on hori-
current record device under global irradiance35 .                 zontal single axis trackers. As shown in Fig. 9, there is little
                                                                  benefit obtained by increasing the number of proxy spectra
                                                                  beyond 20, and the uncertainty in energy yield forecasts is
a silicon based tandem. If this constrain is relaxed, we find     likely to be dominated by other factors such as the uncertain-
the required bottom junction band gap adjustments to reach a      ties on the spectrally integrated irradiance, module degrada-
local efficiency maximum are typically small, while top junc-     tion, soiling rates, and other loss mechanisms at the module
tions are the ones that require larger adjustments. This is ex-   and system level that are out of the scope of this work.
pected because, regardless of geographical location, the effi-
ciency maxima as a function of the bottom junction band gap
are mostly given by the atmospheric absorption band thresh-
olds, as discussed by McMahon et al.37 . Higher top junction
band gaps are favoured in hot areas as this leads to a reduc-
tion of recombination voltage losses, but spectral effects lead
to exceptions to this rule, as in the case of the north pacific
coast, where high band gaps are favoured due to spectral ef-
fects. The obtained efficiency improvement is typically of
about 0.5%.

Table 1 Fine tuning of band gaps at specific locations for se-
ries constrained silicon based triple junctions. The reference
efficiency is obtained with middle and top junction band gaps
of 1.48 and 1.94 eV, respectively.

                 Mid. gap Top gap Ref. Eff.        Eff.           Figure 9 Convergence of the yearly averaged efficiency as
                    eV      eV       %              %             a function of the number of clustered spectra. This example
 Leadville, CO    1.490    1.975   34.95          35.37           corresponds to a set of 140 triple junctions with random but
  Denver, CO      1.494    1.978   34.81          35.23           nearly optimal band gaps (efficiency within 2% of the maxi-
   Mojave, CA     1.499    1.981   34.70          35.26           mum) on a horizontal single axis tracker at Elko, Nevada.
   Tucson, AZ     1.500    1.986   34.33          34.95
  Astoria, OR     1.504    1.987   35.40          36.16

                                                                  Discussion
                                                                  The contiguous United States spans a wide range of latitudes
Uncertainty vs. number of spectra                                 and atmospheric conditions. As a consequence, the yearly
Our results suggest that forecasting the yearly energy pro-       averaged photovoltaic efficiency of silicon modules can vary
duction of PV systems requires location specific solar spec-      with location by up to 1.4% absolute efficiency. Spectral
tra. Yearly spectral sets with thousands of spectra per year      sensitivity effects account for about half of the geographi-
and location are available from the National Solar Radia-         cal variability of efficiencies, with spectral correction factors
tion Database (NSRDB)8–10 . The dataset used in this work         ranging from -2.0% to 1.1% in terms of the energy yield,

                                                                                                                              6/10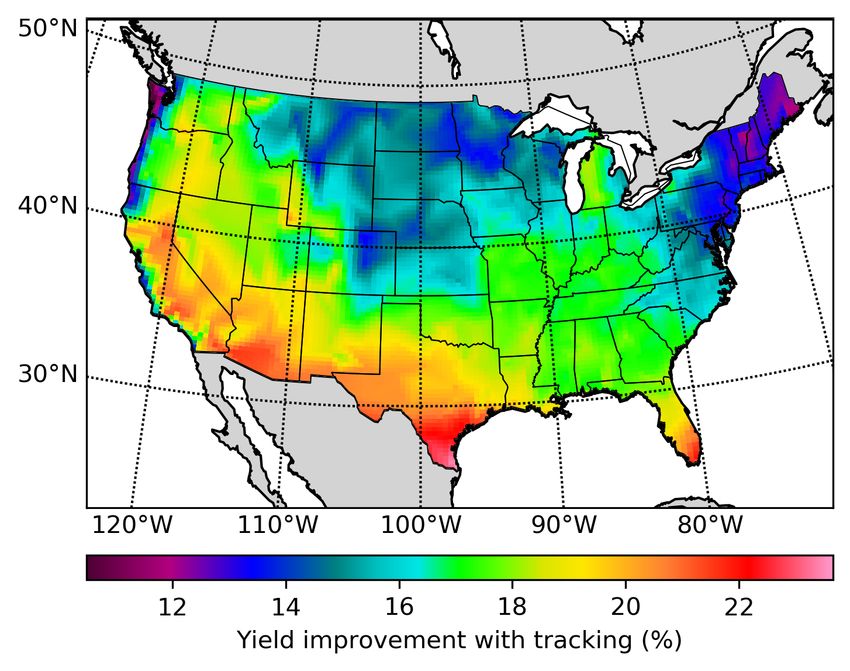
or -0.5% to 0.3% in terms of absolute efficiency. We find                 chine learning clustering of the initial data set11 . The band gaps
that thermal effects predominate over spectral sensitivity, and           were optimized for maximum yearly energy yield as described in
slightly reduce the economic advantage of high irradiance                 Ref.11 .
locations. While the former are mostly determined by lati-                   Temperature model. We obtain solar cell temperatures from the
tude and irradiance, the latter are mostly determined by to-              ambient temperature, the irradiance, and the wind speed using the
pographical altitude and atmospheric phenomena. Spectral                  PVLIB python open source library implementation of the empiri-
sensitivity effects are found to favour silicon horizontal sin-           cally fitted Sandia photovoltaic array performance model using the
gle axis trackers over fixed tilt systems by up to 0.45% of the           default parameters for a polymer-back open rack array41 . To include
                                                                          the effect of efficiency on solar cell temperatures, the irradiance val-
energy yield in high irradiance locations at lower latitudes,
                                                                          ues used as input in the Sandia temperature model are modified by
but a fixed tilt geometry is favored instead for perovskites              a thermal correction factor that is a function of the efficiency, as the
and other high band gap absorbers such as CdTe. The energy                efficiency of the modules used to fit the Sandia temperature model
yield loss caused by spectral sensitivity in multijunctions is            was rather low (η0 = 16.5%), and the power carried away as electric-
found to be roughly proportional to the number of junctions.              ity does not contribute to raise the solar cell temperature. This factor
If the optimal band gaps are used, this loss is not significantly         is given by (1 − R − η) / (1 − R − η0 ), where η is the efficiency,
mitigated by using a multi-terminal configuration for current             and R is the reflectivity. The efficiency values used to calculate the
extraction. Nevertheless, because the choice of band gaps is              thermal correction factor are those in Table 1 of Ref.11 to avoid the
often constrained, multi-terminal configurations greatly en-              need for self consistent iteration, as the temperature would depend
hance the flexibility of multijunction design. The data here              on the efficiency and vice versa. The value assumed for R is arbi-
presented clearly shows that location specific solar spectra              trarily chosen to be 0.05, but the sensitivity of the results to both R
                                                                          or η is small (doubling the value assumed for R or increasing the ef-
are required for accurate predictions of the energy yield, but
                                                                          ficiency by 5% reduces the resulting temperature by 0.5◦ C and this
rather than sets of thousands of spectra for each location cov-           increases the efficiency of a silicon single junction by 0.03%).
ering a whole year, it suffices to use a few characteristic spec-
                                                                             Caveats and shortcomings. Although out of the scope of the
tra for each location. A possible future line of research, in-
                                                                          present work, in practice there are other important effects on the
spired by the recent work by Warmann and Atwater21 , is to                energy production and return on investment of PV installations,
identify a set of geographical, atmospheric and meteorologi-              such as the higher degradation rate with increased module tem-
cal parameters that correctly predicts the yearly energy yield            peratures43, 44 , and the geographical and seasonal variations of soil-
in all locations within an acceptable uncertainty margin. But             ing rates45–47 , as well as other loss mechanisms at the module and
the most pressing need at the moment seems to be to decrease              system level. When PV module temperatures are above a certain
the uncertainty margin in the spectral irradiance data used as            threshold, it becomes economically advantageous to turn trackers
input in models such as the one here discussed. Such ad-                  away from the sun, reducing the risk of damage but also the energy
vances should lead to significantly reduced uncertainty in PV             production. Similarly, the frequency of cleaning is also determined
production forecasts, and consequently lower risk and finan-              by a balance between the energy yield and operating costs. Both
                                                                          effects are specially adverse in arid regions with high temperatures
cial cost for PV projects.
                                                                          and infrequent rain. We reduce the reported specific energy yields
                                                                          by 3% due to shadow losses, 2% due to inverter clipping and in-
Methods                                                                   verter efficiency losses, 2% due to system degradation and failures,
Solar cell model and proxy spectra. We have used a modified               2% due to soiling, and 1% due to other effects such as DC and AC
detailed balance method with a set of proxy spectra obtained from         wire losses and mismatch losses, among others. We do not attempt
clustering of yearly spectral sets as described in Ref.11 . Building on   to do a location dependent bottom-up model of system level losses,
state of the art understanding of fundamental losses38 , our model is     as these effects have little correlation with the spectral effects that
based on previous work by Geisz et al. and García et al..13, 39 . All     are the main subject of this work.
the parameters in the model are the same as in our previous work             Ground based observations of the solar spectra are available from
with the exception of the external radiative efficiency for CdTe,         a limited number of locations, covering a limited time span. There-
where we optimistically assumed 0.01% rather than the default             fore a consistent large data-set covering large regions and time-
value of 1%. A parameter sensitivity analysis including all relevant      spans can only be obtained from modelled data based on satellite
parameters in our model can be found in Ref.40 . The global spectral      images, and later validated by comparison with spectra measured
irradiance data was downloaded from the National Solar Radiation          from the ground48 . The NREL-NSRDB spectra used in this work
Database (NSRDB) as derived from the FARMS-NIT model valid                have been derived from the FARMS-NIT model and validated in
for all sky conditions, including the effects of clouds8, 9 . The used    comparison with measured spectra from the NREL Solar Radiation
spectra and meteorological data are historical data from 2017. The        Research Laboratory in Ref.49 . These ground based measurements
spectral irradiance is modified by an angle of incidence modifier ac-     unavoidably have their own uncertainties and biases, and thus com-
counting for increased reflectance at grazing angles. We have used        plete agreement with physics based models cannot be expected. The
the physically based angle of incidence modifier implemented in the       FARMS-NIT data in comparison with surface based observations
PVLIB python open source library41, 42 .                                  have shown a percentage error in the 1.86 % to 2.28% range, while
   The initial data set includes 16 million spectra (8760 spectra for     the previous model from NREL (TMYSPEC) had percentage er-
913 locations and 2 different collection geometries). These are re-       rors ranging from -3.47% to -16.27%49 . Although this represents
duced to 18 characteristic spectra per location used as a proxy for       a large improvement over the previous state of the art, there is still
the whole yearly data-set. The proxy spectra are obtained by ma-          a clear need to reduce these uncertainties to improve the bankabil-

                                                                                                                                            7/10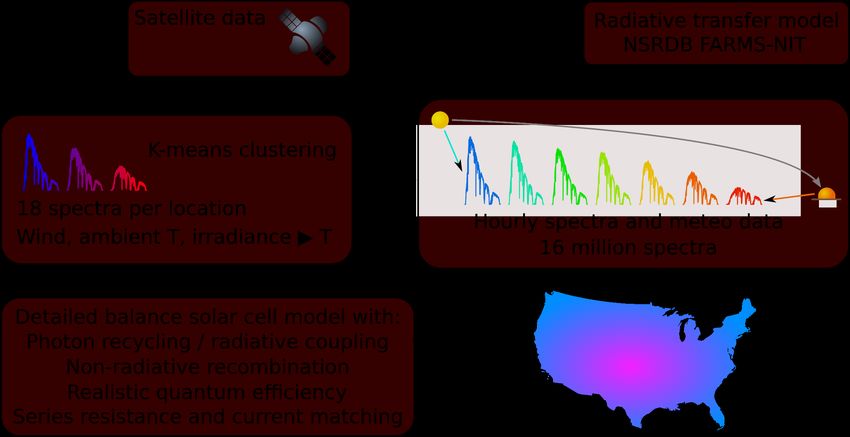
ity of PV systems. The potential economic return of such advances          4. Kurtz, S., Myers, D. & Olson, J. Projected performance of
clearly justifies the required research effort. In the mean time, the         three- and four-junction devices using GaAs and GaInP. In
qualitative trends here revealed illustrate phenomena that need to be         PVSC 26 Conference Record, 875–878 (IEEE, Anaheim, CA,
accounted for in order to improve photovoltaic energy production              USA, 1997). URL http://ieeexplore.ieee.org/
forecasts.                                                                    document/654226/.
   The spectral irradiance data for horizontal single axis tracker sys-    5. Chan, N. L. A., Brindley, H. E. & Ekins-Daukes, N. J.
tems provided by the NSRDB is obtained in the limit of low ground             Impact of individual atmospheric parameters on CPV sys-
cover ratios without back-tracking49 . Systems with high ground               tem power, energy yield and cost of energy:                  Im-
cover ratios can be expected to be less sensitive to the changes in           pact of individual atmospheric parameters on CPV sys-
the spectra during the early morning and late afternoon.                      tems.     Progress in Photovoltaics: Research and Applications
                                                                              22, 1080–1095 (2014). URL http://doi.wiley.com/
Data and code availability                                                    10.1002/pip.2376.
                                                                           6. Ekins-Daukes, N. & Kay, M. Brighten the dark skies.
The data and code required to reproduce the results here pre-
                                                                              Nature Energy 4, 633–634 (2019). URL http://www.
sented are available as open source at https://github.com/
                                                                              nature.com/articles/s41560-019-0440-0.
Ripalda/Tandems
                                                                           7. Sweerts, B. et al. Estimation of losses in solar energy produc-
                                                                              tion from air pollution in China since 1960 using surface radi-
Acknowledgments                                                               ation data. Nature Energy 4, 657–663 (2019). URL http://
We gratefully acknowledge the scientific and technical input from             www.nature.com/articles/s41560-019-0412-4.
Dr. J. Buencuerpo. This work would have not been possible                  8. Xie, Y. & Sengupta, M.              A fast all-sky radiation
without the data and computing resources made publicly avail-                 model for solar applications with narrowband irradi-
able by NREL as part of the NSRDB. Funding was provided by                    ances on tilted surfaces (FARMS-NIT): Part i. the clear-
the Spanish Government and the European Union through MCIU-                   sky model.      Solar Energy 174, 691–702 (2018).           URL
AEI-FEDER-UE (ENE2017-91092-EXP, RTI2018-096937-B-C22,                        https://linkinghub.elsevier.com/retrieve/
RYC-2017-21995) and Comunidad de Madrid (P2018/EMT-4308).                     pii/S0038092X18309502.
D. Chemisana thanks "Institució Catalana de Recerca i Estudis              9. Xie, Y., Sengupta, M. & Wang, C.                    A fast all-
Avançats (ICREA)" for the ICREA Acadèmia award. I.G. is funded                sky radiation model for solar applications with narrow-
by Ministerio de Economía y Competitividad through the Ramón y                band irradiances on tilted surfaces (FARMS-NIT): Part
Cajal program (RYC-2014-15621).                                               II. the cloudy-sky model.         Solar Energy 188, 799–812
                                                                              (2019). URL https://linkinghub.elsevier.com/
Author contributions                                                          retrieve/pii/S0038092X19306334.
                                                                          10. Sengupta, M. et al. The National Solar Radiation Data Base
J.M.R. wrote the initial version of the manuscript and python code.           (NSRDB). Renewable and Sustainable Energy Reviews 89,
D.C. designed an initial version of this study and provided much of           51–60 (2018).
the motivation for this work. J.M.L. contributed to the methodology
                                                                          11. Ripalda, J. M., Buencuerpo, J. & García, I. Solar cell designs by
and reviewed the python code. I.G. contributed to the methodol-
                                                                              maximizing energy production based on machine learning clus-
ogy (proxy spectra, physics of multijunction devices). All authors
                                                                              tering of spectral variations. Nature Communications 9, 5126
jointly discussed the results and contributed to the manuscript.
                                                                              (2018). URL http://www.nature.com/articles/
                                                                              s41467-018-07431-3.
Competing interests                                                       12. Vossier, A., Riverola, A., Chemisana, D., Dollet,
The authors declare no competing interests.                                   A. & Gueymard, C. A.                 Is conversion efficiency
                                                                              still relevant to qualify advanced multi-junction solar
                                                                              cells?: Is efficiency relevant with advanced MJ cells?
References                                                                    Progress in Photovoltaics: Research and Applications          25,
 1. Haegel, N. M. et al. Terawatt-scale photovoltaics: Trans-                 242–254 (2017).
    form global energy. Science 364, 836–838 (2019). URL                  13. Garcia, I. et al.         Spectral binning for energy pro-
    http://www.sciencemag.org/lookup/doi/10.                                  duction calculations and multijunction solar cell design.
    1126/science.aaw1845.                                                     Progress in Photovoltaics: Research and Applications 26, 48–
 2. Kurtz, S. R., Olson, J. & Faine, P. The difference between stan-          54 (2018).
    dard and average efficiencies of multijunction compared with          14. Dirnberger, D., Blackburn, G., Müller, B. & Reise, C. On the
    single-junction concentrator cells. Solar Cells 30, 501–513               impact of solar spectral irradiance on the yield of different pv
    (1991). URL https://linkinghub.elsevier.com/                              technologies. Solar Energy Materials and Solar Cells 132, 431
    retrieve/pii/037967879190081Y.                                            – 442 (2015). URL http://www.sciencedirect.com/
 3. Faine, P., Kurtz, S. R., Riordan, C. & Olson, J. The                      science/article/pii/S0927024814005169.
    influence of spectral solar irradiance variations on the              15. Fernández, E. F., Almonacid, F., Ruiz-Arias, J. & Soria-
    performance of selected single-junction and multijunc-                    Moya, A.        Analysis of the spectral variations on the
    tion solar cells. Solar Cells 31, 259–278 (1991). URL                     performance of high concentrator photovoltaic mod-
    https://linkinghub.elsevier.com/retrieve/                                 ules operating under different real climate conditions.
    pii/037967879190027M.                                                     Solar Energy Materials and Solar Cells 127, 179 – 187 (2014).

                                                                                                                                          8/10
URL http://www.sciencedirect.com/science/ 29. Essig, S. et al. Raising the one-sun conversion efficiency of
article/pii/S0927024814002347. III–V/Si solar cells to 32.8% for two junctions and 35.9% for
16. Huld, T. Pvmaps: Software tools and data for the esti- three junctions. Nature Energy 2, 17144 (2017).
mation of solar radiation and photovoltaic module perfor- 30. Green, M. A. et al. Solar cell efficiency tables (version 55).
mance over large geographical areas. Solar Energy 142, 171 – Progress in Photovoltaics: Research and Applications 28, 3–15
181 (2017). URL http://www.sciencedirect.com/ (2020). URL https://onlinelibrary.wiley.com/
science/article/pii/S0038092X16306089. doi/abs/10.1002/pip.3228.
17. Kinsey, G. S. Spectrum sensitivity, energy yield, and rev- 31. Hou, Y. et al. Efficient tandem solar cells with
enue prediction of pv modules. IEEE Journal of Photovoltaics solution-processed perovskite on textured crystalline
5, 258–262 (2015). silicon. Science 367, 1135–1140 (2020). URL
18. Huld, T. & Gracia-Amillo, A. Estimating PV Module Per- https://www.sciencemag.org/lookup/doi/
formance over Large Geographical Regions: The Role of Ir- 10.1126/science.aaz3691.
radiance, Air Temperature, Wind Speed and Solar Spectrum. 32. Xu, J. et al. Triple-halide wide–band gap perovskites with sup-
Energies 8, 5159–5181 (2015). URL http://www.mdpi. pressed phase segregation for efficient tandems. Science 367,
com/1996-1073/8/6/5159. 1097–1104 (2020). URL https://www.sciencemag.
org/lookup/doi/10.1126/science.aaz5074.
19. Lindsay, N., Libois, Q., Badosa, J., Migan-Dubois, A.
& Bourdin, V. Errors in PV power modelling due to 33. Schulte-Huxel, H., Silverman, T. J., Deceglie, M. G., Friedman,
the lack of spectral and angular details of solar irradi- D. J. & Tamboli, A. C. Energy yield analysis of multiterminal
ance inputs. Solar Energy 197, 266–278 (2020). URL si-based tandem solar cells. IEEE Journal of Photovoltaics 8,
https://linkinghub.elsevier.com/retrieve/ 1376–1383 (2018). URL https://ieeexplore.ieee.
pii/S0038092X19312563. org/document/8405753/.
20. Peters, I. M., Liu, H., Reindl, T. & Buonassisi, T. Global 34. Mathews, I., Lei, S. & Frizzell, R. Predicted annual en-
Prediction of Photovoltaic Field Performance Differences ergy yield of III-v/c-si tandem solar cells: modelling the ef-
Using Open-Source Satellite Data. Joule 2, 307–322 fect of changing spectrum on current-matching. Opt. Express
(2018). URL https://linkinghub.elsevier.com/ 28, 7829 (2020). URL https://www.osapublishing.
retrieve/pii/S2542435117301836. org/abstract.cfm?URI=oe-28-6-7829.
35. Geisz, J. F. et al. Building a six-junction inverted metamorphic
21. Warmann, E. C. & Atwater, H. A. Predicting Geo-
concentrator solar cell. IEEE Journal of Photovoltaics 8, 626–
graphic Energy Production for Tandem PV Designs Us-
632 (2018). URL https://ieeexplore.ieee.org/
ing a Compact Set of Spectra Correlated by Irradiance.
document/8231134/.
IEEE Journal of Photovoltaics 9, 1596–1601 (2019). URL
https://ieeexplore.ieee.org/document/ 36. Parent, L., Riverola, A., Chemisana, D., Dollet, A. & Vossier,
8827709/. A. Fine-tuning of multijunction solar cells: An in-depth evalu-
ation. IEEE Journal of Photovoltaics 1–7 (2019).
22. King, D., Boyson, W. & Kratochvill, J. Photovoltaic array per-
formance model. Tech. Rep., Sandia Report SAND2004-3535 37. McMahon, W. E., Friedman, D. J. & Geisz, J. F. Mul-
(2004). tijunction solar cell design revisited: disruption of cur-
rent matching by atmospheric absorption bands: Disrup-
23. Dupré, O., Vaillon, R. & Green, M. Physics tion of current matching by atmospheric absorption bands.
of the temperature coefficients of solar cells. Progress in Photovoltaics: Research and Applications (2017).
Solar Energy Materials and Solar Cells 140, 92–100
38. Hirst, L. C. & Ekins-Daukes, N. J. Fundamental losses in so-
(2015). URL https://linkinghub.elsevier.
lar cells. Progress in Photovoltaics: Research and Applications
com/retrieve/pii/S0927024815001403.
19, 286–293 (2011). URL http://doi.wiley.com/10.
24. Dupré, O., Vaillon, R. & Green, M. A. 1002/pip.1024.
Thermal Behavior of Photovoltaic Devices (Springer, 2017).
39. Geisz, J. F. et al. Generalized Optoelectronic
25. Jacobson, M. Z. & Jadhav, V. World estimates of PV optimal tilt Model of Series-Connected Multijunction Solar Cells.
angles and ratios of sunlight incident upon tilted and tracked PV IEEE Journal of Photovoltaics 5, 1827–1839 (2015).
panels relative to horizontal panels. Solar Energy 169, 55–66 40. Ripalda, J. M., Buencuerpo, J. & García, I. Depen-
(2018). URL https://linkinghub.elsevier.com/ dence of multijunction optimal gaps on spectral variabil-
retrieve/pii/S0038092X1830375X. ity and other environmental and device parameters. In
26. Jung, E. H. et al. Efficient, stable and scalable perovskite so- IEEE PVSC 46 Proceedings, Chicago (2019).
lar cells using poly(3-hexylthiophene). Nature 567, 511–515 41. F. Holmgren, W., W. Hansen, C. & A. Mikofski, M.
(2019). URL http://www.nature.com/articles/ pvlib python: a python package for modeling solar energy
s41586-019-1036-3. systems. Journal of Open Source Software 3, 884 (2018).
27. Tress, W. et al. Performance of perovskite solar cells under URL http://joss.theoj.org/papers/10.21105/
simulated temperature-illumination real-world operating con- joss.00884.
ditions. Nature Energy 4, 568–574 (2019). URL http:// 42. De Soto, W., Klein, S. & Beckman, W. Improve-
www.nature.com/articles/s41560-019-0400-8. ment and validation of a model for photovoltaic array
28. Fu, R., Feldman, D., Margolis, R., Woodhouse, M. & Ardani, performance. Solar Energy 80, 78–88 (2006). URL
K. U.S. solar photovoltaic system cost benchmark: Q1 2017. https://linkinghub.elsevier.com/retrieve/
Tech. Rep. NREL/TP-6A20-68925, NREL (2017). pii/S0038092X05002410.
9/1043. Ascencio-Vásquez, J., Kaaya, I., Brecl, K., Weiss, K.-A. &
Topič, M. Global climate data processing and mapping of
degradation mechanisms and degradation rates of PV mod-
ules. Energies 12, 4749 (2019). URL https://www.mdpi.
com/1996-1073/12/24/4749.
44. Vazquez, M. et al. Reliability of commercial triple
junction concentrator solar cells under real climatic con-
ditions and its influence on electricity cost: Reliabil-
ity of commercial triple junction concentrator solar cells.
Progress in Photovoltaics: Research and Applications 25, 905–
918 (2017).
45. García, M., Marroyo, L., Lorenzo, E. & Pérez, M. Soiling
and other optical losses in solar-tracking PV plants in navarra.
Progress in Photovoltaics: Research and Applications 19, 211–
217 (2011). URL http://doi.wiley.com/10.1002/
pip.1004.
46. Sarver, T., Al-Qaraghuli, A. & Kazmerski, L. L.
A comprehensive review of the impact of dust
on the use of solar energy: History, investiga-
tions, results, literature, and mitigation approaches.
Renewable and Sustainable Energy Reviews 22, 698–733
(2013). URL https://linkinghub.elsevier.com/
retrieve/pii/S136403211300021X.
47. Ilse, K. et al. Techno-economic assessment of soiling losses and
mitigation strategies for solar power generation. Joule 3, 2303–
2321 (2019). URL https://linkinghub.elsevier.
com/retrieve/pii/S2542435119304222.
48. Sengupta, M. et al. Best practices handbook for the collec-
tion and use of solar resource data for solar energy applications.
Tech. Rep. NREL/TP-5D00-63112, NREL (2015).
49. Xie, Y., Sengupta, M., Dooraghi, M. & Habte, A. Reducing
pv performance uncertainty by accurately quantifying the pv
resource. Tech. Rep. NREL/TP-5D00-73377, NREL (2019).
10/10You can also read


