The extent, characteristics and potential of solar powered irrigation systems in South Africa
←
→
Page content transcription
If your browser does not render page correctly, please read the page content below

Volume 32 Number 2
                                                                                                May 2021

The extent, characteristics and potential of solar powered
irrigation systems in South Africa

P. Piliso1        A.Senzanje1           , K. Dhavu2
1. University of KwaZulu-Natal, Pietermaritzburg, South Africa
2. Agricultural Research Council, Pretoria, South Africa

Abstract
South Africa has been identified as having a high potential for solar powered irrigation. However, there has
been a lag in the development of solar powered irrigation systems (SPIS) there, mainly due to the high invest-
ment cost associated with solar technology. South Africa has frequently implemented load shedding, which has
affected many farmers. The work reported in this paper sought to determine the extent of solar powered irri-
gation and characteristics of the system types in use. The extent of SPIS in South Africa was determined using a
questionnaire, and categorised in terms of farm size, SPIS configuration (storage of energy), type of irrigation,
and location of the system. These were established mainly from a literature search. The questionnaires were
administered on Survey Monkey®. The sample size of the study was 138 755 potential respondents. The number
that participated and completed the questionnaires included a total of 18 SPIS engineers, installers and de-
signers and 13 SPIS users (farmers). The main problem encountered with the distribution of the survey was
finding SPIS users to participate. Results from SPIS engineers, installers and designers showed that most SPIS
they implemented were in the Western Cape and the Eastern Cape, at 33% of the responses for both provinces.
The total area under SPIS was found to be 364 ha, while the area under irrigation is South Africa is 1 300 00
ha, indicating a high potential for SPIS development. Some details on the extent of SPIS in South Africa were
determined in this paper, but more SPIS users need to be identified to determine the details of their SPIS.

Keywords: solar panels, irrigation system integration, water use efficiency, load shedding

Highlights
   • 44% of the SPIS engineers, installers, and designers implemented SPIS for smallholder farming.
   • Drip and sprinkler irrigation are equally the most integrated with SPIS (38%).
   • The water source mostly used with SPIS is a borehole (61%).
   • 77% of the SPIS user respondents stated that they have poly-crystalline solar panels.

                                Journal of Energy in Southern Africa 32(2): 26–40
                          DOI: https://dx.doi.org/10.17159/2413-3051/2021/v32i2a9045
        Published by the University of Cape Town     ISSN: 2413-3051    https://journals.assaf.org.za/jesa
        This work is licensed under a Creative Commons Attribution-ShareAlike 4.0 International Licence
                            Sponsored by the Department of Science and Innovation
 Corresponding author: Tel.: +27 (0)76 621 4714; email: piwevp@gmail.com cell number

                                                         26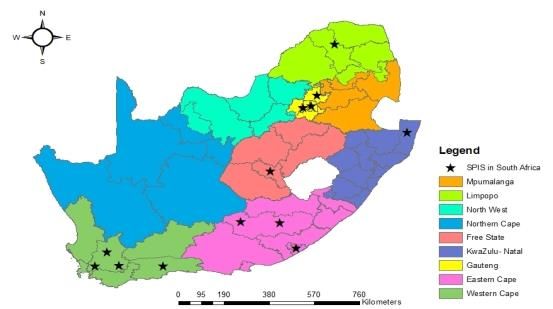
1. Introduction                                            procedures used to develop and distribute a ques-
South Africa has a high potential for solar powered        tionnaire to determine the extent of SPIS in South
irrigation, as it receives high levels of direct normal    Africa. Before developing the questionnaire, an ap-
irradiation. In the agricultural sector, irrigation is a   plication for ethical clearance was conducted
major consumer of electricity (DoE, 2012). The pro-        through the Research Office in the University of
duction of electrical energy through solar photovol-       Kwa-Zulu Natal and approved under Protocol Ref-
taic (PV) panels is one of the most environmentally        erence Number HSS/1039/017M.
friendly, emission free and sustainable sources of
energy known. However, the main source of electri-         2.1 Survey questionnaire
cal power in South Africa remains fossil fuels, with       The questionnaire (see supplementary material)
most of its electrical power produced by coal-fired        targeted four groups of stakeholders: (i) SPIS users,
power stations.                                            (ii) engineers, installers and suppliers, (iii) poten-
    South Africa’s electricity costs were once among       tial SPIS users, and (iv) former SPIS users. Initially,
the cheapest in the world. This was before 2008            the questionnaire was developed as a MSWord doc-
when Eskom, the country’s energy supplier, had             ument where there were different sections for each
trouble meeting the country’s electricity demands          respondent to complete. A questionnaire was se-
(Jumman and Lecler, 2010). This was the result of          lected as the only tool for data collection due to
the infrastructure, at the time, not matching the          budget and time constraints. Due to the problem en-
maintenance requirements and the growth de-                countered of targeted stakeholders not participat-
mands of the country. The result was a decline in          ing in the survey, the approach was changed to an
service, the introduction of ‘load shedding’ and an        online questionnaire where participants had an op-
increase in electricity tariffs. A 25% tariff increase     tion to participate on their desktops or mobile
effective from 2010 and for each of the following          phones. Survey Monkey® (SurveyMonkey, 1999)
three years was approved. The economic state of            was used to create and administer the question-
the country, coupled with the tariff increases and         naire online. Survey Monkey is an online applica-
load shedding, was set to have a negative impact on        tion that helps users create and distribute surveys
farm profitability sustainably (Jumman and Lecler,         and to collect and analyse the data obtained. Two
2010).                                                     questionnaires were designed – one for SPIS engi-
    Most of the irrigation infrastructure in South Af-     neers, designers and installers, the other for SPIS
rica is on commercial farms, where the source of           users and farmers. A pilot test was not conducted,
water is highly dependent on surface water re-             as the sample size was unknown before the ques-
sources such as rivers and dams. Commercial farm-          tionnaire was distributed, but the aim was to cap-
ers are driven by energy efficiency and indepen-           ture all possible stakeholders involved in SPIS.
dence, while smallholder farmers are driven by ac-
cess to energy and the cost of fuel (Hassan, 2015).        2.2 Data collection
According to Hassan (2015), the area of arable land        Several approaches were implemented to try ob-
in South Africa that is under solar powered irriga-        taining data for the questionnaire from the target
tion is estimated to be approximately 2 000 hec-           stakeholders. Calls were made to practising agricul-
tares. Approximately 1.3 million hectares of land          tural engineers working in consulting companies
was under irrigation in 2014/2015 according to             and government departments around South Africa.
Bonthuys (2018). Apart from the Hassan report,             Requests were made to the South African Irrigation
there is little information and documentation on           Institute and the South African Institute for Agricul-
the extent of solar powered irrigation systems             tural Engineers to assist in the distribution of the
(SPIS) development in South Africa, and the infor-         questionnaire by sending out links to the question-
mation available is mainly short articles on one SPIS      naires to their members. The researcher attended a
that has been implemented by a company for expo-           training programme at Franklin Electric® where
sure (Erasmus, 2013; van der Walt 2019). As a re-          companies that sell Franklin Electric products were
sult, information and characterisation about SPIS in       in attendance. The links to the questionnaires were
South Africa is lacking. The main objective of the re-     sent to Farmer’s Weekly magazine, where requests
search reported in this paper was to determine the         for respondents were posted on the Farmer’s
extent and characteristics of solar powered irriga-        Weekly Facebook and Twitter pages. Some follow-
tion in South Africa. All types of SPIS were included      ers on both platforms retweeted and shared the re-
in the research.                                           quests, which helped spread the requests to a wider
                                                           audience. Internet searches were conducted to try
2. Materials and methods                                   finding any documentation on systems imple-
The study was conducted across the whole of South          mented in South Africa and related contacts. A sem-
Africa. The following sections describe the tools and      inar on SPIS in Pretoria was attended (Maslowaten:

                         27   Journal of Energy in Southern Africa • Vol 32 No 2 • May 2021
Large photovoltaic irrigation systems), where net-        54 years (29%); all respondents were male and the
working was done to try finding more participants         majority white. Figure 1 shows the participants’
for the questionnaire. These efforts helped in get-       level of education. These ranged from matric to
ting the questionnaire out to the target participants.    postgraduate degree, with almost half having a
Key informant interviews and focus group discus-          postgraduate degree.
sions were not done, due to budget and time con-
straints.                                                  Table 1: Demographic profile of respondents
                                                           Categories       Number of         Total response
2.3 Analysis                                                               respondents           rate (%)
The data obtained, which were the responses re-
                                                                             (N=18)
ceived from both SPIS engineers, designers and in-
stallers and SPIS farmer respondents through                                     Race
Survey Monkey were analysed by Survey Monkey
                                                           White                13                      81
and linked to Microsoft Excel, where tables, pie
charts and bar graphs with frequencies of the re-          African               2                      13
sults obtained were produced. The data was ana-            Indian                1                      6
lysed to establish statistics such as most and least
common SPIS, highest and least number of SPIS per          Coloured              0                      0
province, total area covered by SPIS, the most com-        Other                 0                      0
mon type of solar panel, etc. Arc GIS was then used
                                                           Skipped               2                      -
to provide a visual presentation of the location of
the SPIS systems that were identified through the                               Gender
questionnaire.
                                                           Male                 18                  100
3. Results                                                 Female                0                      0
The results presented below are for responses from                        Age range (Years)
the SPIS engineers, designers and installers, and the
SPIS farmers. Eighteen respondents participated in         18–24                 0                      0
the SPIS engineers, designers and installers ques-         25–34                 4                      24
tionnaire and 13 in the SPIS users and farmers.
                                                           35–44                 3                      18
3.1 Responses from SPIS engineers, designers               45–54                 5                      29
and installers                                             55–64                 4                      24
3.1.1   Basic demographic information
The demographics of the SPIS engineers, designers          65–74                 1                      6
and installers, such as race, gender and age are pre-      >75                   0                      0
sented in Table 1. The age range of the respondents
is 25–74 years, and the dominant age range is 45–          Skipped               1                      -

                                                         22%                   Matric

                                                                               Diploma

           44%

                                                                               Undergraduate degree

                                                                               Post- graduate Degree

                                                         28%
                                                                               Other (please specify)

                           6%

                  Figure 1: The highest education level achieved by the respondents.

                        28   Journal of Energy in Southern Africa • Vol 32 No 2 • May 2021
3.1.2     Respondents’ involvement with SPIS                                mented SPIS in multiple provinces selected more
Figures 2 to 5 show the involvement of the SPIS en-                         than one province. The Eastern Cape and the West-
gineers, installers and designers with SPIS and their                       ern Cape have the top SPIS implementation. Figure
opinion on its potential in South Africa.                                   5 shows the percentage of irrigation systems mainly
    Figure 2 shows the range of SPIS each respond-                          integrated with SPIS, and it is evident that sprinkler
ent has been involved with. Most are in companies                           and drip irrigation had the most integration.
or institutions that have implemented 0–5 SPIS                                  When asked whether the SPIS they imple-
(61%). Figure 3 shows the type of farming where                             mented had been vandalised or not, 78% of the re-
participants have implemented SPIS. Almost half of                          spondents replied negatively, and 22% replied that
the respondents implemented SPIS for smallholder                            some of the SPIS had been vandalised.
farming. Smallholder farming, as opposed to sub-                                In response to the question about whether they
sistence farming, is defined as farming which prac-                         believe SPIS is feasible in South Africa, most re-
tises both commercial and subsistence farming and                           spondents (89%) answered that they did. Their
the labour force is mainly the family (Cornish, 1998;                       conclusion is credible since these respondents are
Gomo, 2010). The respondents were asked about                               the ones involved in the design and implementation
the provinces where they have implemented SPIS.                             of SPIS in South Africa. One of their key implemen-
Figure 4 indicates that the respondents who imple-                          tation activities is to carry out feasibilities.

                                         100
                                          90
               Number of responses (%)

                                          80
                                          70         61
                                          60
                                          50
                                          40                                                                   33
                                          30
                                          20
                                          10                            6
                                           0
                                                    0-5              6-11             12-17                 >17
                                                   Range of number of SPIS implemented by company

        Figure 2: The range of SPIS implemented by the respondents’ company or institution.

                                                  6%
                                          6%                                                     Commerical

             11%                                                                  33%
                                                                                                 Smallholder

                                                                                                 Subsistence

                                                                                                 Domestic Agricultural Civil

                                                                                                 Landscape Irrigation

                                         44%

     Figure 3: The main type of farming for which the respondent’s company implements SPIS.

                                           29   Journal of Energy in Southern Africa • Vol 32 No 2 • May 2021
7
                                6                                                                               6
                       6
      Number of SPIS                    5                                5           5
                       5
                                                   4                                         4          4
                       4
                                                               3
                       3
                       2
                       1
                       0

                            Figure 4: The provinces where the respondents have implemented SPIS.

                                                                                                    Sprinkler
                                28%
                                                                               33%
                                                                                                    Furrow

                                                                                                    Micro-sprinkler

                                                                                                    Drip Irrigation

                           6%
                                                                                                    Center Pivot

                                                                                                    Other (please specify)
                                                                   33%

                                Figure 5: Types of irrigation systems a company mainly implemented.

3.2 Responses from SPIS users (farmers)                                        Categories    No, of respond-    Total response
3.2.1 Basic SPIS user information                                                             ents (N = 13)        rate (%)
The demographics of the SPIS users are given in Ta-
                                                                                                   Gender
ble 2. Most respondents were white, followed by Af-
ricans, and all of them were males. The respondent                               Male               13                100
ages ranged between 25 and 74, with the dominant                                Female               0                 0
range being 45–54.                                                                                  Age
                                                                                 18–24              0                 0
 Table 2: The demographics of the SPIS users
                                                                                 25–34              1                 9
  Categories                    No, of respond-     Total response               35–44              2                 18
                                 ents (N = 13)         rate (%)
                                                                                 45–54              8                 55
                                      Race                                       55–64              1                 9
   White                              10                  77                     65–74              1                 9
   African                             3                  23                      >75               0                 0
   Indian                              0                  0
  Coloured                             0                  0
                                                                             Figure 6 shows the highest education level obtained
    Other                              0                  0                  by each participant.

                                      30     Journal of Energy in Southern Africa • Vol 32 No 2 • May 2021
3.2.2    Location of the SPIS                             ure 7. Table 3 shows the province, the district mu-
The location of the SPIS users, such as the province      nicipalities and metropolitans and the size of each
and district municipality, in which the farm is lo-       farm. The largest SPIS system is in the Western
cated, and the area of the farm, is presented in Fig-     Cape, with a farm size of 140 ha. The smallest SPIS
ure 7 and Table 3. The Western Cape province had          system is in Limpopo, with a farm size of 0.1 ha.
the highest number of SPIS (31%), as shown in Fig-

                             8%                8%

                                                                                 Matric

                                                                                 Diploma
      23%

                                                                                 Undergraduate Degree

                                                                38%
                                                                                 Post- graduate Degree

                                                                                 Other (please specify)
                 23%

                             Figure 6: The education level of the respondents.

            Figure 7: South African map showing the location of SPIS that were determined.

                        31    Journal of Energy in Southern Africa • Vol 32 No 2 • May 2021
Table 3: The province, municipalities and farm sizes of the SPIS systems
                                                                                                   Farm size
  Number of SPIS             Province                   Municipality/Metropolitan                    (ha)
         1                   Free State                  Mangaung Metropolitan                           4.3
         2                   Limpopo                         Capricorn District                          0.1
         3                Western Cape                         Eden District                             41
         4                Western Cape                         Eden District                             60
         5                Western Cape                   Cape Winelands District                        140
         6                Western Cape                   Cape Winelands District                         35
         7                Eastern Cape                   Buffalo City Metropolitan                       12
         8                   Gauteng                     Ekurhuleni Metropolitan                         2
         9                Western Cape                   Cape Winelands District                         48
        10                   Gauteng                   City of Tshwane Metropolitan                      4
        11                   Gauteng                City of Johannesburg Metropolitan            Not specified
        12                Eastern Cape                      Chris Hani District                          10
        13               KwaZulu- Natal                      Zululand District                           8

    Total area                                                                                          364.4

3.2.3 Characteristics and components of the SPIS          a borehole, followed by river or dam. Figure 10
The characteristics of each SPIS were checked to de-      shows that drip irrigation and sprinkler irrigation
termine whether a trend existed for the SPIS users.       are equally the most integrated with SPIS. As shown
Figures 8–12 illustrate the characteristics of the        in Figure 11, the type of solar panel that is used for
farmers’ SPIS. Figure 8 shows that commercial             SPIS by the respondents is mainly poly-crystalline.
farming is the most common type of farming inte-          Figure 12 shows that most of the respondents have
grated with SPIS. Figure 9 shows the water source         a submersible multistage centrifugal motor pump
that is dominantly used with SPIS by percentage is        set pumping water.

                             8%

                                                                               Commercial

                                                                               Smallholder

                                                                               Subsistence
             38%                                               54%

                                                                               Other (please specify)

                   Figure 8: The type of farm the respondents’ SPIS is integrated with.

                        32    Journal of Energy in Southern Africa • Vol 32 No 2 • May 2021
8%

                                                                                                                             Borehole

                                                                                                                             River/Dam
                            31%

                                                                                                                             Other (please specify)
                                                                                                         61%

                                                                         Figure 9: The type of water source for irrigation.

                            100
Number of respondents (%)

                            80

                            60

                                                              38%                                               38%
                            40

                            20
                                                                                 8%                                              8%               8%

                              0
                                                             Sprinkler          Furrow     Micro-sprinkler Drip irrigation   Centre Pivot         Other
                                                                                            Type of irrigation techniques

                                                             Figure 10: The type of irrigation technique SPIS is integrated with.

                                                             100
                                  Number of Respondents(%)

                                                                                             77%
                                                              80

                                                              60

                                                              40
                                                                                                                 15%
                                                              20           8%
                                                               0
                                                                    Mono-crystalline     Poly-crystalline       Thin-film             Other
                                                                                                Types of Solar Panels

                                                             Figure 11: The type of solar panel used in the respondents’ SPIS.

                                                                   33    Journal of Energy in Southern Africa • Vol 32 No 2 • May 2021
100
                       90
Number of pumps (%)

                       80
                       70        62%
                       60
                       50
                       40
                       30
                       20                                                           15%              15%
                                                                                                                         8%
                       10
                        0
                              Submersible Submersible pump Reciprocating Floating pump set Surface suction            Other
                               multistage      with surface Floating positive                 pump set
                            centrifugal motor mounted motor   displacement
                                pump set                          pump
                                                                  Types of motor-pumps

                                            Figure 12: The type of pump-motor set used for the SPIS.

                                              Table 4: Energy and potential energy storage of SPIS.
                                                                    Yes                   No                Skipped       Total re-
                                                                                                                          sponses
                                                             No.     Percent-      No.    Percent-    No.     Percent-
                                                                     age (%)              age (%)             age (%)
                      Does the system have batteries?         1           8         12         92     0          0            13
                      Is the system connected to the          4           31        9          69     0          0            13
                      grid?
                      Does the system use a generator         3           23        9          69     1          8            13
                      for backup power?
                      Does the system have a water tank       4           31        9          69     0          0            13
                      to store excess water pumped?
                      Do you ever have pressure and or        4           31        9          69     0          1            13
                      flow rate problems?

                 3.2.4 Storage options (energy and water)                      the larger number of respondents said no. The next
                 The use of solar power in pumping water may need              question was if the respondents’ SPIS had a storage
                 some type of water- or energy-storage option, de-             water tank, and most responded no. Similarly,
                 pending on the demands of the farm. There are two             asked if respondents had pressure or flow rate
                 possibilities for storage of excess electricity pro-          problems with their SPIS, most responded no.
                 duced from the solar panels – a battery, and using
                 the electrical grid. A storage water tank is used in a        3.2.5     Additional information on the SPIS
                 SPIS to store water that is pumped for use on days            Additional information about the SPIS’s of the re-
                 when there is not enough solar radiation to power             spondents is captured in Figures 12–15. Figure 13
                 the motor pump set. Another alternative for back-             shows the years in which the respondents installed
                 up energy is a generator, which can be used when              their SPIS. The years 2013 and 2016 had the highest
                 there is not enough solar irradiation available to            installation of SPIS. One respondent did not men-
                 pump water for irrigation.                                    tion which year they implemented their SPIS.
                     Table 4 shows the responses given to five ques-               The respondents were asked what changes they
                 tions that required answers of yes or no. Respond-            would implement to their SPIS. As Figure 14 shows,
                 ents were asked if their SPIS had batteries and most          most replied that they would increase the security
                 responses were no. Then they were asked if their              of their SPIS. Figure 15 shows the results for the
                 systems were connected to the electrical grid, and            power source the respondents were using before
                 the dominant response was no. Asked whether a                 they installed the SPIS – most of them were using
                 back-up generator was integrated with their SPIS,             grid electricity.

                                            34   Journal of Energy in Southern Africa • Vol 32 No 2 • May 2021
100
                                90
Number of SPIS installed (%)

                                80
                                70
                                60
                                50
                                40                                                                                                                                          31%       31%
                                30
                                20
                                     8%                                                                                                                           8%     8%      8%
                                10
                                 0

                                                                                                                        Years in which SPIS were installed

                                                                          Figure 13: The year in which the SPIS was implemented.

                                                                 100
                                                                  90
                                      Number of respondents(%)

                                                                  80
                                                                  70
                                                                  60
                                                                  50                                                             46%

                                                                  40                                    31%
                                                                  30                                                                                                     23%
                                                                  20
                                                                  10
                                                                   0
                                                                        Add batteries or a                              Increase security  Change irrigation             Other
                                                                           generator                                                           technique
                                                                                                                    Changes respondents would like to implement

                                                                 Figure 14: Improvements the respondents would implement to their SPIS.

                                                                                                       100
                                                                         Number of power sources (%)

                                                                                                        90
                                                                                                        80         70%
                                                                                                        70
                                                                                                        60
                                                                                                        50
                                                                                                        40
                                                                                                        30
                                                                                                        20                                  15%               15%
                                                                                                        10
                                                                                                         0
                                                                                                              Grid electricity         Diesel Generator      No power
                                                                                                                                       Power sources

                                                                   Figure 15: The power source each respondent used before the SPIS.

                                                                         35                              Journal of Energy in Southern Africa • Vol 32 No 2 • May 2021
4. Discussion form in South Africa (Hassan, 2015). In other coun-
This section discusses the results obtained from the tries, governments are promoting the use of SPIS in
questionnaires distributed to SPIS engineers, de- the framework of their national action plan regard-
signers and installers and SPIS users. ing climate change as a way to reduce emissions in
the agricultural sector (Hartung and Pluschke,
4.1 SPIS engineers, designers and installers 2018). South Africa has not done this yet.
The discussion on the results is split into two in this According to the study by Hassan (2015), there
subsection. The respondents’ basic information, are more than 225 000 smallholder farmers in
which includes the demographics and the education South Africa, occupying an estimated 10 million ha;
level and the respondents’ involvement with SPIS. over 40 000 commercial farmers occupying an esti-
mated 82 million ha; and roughly 3 million house-
4.1.1 Respondents’ basic information holds with subsistence farmers occupying 4 million
The race results correspond to the Engineering ha. Commercial farms are generally large and would
Council of South Africa’s (ECSA) total number of require many solar panels that will require large ar-
registered engineers in 2016, where registration by eas of land to provide power for irrigation systems
race of engineers for White, African, Coloured and and high investment costs for the solar technology
Indian are 71%, 18%, 9% and 2% respectively. The required. This explains the high number of SPIS that
reason for the low registration of non-white engi- are implemented for smallholder irrigation sys-
neers is related to individuals migrating to other tems. The high investment costs that come with
economic sectors or creating their own business SPIS would prevent subsistence farmers from im-
opportunities outside engineering (ECSA, 2016). plementing SPIS. Subsistence farmers grow crops
The results for gender also correspond to ECSA’s for their own use to feed their families only. This
2016 annual report, which states that 10% of regis- would support the result of the low implementation
tered engineers were women (ECSA, 2016; Pa- of SPIS for subsistence farms, due to the farmers not
dayachee, 2017). Gender bias is one of the main selling their crops for profit to be able to afford SPIS.
reasons stated by Padayachee. This means that Smallholder farmers own small plots of land on
fewer women than men become professional engi- which subsistence crops are grown and one or two
neers. Another reason is gender imbalance, which cash crops which are sold for profit. Since the plot
means that the fields of science, technology, engi- areas are small, the number of solar panels would
neering and mathematics in 2016 had 23% of be small compared to large commercial farms.
women globally. Padayachee stresses that the gap Though the investment cost of SPIS is high, small-
needs to be addressed and prioritised so that more holder farmers would be able to save profit from
women can join these fields. their cash crops and/or apply for a loan to assist in
The education level of the SPIS engineers, in- purchasing a SPIS.
stallers and designers, does not correspond to the Singh (2016) states that the north and north-
2012 findings of the Council on Higher Education of west regions of South Africa receive more solar ra-
South Africa, which state there are 41% of engineer- diation than the south and south east. Shortwave
ing graduates with certificates and diplomas and flux (SWflux) is a measure of solar radiation per
44% of engineering graduates with undergraduate square area. Between 1980 and 2009, the Northern
degrees (CHESA, 2012). The results from the survey Cape received the highest mean SWflux, followed by
show that many respondents have a postgraduate North West, Free State, Limpopo, Gauteng, Mpuma-
degree. In South Africa, the University of South Af- langa, Western Cape, Eastern Cape and Kwa-Zulu
rica and the University of Pretoria offer engineering Natal. Niekerk et al. (2018) identified the irrigated
honours degrees, which are considered to be post- area in South African provinces, and the Western
graduate degrees in South Africa. Cape (269 476 ha) has the highest irrigated area,
followed by Limpopo (218 302 ha), Eastern Cape
4.1.2 Respondents’ involvement with SPIS (152 866 ha), Northern Cape (144 579 ha), Mpuma-
There may be an overlap of the results, as some re- langa (125 595ha), Kwa-Zulu Natal (177 341 ha),
spondents may have come from the same company. North West (97 211 ha), Free State (129 077 ha)
This cannot be confirmed because the respondents and Gauteng (20 115 ha).This suggests why the
answered the questionnaire anonymously. The Western Cape and the Eastern Cape have the high-
small number of SPIS implementation around the est implementation of SPIS.
country is mainly due to the high investment cost The Department of Water and Sanitation in
that comes with SPIS, as well as the perception of 2014 had 32% of their registered water users using
theft and security risk associated with them. There sprinkler irrigation systems, followed by 29% using
is also limited understanding of technology by moving irrigation systems, then 26% using micro-
banks for financing and the possibility of land re- irrigation systems, and 14% using flood irrigation
36 Journal of Energy in Southern Africa • Vol 32 No 2 • May 2021systems (Schulze, 2016). This explains why the re- 4.2.2 Location information of SPIS
spondents have primarily integrated SPIS with Table 3 and Figure 7 shows that four of the 13 SPIS
sprinkler and drip irrigation. According to Zegeye et are in the Western Cape, three each in the Eastern
al. (2014), photovoltaic energy has been widely Cape and Gauteng; Limpopo, KwaZulu- Natal and
used in low power applications in the world. A the Free State have one SPIS system. Figure 4 shows
drip irrigation system requires low head compared that engineers, installers and designers have imple-
to other irrigation systems, lowering their power mented SPIS in all provinces. The survey for SPIS
requirements. users did not reflect users in Mpumalanga, North-
South Africa receives high levels of solar irradi- ern Cape and North West. The data collected from
ation that can be converted into electrical power the SPIS users and SPIS engineers, designers and in-
(DoE and GIZ, 2015). Hassan (2015) states that so- stallers does not correlate because the survey ques-
lar is competitive with diesel when a grid connec- tionnaire did not reach as many respondents as
tion is not available. Many respondents feel that expected. Hassan (2015) states that commercial
SPIS has potential in South Africa and they men- famers in South Africa are driven toward SPIS be-
tioned the following reasons for this: cause of energy independence and efficiency. This
• SPIS saves energy and has better returns if the shows why most of the SPIS users are commercial
system is subsidised. farmers.
• Grid electricity from Eskom is rising in price
and is likely to become more expensive and 4.2.3 Characteristics and components of the SPIS
unreliable in the future, and the economy is The Department of Water and Forestry (2004)
volatile. stated that South Africa primarily uses surface wa-
• The prices of solar technology are decreasing ter for most of its urban, industrial and irrigation
and will continue to make it more affordable. requirements. Groundwater is also used, but mainly
• With small-scale irrigation systems, SPIS has in rural areas and more arid areas. Groundwater
more potential. use is limited to a few places in the country due to
• South Africa receives a significant amount of the geology that is hard rock. This information does
solar irradiation, which can be utilized with not correspond to the results obtained in the survey
low-pressure irrigation systems as most of the SPIS use boreholes as a water source.
• SPIS save a lot of money in the long run Most of the respondents have sprinkler and drip
• South Africa receives high levels of sunshine irrigation systems. One of the benefits of having
and there are many areas that are off the grid. these two irrigation techniques integrated with so-
lar power is that, compared to furrow and centre
The respondents that felt SPIS has no potential
pivot irrigation, the power requirements of these
in South Africa gave the following reasons:
systems are low head, meaning lower pumping
• The cost of infrastructure requirements is too
costs (Basalike, 2015).
high, and it is not economically viable
The most commonly used type of solar panel for
• Solar is not suitable for irrigation because of the
SPIS is poly-crystalline solar panels. These results
varying eight hours of sunlight received daily in
correspond to the literature, where the cost factor
South Africa on average.
of mono-crystalline solar panels overrules its ad-
vantage with its efficiency, which ranges between
4.2 SPIS users (farmers)
15–20%, while the efficiency of polycrystalline so-
The discussion on the results is split into five in this
lar panels ranges between 13–16% (Bharam, 2012;
sub-section, covering the respondents’ information,
Davies, 2013). The cost of poly-crystalline solar
which includes demographics and the education
panels is less than the cost of mono-crystalline solar
level, the location information of the SPIS, the char-
panels (Davies, 2013). Thin-film solar panels are
acteristics and components of SPIS, storage options
the cheapest type of solar panel, but the reason why
and additional information of the SPIS.
this type of solar panel is seldom used is be-
cause their efficiency is lower, at 7–13%, which
4.2.1 Basic SPIS user information
means they require more space (Davies, 2013;
These results are presented in Figure 6. According
Sendy, 2017).
to the Department of Rural Development and Land
Reform (2017), 72% of South African farms and ag-
4.2.4 Storage options (energy and water)
ricultural holdings are owned by white people.
The submersible centrifugal pump has a high relia-
Males own 72% of farms and land and agricultural
bility for pumping water, especially for boreholes
holdings, while females own 13%, 11% is Male-Fe-
with medium depth (60 m) (Argaw, 2003). The sub-
male owned and 1% is co-owned. Figure 7 reflects
mersible multistage centrifugal pump can provide
this reality of white men dominating the ownership
high head pumping requirements (Volk, 2005).
of farms in South Africa.
37 Journal of Energy in Southern Africa • Vol 32 No 2 • May 2021Most of the respondents are pumping water from a of the SPIS users opted to use solar as a power
borehole and most of the respondents are using source for their water pumping needs was to get off
submersible multistage centrifugal pumps with the electrical grid and have some energy independ-
their SPIS. ence. This was due to the increase in electrical
There are disadvantages to using a battery pack power costs and unreliable electricity supply dur-
in a SPIS, including a reduction in the efficiency of ing the years South Africa experienced load shed-
the overall system, because the operating voltage is ding. This can also be seen by the fact that most SPIS
dictated by the batteries and not the solar panels. users installed their SPIS from 2010 to 2016. It was
Batteries are not recommended, because of the ad- also found during this study that solar powered ir-
ditional cost for maintenance and initial cost of the rigation has potential in South Africa, as most of the
system (Eker, 2005). This explains why only a few SPIS users that participated in the questionnaire
SPIS users have SPIS with a battery pack. The rea- are commercial farmers.
son there are few grid-connected SPIS is that Eskom The solar panel type that is predominantly used
does not allow the connection of small-scale gener- is poly-crystalline solar panels, because of its high
ator connections to their low voltage networks be- efficiency (13–16%) compared to thin-film solar
cause this places the safety of the public and panels (7–13%), and its lower cost than mono-crys-
Eskom's operating staff at risk (Eskom, 2014). talline solar panels. Sprinkler and drip irrigation
Biswas and Iqbal (2018) state that the use of a die- are the techniques that are mainly integrated with
sel engine provides lower costs for hybrid systems, solar powered irrigation by the SPIS users that par-
but they are a bad solution for longer periods of ticipated in the questionnaire. These two irrigation
time due to increasing fuel prices and pollution of systems are predominant in South Africa, so it is im-
the environment. According to Abdelfattah (2017), portant that funders and policy makers target them
a stand-alone system with an elevated storage wa- for solar power integration. The motor-pump set
ter tank is the most popular. This is not reflected in that is primarily used by the SPIS users is the sub-
the results, as only 36% of the respondents have mersible multistage centrifugal motor-pump set.
storage water tanks integrated with their SPIS. These types of pumps are high head low flow types
The design of SPIS needs to be fit-for-purpose of pumps, where they can be used to pump water
and needs regular services to advise farmers on the from deep surface water and boreholes. Most of the
most suitable system, but these are often not in SPIS users pump their water from boreholes. This
place (Hartung and Pluschke, 2018). This is the information helps the designers and installers with
cause of some systems having low pressure and proper sizing and integration of appropriate solar
flow rates at times. panels according to the water source.
Overall, the information acquired gave an idea of
4.2.5 Additional information on the SPIS the extent of SPIS in South Africa and the main char-
Eskom resorted to national ‘load shedding’ from acteristics of SPIS in South Africa.
late 2007 to protect the power system from a total The recommendations going forward with this
black out, and a national emergency was declared in study are to find a better way to obtain responses
January 2008. Load shedding continued until the from the SPIS users that were not identified. This
end of March 2008, while Eskom initiated a recov- can be done by visiting SPIS engineers, installers
ery plan, with the support of the government and and designers directly and asking them for the de-
business’ (Joffe, 2012). This would explain the high tails of the SPIS they implemented, and possibly
implementation of SPIS during 2010 and 2016 as also giving the contact information of the SPIS us-
most of the respondents switched from Eskom grid ers. Some companies are restricted from doing this,
electricity to solar power. however. It is recommended that a detailed study
SPIS is vulnerable to theft and vandalism in be conducted to establish the feasibility of SPIS de-
some areas in South Africa (Makana Municipality, velopment in South Africa.
2005; Hartung and Pluschke, 2018). The problem of
theft and vandalism is why many of the SPIS users Authors contributions
specified increasing the security of their SPIS. This P. Piliso: Conceptualisation, investigation, data collection,
also explains why some SPIS engineers, designers data analysis, drafting and development of the manu-
and installers have had some of the SPIS they been script.
A. Senzanje: Conceptualisation, project supervision and
involved with vandalised.
writing – review and editing.
K. Dhavu: Funding acquisition, project supervision and
5. Conclusion and recommendations writing – review and editing.
This study concludes that there is SPIS in South Af-
rica, and a significant amount is located in the West- Acknowledgements
ern Cape and the Eastern Cape, but the other The authors thank the Water Research Commission for fi-
provinces do also have SPIS. The main reason most nancial support to conduct the research.
38 Journal of Energy in Southern Africa • Vol 32 No 2 • May 2021References
Abdelfattah, A. 2017. Solar powered water lifting for irrigation. Food and Agriculture Organization of the United Na-
tions, Rome, Italy.
Argaw, N. 2003. Renewable energy for water pumping applications in rural villages. National Renewable Energy La-
boratory, Colorado, USA.
Basalike, P. 2015. Design, optimization and economic analysis of photovoltaic water pumping technologies, case
Rwanda. Unpublished thesis, School of Business, Society and Engineering, Mälardalen University, Västerås, Swe-
den.
Bharam, V. 2012. Solar energy: Materials for photovolaic cell advantages and challenges for silicon in the photovoltaic
cells. Trinity College, Connecticut, USA.
Biswas, S and Iqbal, M. 2018. Dynamic modelling of solar water pumping system with energy storage. Journal of Solar
Energy 1 (1): 1–12. doi: 10.1155/2018/8471715
Bonthuys, J. 2018. In-depth study shed light on irrigated farming areas, water use. [Internet] The Water Wheel. Availa-
ble from: http://www.wrc.org.za/wp-content/uploads/mdocs/WW%20July_Aug%202018%20IRRIGA-
TION%20WATER%20USE.pdf. [Accessed: 04 May 20201].
CHESA [Council of Higher Education South Africa].2012. Vital Stats Public Higher Education 2012 [Internet]. Available
from: https://www.che.ac.za/#/docview. [Accessed: 25 September 2018].
Cornish, G. 1998. Modern irrigation technologies for smallholders in developing countries. Intermediate Technology Publi-
cations in association with HR Wallingford UK.
Davies, S. 2013. Solar panel types. Solarflex SA, Somerset West, South Africa.
DoE [Department of Energy]. 2012. Draft 2012 integrated energy planning report. Department of Energy, Pretoria,
South Africa.
DoE [Department of Energy] and GIZ [Deutsche Gesellschaft für Internationale Zusammenarbeit]. 2015. State of re-
newable energy in South Africa. Department of Energy, Pretoria, South Africa.
Department of Rural Development and Land Reform. 2017. Land audit report: Phase II: Private land ownership by race,
gender and nationality. Department of Rural Development and Land Reform, Pretoria, South Africa.
DWF [Department of Water Affairs and Forestry]. 2004. National water resource strategy. Department of Water Affairs
and Forestry, Pretoria, South Africa.
ECSA [Engineering Council of South Africa]. 2016. Engineering Council of South Africa annual report 2015/2016. Engi-
neering Council of South Africa, Waterview Corner Building e Ernest Oppenheimer Avenue Bruma 2198, South
Africa.
Eker, B. 2005. Solar powered water pumping systems. Trakia Journal of Sciences 3 (7): 7–11.
Erasmus, D. 2013. Solar energy use on the rise in SA. [Internet]. Farmer's Weekly. Available from: https://www.farm-
ersweekly.co.za/agri-technology/farming-for-tomorrow/solar-energy-use-on-the-rise-in-sa. [Accessed: 05 Octo-
ber 2018].
Eskom. 2014. Connection of small-scale renewable generation to Eskom's network. [Internet]. Eskom. Available from:
http://www.eskom.co.za/Whatweredoing/Documents/CustBulletinLPU.pdf#page=1&zoom=auto,-19,325. [Ac-
cessed:30 September 2018].
Gomo,T. 2010. Assessing the performance of smallholder irrigation in South Africa and opportunities for deriving best
management practices. Thesis, School of Bioresources Engineering and Environmental Hydrology, University of
KwaZulu-Natal, Pietermaritzburg, South Africa.
Hartung, H and Pluschke, L. 2018. The benefits and risks of solar-powered irrigation - A global overview. Food and Agri-
cultural Organization of the United Nations, Rome, Italy.
Hassan, M. 2015. Market assessments for solar-powered irrigation pumps in Morocco, South Africa and Yemen. Interna-
tional Finance Corporation, Rome, Italy.
Joffe, H. 2012. Challenges for South Africa's electricity supply industry. The Journal of the Helen Suzman Foundation
(64): 32–37.
Jumman, A and Lecler, N. 2010. Electricity tariff increases impact on irrigators. Proceedings of the South African Sugar
Technology Association (83): 152–155.
Laswell, R. 2018. Comparing monocrystalline, polycrystalline, and thin-film solar panels. [Internet]. Semprius. Availa-
ble from: https://www.semprius.com/comparing-mono-polycrystalline-and-thin-film-solar-panels/. [Accessed:
10 October 2018].
Niekerk, A, Jarmain, C, Goudriaan, R, Muller, S, Ferreira, F, Münch, Z, Pauw, T, Stephenson, G and Gibson, L. 2018. An
earth observation approach towards mapping irrigated areas and quantifying water use by irrigated crops in
South Africa. Report No. TT 745/17. Water Research Commission, Gezina, South Africa.
Padayachee, P. 2017. We have too few women engineers in South Africa - Here's what we can do to fix that. [Internet].
Huffington Post. Available from: https://www.huffingtonpost.co.za/priyanka-padayachee/we-have-too-few-
women-engineers-in-south-africa_a_21703682/. [Accessed: 25 September 2018].
Makana Municipality. 2005. Local Environmental Action Plan. Part III Comprehensive Audit Report: Domestic energy,
solar power and waste management. Makana Municipality, South Africa.
39 Journal of Energy in Southern Africa • Vol 32 No 2 • May 2021Schulze, RE. 2016. On observations, climate challenges, the South African agriculture sector and considerations for an
adaptation handbook. In: Schulze, R.E.(ed), Handbook for farmers, officials and other stakeholders on adaptation to
climate change in the agriculture sector within South Africa. Ch Section A: Agriculture and climate change in South
Africa: Setting the scene, Chapter A1.
Sendy, A. 2017. Pros and cons of monocrystalline vs polycrystalline solar panels. [Internet]. Solar Reviews. Available
from: https://www.solarreviews.com/blog/pros-and-cons-of-monocrystalline-vs-polycrystalline-solar-panels.
[Accessed: 25 September 2018].
Singh, J. 2016. Ranking South African provinces on the basis of MERRA 2D surface incident shortwave flux. Journal of
Energy in Southern Africa 27 (3): 50–57. doi: 10.17159/2413-3051/2016/v27i3a1555
SurveyMonkey. 1999. Survey Monkey. [Internet]. Available from: https://www.surveymonkey.com/. [Accessed: 30
August 2018].
Van der Walt, J. 2019. Western Cape boasts Africa's first floating solar system. [Internet]. Farmers Weekly. Available
from: https://www.farmersweekly.co.za/agri-news/south-africa/western-cape-boasts-africas-first-floating-solar-
system/. [Accessed: 12 May 2019].
Volk, M. 2005. Pump characteristics and applications. Taylor and Francis Group, Boca Raton, Florida, USA.
Zegeye, M, Tadiwos, T and Aman, A. 2014. Optimal sizing of solar water pumping system for small scale irrigation:
Case study of Dangila. International Journal of Renewable and Sustainable Energy 3 (5): 99–107. doi:
10.11648/j.ijrse.20140305.13
40 Journal of Energy in Southern Africa • Vol 32 No 2 • May 2021You can also read