Scotia Howard Weil 47th Annual Energy Conference - WE MAKE ENERGY HAPPEN Alan Armstrong, President and CEO March 27, 2019 - Williams ...

Page created by Milton Cook
 
CONTINUE READING
Scotia Howard Weil 47th Annual Energy Conference - WE MAKE ENERGY HAPPEN Alan Armstrong, President and CEO March 27, 2019 - Williams ...
NYSE: WMB | williams.com

                WE MAKE ENERGY HAPPEN

Scotia Howard Weil 47th Annual Energy Conference
Alan Armstrong, President and CEO
March 27, 2019

                                                   Gulf Connector Expansion Project
                                                   Transco, Atlantic-Gulf
Scotia Howard Weil 47th Annual Energy Conference - WE MAKE ENERGY HAPPEN Alan Armstrong, President and CEO March 27, 2019 - Williams ...
Williams is a unique large-scale, low-volatility, growing natural gas
infrastructure company with high quality revenues
                         STABILITY                                                                        GROWTH                                                                 YIELD & COVERAGE

> Irreplaceable asset base handling 30% of                                     > Nation’s largest and fastest growing                                            > Attractive current dividend yield of 5.6%(1)
   low-cost U.S. natural gas supplies                                              interstate natural gas pipeline system,                                       > 12.5% dividend growth CAGR 2017-2019
> Volume-driven, natural gas strategy                                              Transco, with unrivaled proximity to
                                                                                   growing Mid-Atlantic, Southeast and Gulf                                      > Maintaining strong dividend coverage of
   drives low volatility in earnings and cash                                                                                                                        ~1.7x for reinvestment in growth capital
   flow                                                                            Coast demand centers
                                                                                                                                                                     opportunities
> Large-scale energy company: ~$55 billion                                     > 15% Northeast G&P gathered volume
                                                                                   CAGR expected 2018-2021                                                       > ~$1.25 billion excess cash available after
   enterprise value (1) with IG credit ratings                                                                                                                       dividends in 2019
> 2019 gross margin projected to be ~97%                                       > 18.9% Adjusted EPS growth CAGR
                                                                                   expected 2017-2019 despite $4.6B in asset                                     > Deleveraging through capital discipline,
   fee-based                                                                                                                                                         reinvesting cash flow, and ongoing portfolio
                                                                                   sales since 2016 (1)
> Met or exceeded Adjusted EBITDA street                                                                                                                             optimization transactions
   consensus each of the last 12 quarters (2)                                  > Expecting 8% Adjusted EBITDA growth
                                                                                   2018-2019 (1); 5-7% annual Adjusted                                           > 11.0x EV / 2019 EBITDA multiple (1) below
> Exceeded midpoint for 2017 and 2018                                              EBITDA growth longer term beyond 2019                                             long-term historical average of 12.7x (3)
   key guidance metrics
   (1) Data and estimates per Bloomberg as of February 26, 2019. WMB 2017-2019 growth rates based on midpoint of guidance.
   (2) Per S&P Capital IQ, Williams’ adjusted EBITDA exceeded or was within 2% of the consensus estimate for EBITDA in each quarter 1Q 2016–4Q 2018.
   (3) Represents peer average EV / NTM EBITDA multiple from January 1, 2013 to December 31, 2018; peers include ENB, EPD, ET, KMI, OKE, TRGP, and TRP
   Note: This slide contains non-GAAP financial measures. A reconciliation of all non-GAAP financial measures used in this presentation to their nearest GAAP comparable financial measures are included at the back of this presentation.

© 2019 The Williams Companies, Inc. All rights reserved.                                                                                                                 Scotia Howard Weil 47th Annual Energy Conference I March 2019       2
Scotia Howard Weil 47th Annual Energy Conference - WE MAKE ENERGY HAPPEN Alan Armstrong, President and CEO March 27, 2019 - Williams ...
Consistently delivering on our promises
Key 2018 results exceeded guidance midpoints

            In $Billions except for percentages, ratios and per share amounts
                                                                                                                          2018 GUIDANCE1
                                                                                          $0.193 (Reported)                                          $1.108 (Adjusted)
             Net Income
                                                                                                           $0.975                       $1.075                        $1.175
                                                                                                                                                       $0.79
             Adjusted EPS                                                                                                                                                                               25% increase vs. 2017
                                                                                                                                         $0.76                          $0.82
                                                                                                                                                                    $4.64
             Adjusted EBITDA
                                                                                                            $4.45                        $4.55                          $4.65
                                                                                                                                                                $2.87
             Distributable Cash Flow (DCF)
                                                                                                           $2.60                          $2.75                        $2.90
                                                                                                       Guidance                                              Actual
             Dividend Growth Rate                                                                 10-15% annual growth                                       13.33%
                                                                                                    Guidance Midpoint                                        Actual
             Dividend Coverage Ratio                                                                     ~1.6x                                                1.7x
                                                                                                            Guidance                                          Actual
             Growth Capex                                                                                     $3.9                                             $3.6
                                                                                                           Guidance                                           Actual
             Consolidated Debt / EBITDA2
                                                                                                            ~5.0x                                              4.8x
  Note: This slide contains non-GAAP financial measures. A reconciliation of all non-GAAP financial measures used in this presentation to their nearest GAAP comparable financial measures are included at the back of this presentation.
  1) DCF shown Proforma as if the WPZ transaction had occurred 1/1/18. Dividend payments used in the coverage calculation include WPZ distribution payments to WPZ public unitholders for 1Q and 2Q.
  2) Consolidated Debt / Adjusted EBITDA ratio does not represent leverage ratios measured for WMB credit agreement compliance or leverage ratios as calculated by the major credit ratings agencies. Consolidated debt is net of cash on hand.

© 2019 The Williams Companies, Inc. All rights reserved.                                                                                                                         Scotia Howard Weil 47th Annual Energy Conference I March 2019    3
Scotia Howard Weil 47th Annual Energy Conference - WE MAKE ENERGY HAPPEN Alan Armstrong, President and CEO March 27, 2019 - Williams ...
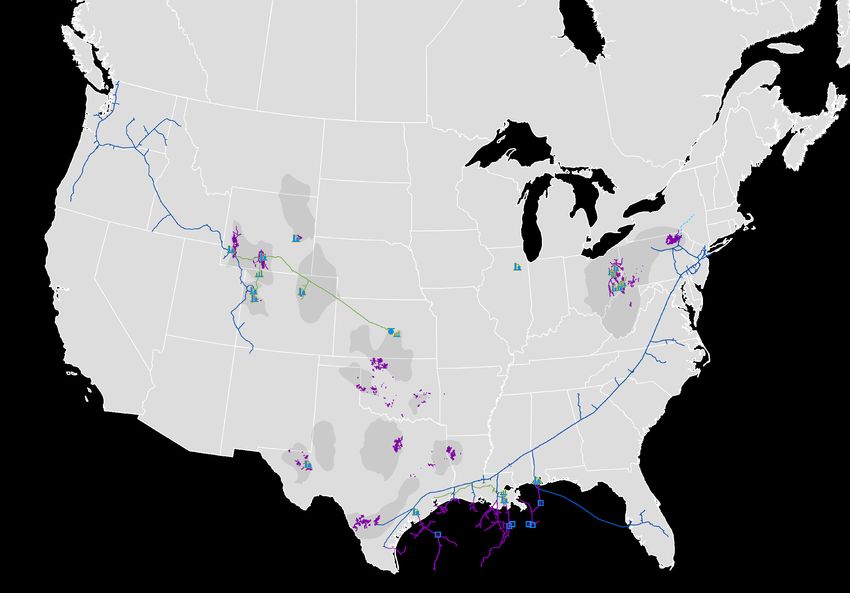
Environmental Social Governance (ESG): Creating value responsibly

                                                           SAFETY                                            ENVIRONMENTAL
          > Strong safety reporting and continuous improvement culture              > Comprehensive Integrated Management System creates disciplined EHS
          > Robust Pipeline Integrity Management Program
                                                                                      management with specific policies, procedures and standards; includes
                                                                                      external and internal audits
          > Performing better than industry benchmark for Total Recordable Injury
                                                                                    > Extensive environmental monitoring and measurement, including
             Rate (TRIR)
                                                                                      emissions tracking and reporting
          > 50% reduction in process safety incidents from 2017 to 2018
                                                                                    > Signatory to INGAA’s Methane Emissions Commitments to minimize
          > Strong commitment to safety and operational discipline by                 methane emissions
             institutionalizing 12 Life Critical Operating Requirements
                                                                                    > Proud history of voluntary environmental conservation and restoration
          > Leading damage prevention and public awareness programs                   projects that exceed regulatory requirements

                                                  GOVERNANCE                                                          SOCIAL
          > Diverse and independent board comprised of industry leaders             > Committed to increased diversity
          > Oversight on ESG issues from Environmental, Health and Safety (EHS);    > Dedicated to excellence in land use and landowner relationships
             Nominating and Governance Committees
                                                                                    > Stakeholder input resulting in more than 400 changes to Atlantic Sunrise’s
          > Compensation aligned with business strategies, including safety           pipeline route
             performance
                                                                                    > $107 million total charitable giving in last decade to more than 8,000
                                                                                      organizations

© 2019 The Williams Companies, Inc. All rights reserved.                                                      Scotia Howard Weil 47th Annual Energy Conference I March 2019   4
Scotia Howard Weil 47th Annual Energy Conference - WE MAKE ENERGY HAPPEN Alan Armstrong, President and CEO March 27, 2019 - Williams ...
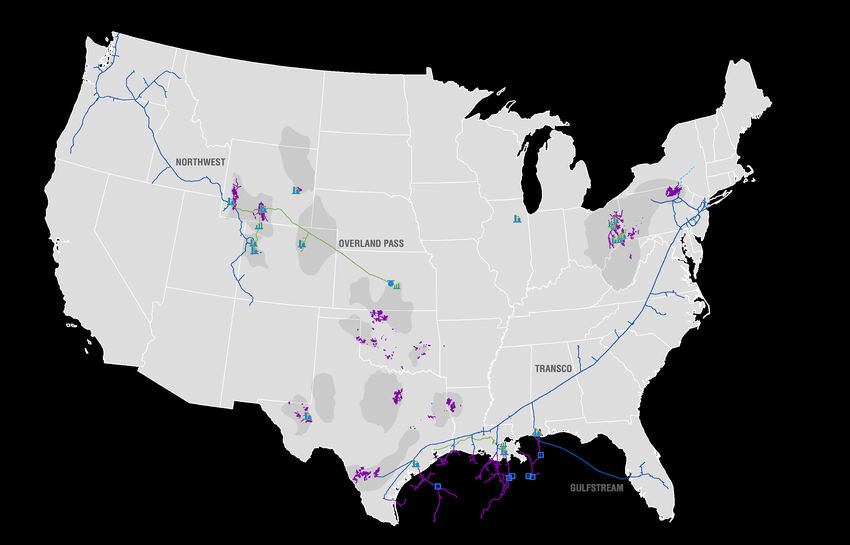
Consistent strategy focused on natural gas volume growth
                                        WILLIAMS HANDLES ~30% OF U.S. NATURAL GAS VOLUMES

                                                                                                                                               Gas End Users

                                                                                                                                              Industrial Residential/
                                                                                                                                                         Commercial
          Wellhead                        Gathering          Gas Processing Plants                          Natural Gas
        (onshore and                    (onshore and             (onshore and                             Transportation                                                    Exports
          Offshore)                       Offshore)                Offshore)                              Lines / Storage
                                         25.3 Bcf/d               11.3 Bcf/d                        22.5 MMdth/d capacity                       Power     Transport
                                        16,480 miles                 inlet                               14,545 miles

                                                                                                                            Multiple
                                                                                                                            Products
                                                                           Mixed NGLs             Fractionation                              NGLStorage           NGL Transportation             Olefins          Olefins End
                                                                                                                                                                 Pipelines/ Truck/ Rail           Plant             Users
                                                                          500 Mbbl/d                Facilities
                                                                                                 730 Mbbl/d                                 24 MMbbls
                                                                                                                                                                        352 Mbbl/d
                                                                                                                                                                                                  Other NGL
                                                                                                                                                                                                  End Users

 Source: Figures represent 100% capacity for operated and non-operated assets, including those in which Williams has a share of ownership. All data as of December 31, 2018.

© 2019 The Williams Companies, Inc. All rights reserved.                                                                                                       Scotia Howard Weil 47th Annual Energy Conference I March 2019    5
Scotia Howard Weil 47th Annual Energy Conference - WE MAKE ENERGY HAPPEN Alan Armstrong, President and CEO March 27, 2019 - Williams ...
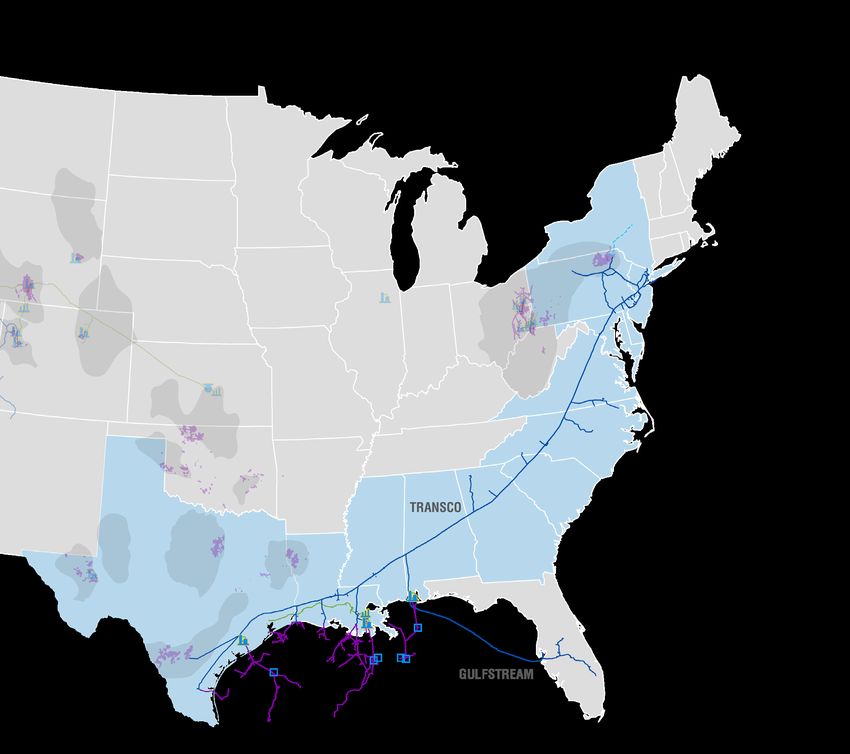
Connecting the best supplies to the
best markets with advantaged infrastructure
                                                           Williams’ U.S. Asset Map
                                                                                                  NORTHEAST G&P
                                                                                                  Operating Area
                                                                                                 > Large-scale asset footprint in place
                                                                                                 > Significant production growth driven
                                                                                                    by infrastructure de-bottlenecking
                                                                                                 > Capital efficient expansions linked
                                                                                                    to existing assets

 WEST
 Operating Area
> Extensive portfolio of reliable assets
                                                                                      ATLANTIC GULF
   connecting sources of supply to demand                                             Operating Area
   markets                                                                            > Irreplaceable infrastructure with low-risk
> Stable cash flows and operational                                                    revenue stream
   efficiencies driving results                                                       > Unmatched growth opportunity linked to
> Growth opportunities continue to                                                     existing assets
   reinforce long-term stability                                                      > Unique footprint with access to low-cost
                                                                                       supply sources and growing demand centers

© 2019 The Williams Companies, Inc. All rights reserved.                                Scotia Howard Weil 47th Annual Energy Conference I March 2019   6
Scotia Howard Weil 47th Annual Energy Conference - WE MAKE ENERGY HAPPEN Alan Armstrong, President and CEO March 27, 2019 - Williams ...
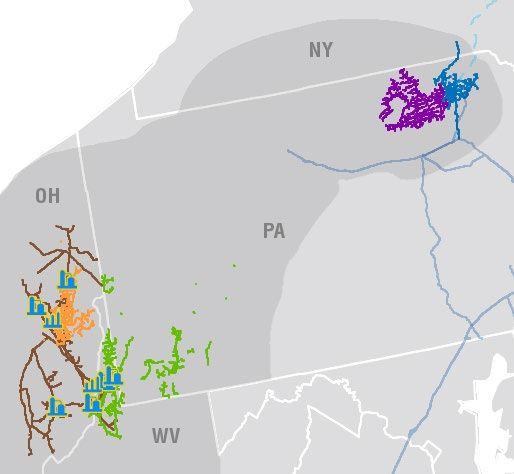
Irreplaceable infrastructure supplying some of the nation’s largest cities

 U.S. Counties Color-coded
 by Population Density vs.
 Williams’ Regulated                                       Northwest
 Natural Gas Pipelines
                                                            Pipeline

 Legend                                                                Transco
 Population per sq. mile
        50 or less
        50-100
        100-200                                                            Gulfstream
        200-300
        300 or more
 Source: Data based off 2012 Census estimates

© 2019 The Williams Companies, Inc. All rights reserved.                     Scotia Howard Weil 47th Annual Energy Conference I March 2019   7
Scotia Howard Weil 47th Annual Energy Conference - WE MAKE ENERGY HAPPEN Alan Armstrong, President and CEO March 27, 2019 - Williams ...
Natural gas will continue to win global market share
NATURAL GAS VS. OIL DEMAND GROWTH (2011 TO 2027); HENRY HUB AND WTI PRICES (MMBTU)
                           $18                                                                                                                                                                                         45%

                                                                                                                                                                                                                                Cumulative Global Demand Growth Since ‘11
                                                                                                             Forecast
                           $16                                                                                                                                                                                         40%

                           $14                                                                                                                                                                                         35%
Oil & Gas Price in MMBtu

                           $12                                                                                                                                                                                         30%

                           $10                                                                                                                                                                                         25%

                           $8                                                                                                                                                                                          20%

                           $6                                                                                                                                                                                          15%

                           $4                                                                                                                                                                                          10%

                           $2                                                                                                                                                                                          5%

                           $0                                                                                                                                                                                          0%

                            Cumulative Global Demand for Nat Gas                    Cumulative Global Demand for Oil                              Henry Hub Forward Curve                          WTI Forward Curve
      Sources: S&P Global Platts Analytics for global demand outlook; U.S. Energy Information Administration for price history; NYMEX for forward curves as of 2-18-19

© 2019 The Williams Companies, Inc. All rights reserved.                                                                                                            Scotia Howard Weil 47th Annual Energy Conference I March 2019                                       8
Robust domestic and global natural gas demand forecasts continue
to rise, reaching 103 Bcf/d by 2021
                                                                                                                                                                      2018 UNITED STATES PRODUCTION
UNITED STATES NATURAL GAS DEMAND BY SECTOR (2014–2021)                                                                                                                      BY REGION IN BCF/D

    120                                                                                                                                                $5

    105                $4.37
                                                                          CAGR ‘17-’18:
                                                                                                                                                                                     Haynesville,
                                                                             11.2%                                                                     $4                                7.6
        90
                                                                                                                                                                            Permian,

                                                                                                                                                            $/MMBTU
        75
Bcf/d

                                                                                        $3.07                                                          $3                     8.4
                                                                        $2.99
                                                                                                                                      $2.64                                                              Northeast,
        60
                                                                                                                                                                                                           27.5
                                                                                                                                                       $2                 All Other,
        45                                                                                                                                                                    8.8

        30
                                                                                                                                                       $1
        15                                                                                                                                                                 Gulf Coast,
                                                                                                                                                                              10.0
                                                                                                                                                                                                             Rockies,
         0                                                                                                                                             $0                                   Mid-               10.4
                       2014                                             2017            2018                                          2021                                                Continent,
                                                                                                                                                                                            10.0

                                                                                                                                        $
        Residential/            Power                      Industrial      Transport/       Mexico                LNG            Henry Hub Gas
        Commercial             Generation                                    Other          Exports              Exports         Annual Average
                                                                                                                                     Price

   Sources: Wood Mackenzie 2H ’18 for demand & production; U.S. Energy Information Administration for price history; NYMEX for forward curves as of 2-18-19

© 2019 The Williams Companies, Inc. All rights reserved.                                                                                                      Scotia Howard Weil 47th Annual Energy Conference I March 2019   9
Natural gas continues to be the preferred fuel type for new power
generation projects in the United States, followed by renewables

                 Power Generation Projects Under Construction                                           Fuel Type of      > Carbon intensity from the U.S. power sector
                                by Fuel Type                                                            Choice             fell by ~25% since 2008 as natural gas
                                                                                                                           displaced other fossil fuels in power
Natural Gas                                                                                                                generation
                                                                                                                          > Capacity added by natural gas-fired power
        Wind                                                                                                               generation projects greater than all other
                                                                                                                           sources combined
        Solar

                                                                                                        Partnering with   > As states make strides toward renewable
    Nuclear                                                                                             Renewables          power, it is vital for natural gas-fired
                                                                                                                            generation to follow as a backup fuel to
         Coal                                                            Full bar represents
                                                                                                                            ensure grid reliability
                                                                         nameplate capacity
                                                                                                                          > Natural gas pipeline  capacity is
                                                                         Dark blue represents
        Other                                                                                                               increasingly valuable as more capacity will
                                                                         expected utilization
                                                                                                                            be needed to support the intermittent
                  0                     5,000              10,000          15,000              20,000                       nature of renewable power
                                               Nameplate Capacity (MW)
  Source: U.S. Energy Information Administration

© 2019 The Williams Companies, Inc. All rights reserved.                                                                       Scotia Howard Weil 47th Annual Energy Conference I March 2019   10
2nd wave of U.S. LNG export projects expected to drive an additional
6 Bcf/d of growth through 2028
              Williams’ Asset Map + Third-party Liquefaction Plants             Sabine Pass           Cove Point                          Corpus Christi
                                                                                Cameron               Elba Island                         Freeport
                                                                                2nd Wave Gulf Coast   Golden Pass                         Woodfibre
                                                                                LNG Canada            Prior 1H '18 Forecast
                                                                                                                                                                      20,000
                                                                                     Forecasted Monthly LNG                                                           18,000
                                                                                         Export Volumes
                                                                                            In MMcf/d                                                                 16,000

                                                                                                        2nd Wave                                                      14,000
                                                               LNG export
                                                           volumes to grow by                                                                                         12,000

                                                            +13.4 Bcf/d                    Forecast
                                                                                                                                                                      10,000
                                                                  along
                                                                                                                                                                      8,000
                                                             Transco states
                                                              through 2028                                                                                            6,000

                                                                                                                                                                      4,000

                                                                                                                                                                      2,000

                                                                                                                                                                      0

 Source: Wood Mackenzie 2H ‘18

© 2019 The Williams Companies, Inc. All rights reserved.                                              Scotia Howard Weil 47th Annual Energy Conference I March 2019       11
Attractive returns on visible growth capital across the portfolio
                          2018                                                    2019                                  2020                              2021                                   2022+
                > Transco – Atlantic Sunrise               > West – North Seattle Lateral Upgrade              > Transco – Hillabee Phase 2      > Transco – Gateway                  > Transco – Leidy South
DEMAND DRIVEN

                  1.7 MMDth/d                                    159 MDth/d                                      206 MDth/d                         65 MDth/d                             580 MDth/d

                > Transco – Garden State                   > Transco – Gulf Connector 475 MDth/d               > Transco – Southeastern          > Transco – Northeast                > Transco – Pursuing 20+
                  180 MMdth/d                                                                                    Trail 296 MDth/d                   Supply Enhancement                    expansion opportunities
                                                           > Transco – St. James Supply 162 MDth/d                                                                                        including “Project 1” from
                                                                                                                                                    400 MDth/d
                                                                                                               > Transco – Emissions                                                      Analyst Day, Emissions
                                                           > Transco – Rivervale S. to Market 190 Mdth/d
                                                                                                                 Reduction Program               > Transco – Emissions
                                                                                                                                                                                          Reduction Program
                                                           > Transco – Rate Case                                                                    Reduction Program
                                                                                                                                                                                      > Gulfstream - Phase VI
                                                                                                                                                                                          78 Mdth/d

                > Atlantic Gulf Deepwater –                > West – DJ Processing Plants – 425 MMcf/d          > Northeast G&P –                  > West – Bluestem NGL               > West – DJ Processing
                  Stampede                                       (Ft. Lupton III – 200 & Keenesburg I – 225)     Susquehanna Gathering              Pipeline                              Plants 225 MMcf/d
                                                                                                                 Expansion 300 MMcf/d                                                     (Milton II)
                > Northeast G&P –                          > West – Wamsutter – High Point, Hansen Lake                                           > West – DJ Processing
                  Susquehanna Gathering                          & Echo Springs G&P Expansions                 > Northeast G&P –                    Plants 225 MMcf/d                 > Northeast G&P – Rich Gas
                  Expansion 700 MMcf/d                                                                           Bradford Gathering                 (Milton I)                            Growth Driving Additional
SUPPLY DRIVEN

                                                           > West – Niobrara – Jackalope Gathering &
                                                                                                                 Expansion 500 MMcf/d                                                     Oak Grove Expansions
                                                                 Bucking Horse Processing 200 MMcf/d
                                                                                                               > West – DJ Processing Plant                                           > Atlantic Gulf Deepwater–
                                                           > Northeast G&P – Rich Gas Growth Driving
                                                                                                                 225 MMcf/d (Keenesburg II)                                               Additional Tie-backs:
                                                                 Oak Grove Expansions & Harrison Hub C3+
                                                                                                                                                                                          Shell Whale, Ballymore,
                                                                 Pipeline
                                                                                                                                                                                          Tigris, Mexico Perdido &
                                                           > Northeast G&P – Susquehanna Gathering                                                                                        others
                                                                 Expansion 500 MMcf/d
                                                           > Atlantic Gulf Deepwater – Shell Appomattox
                                                                 (Norphlet Pipeline option), Lucius-Hadrian
                                                                 North & Buckskin
                                                                                                                                    Green = In-service; Black = In Progress; Blue = Potential/Under Negotiation

      © 2019 The Williams Companies, Inc. All rights reserved.                                                                                         Scotia Howard Weil 47th Annual Energy Conference I March 2019   12
Fully-contracted Transco expansions provide clear visibility into
forecasted revenue
TRANSCO FULLY-CONTRACTED YEAR-END DELIVERY CAPACITY AND FEE-BASED REVENUE
                           20                                                                                                                                                                                                $2.75
                                                   Attractive Returns on Growth Projects                                                                                                                         18.9
                                                                                                                                                                                                    18.3
                                                                                     2017(1)         2018(2)          2019(3)                                                          18.0                                  $2.50
                           18                                                                                                                                             17.3
                                        Growth Capital Placed                                                                                                   16.7
                                                                                      ~$1.4           ~$2.8           ~$0.35                                                                                                 $2.25

                                                                                                                                                                                                                                          Fee Based Revenue, $ Billions
                                        In-service ($ Bln)
                           16
Delivery Capacity MMDt/d

                                        Full-year run-rate                                                                                          14.8
                                                                                     ~$0.24          ~$0.44           ~$0.06                                                                                                 $2.00
                                        Modified EBITDA ($ Bln)
                           14
                                        EBITDA multiple                               ~5.8x           ~6.4x            ~5.8x                                                                                                 $1.75
                                                                                                                                      11.8   11.9
                           12
                                                                                                                 10.6          10.6                                                                                          $1.50
                                                                                  10.0           10.1
                           10
                                                     8.6            8.9                                                                                                                                                      $1.25
                                      8.5
                             8                                                                                                                                                                                               $1.00

                             6                                                                                                                                                                                               $0.75
                                     2008           2009           2010           2011           2012           2013           2014   2015   2016   2017        2018      2019        2020         2021         2022
                                  Year-end Delivery Capacity                           Forecasted Year-end Delivery Capacity                 Fee Revenue ($B)          Targeting $2.5B fully contracted fee revenue by 2022
        (1)                Includes Gulf Trace, Hillabee (Ph. 1), Dalton, NY Bay Expansion, Virginia Southside II, Garden State I
        (2)                Includes Garden State II, Atlantic Sunrise
        (3)                Includes Gulf Connector, St. James Supply, Rivervale South to Market

© 2019 The Williams Companies, Inc. All rights reserved.                                                                                                                  Scotia Howard Weil 47th Annual Energy Conference I March 2019      13
Fully contracted projects supplemented by significant backlog of
additional growth opportunities
 U.S. Map of Williams’ Assets,
 Highlighting Transco Pipeline

                                                             Pursuing 20+ different expansion opportunities
                                                 Transco’s
                                                     20+            Projects supporting new or converted gas
                                              expansion
                                             opportunities
                                                             5      power generation

                                                             6      Projects supporting LNG export

                                                                    Projects supporting industrial, LDCs &
                                                             9      other demand sources

© 2019 The Williams Companies, Inc. All rights reserved.                          Scotia Howard Weil 47th Annual Energy Conference I March 2019   14
Northeast G&P: Large footprint with room to grow
                  UTICA                                                                                                                                                                   SUSQUEHANNA SUPPLY
               SUPPLY HUB(1)                                                                                                                                                                     HUB
  > Cardinal Gathering(3)                                                                                                                                                               > 3.6 Bcf/d of gathering capacity in
  > Flint Gathering                                                                                                                                                                       dry gas
  > Utica East Ohio (UEO)(2)
                                                                                                                                                                                                     BRADFORD
  > 2.7 Bcf/d of gathering capacity in
    dry/rich gas                                                                                                                                                                                    SUPPLY HUB(3)
  > 800 MMcf/d of processing capacity                                                                                                                                                    > 3.7 Bcf/d of gathering capacity in
                                                                                                                                                                                           dry gas
  > 135,000 bpd fractionation capacity                                                                                     PA

                                                                                                                                                                                                      OHIO RIVER
               BLUE RACER                                                                                                                                                                             SUPPLY HUB
               MIDSTREAM(2)                                                                                                                                                              > Ohio Valley Midstream
                                                                                                                                                                                         > Laurel Mtn Midstream
  > 720+ miles of gathering pipeline in
                                                                                                                                                                                         > Marcellus South
    dry/rich gas
  > 800 MMcf/d of processing capacity                                                                                                                                                    > 2.4 Bcf/d of gathering capacity in
                                                                                                                                                                                           dry/rich gas
  > 134,000 bpd fractionation capacity
                                                                                                                                                                                         > 720 MMcf/d processing capacity
  > 260 miles of NGL and condensate
    transport                                                                                                                                                                            > 139,000+ bpd fractionation and de-
                                                                                                                                                                                           ethanization capacity
 (1) Gathering and processing statistics for Utica Supply Hub do not include Blue Racer   (2) Non-operated joint venture        (3) Primarily Cost-of-service based contracts

© 2019 The Williams Companies, Inc. All rights reserved.                                                                                                                        Scotia Howard Weil 47th Annual Energy Conference I March 2019   15
Key producers in prime acreage driving Northeast G&P growth
 1 BCF/D NORTHEAST GATHERING VOLUME GROWTH:                                                                    DRIVERS OF EXPECTED 15% NORTHEAST GATHERING VOLUME
 4Q 2018 vs. 4Q 2017 (BCF/D)                                                                                   CAGR 2018-2021

           8                                                                                                   NORTHEAST PENNSYLVANIA
                                   14%
                                                                                                               >   5+ Bcf/d of incremental gas takeaway capacity on line ‘17-’21
                                  growth
                                                                                                               >   Susquehanna & Bradford sub-plays have lowest average breakevens in the
           6                                         5.6                                                           nation and reserves that could supply ~2.2 years of U.S. gas consumption (1)
                         4.9                                                     11%                           >   Contracted gathering expansion projects increases Susquehanna system
                                                                                                                   capacity to 4.5 Bcf/d by 2020
                                                                                growth
   Bcf/d

           4                                                                                                   >   6 active rigs in dedicated acreage
                                                                                                               >   Largest customers: Cabot Oil & Gas and Chesapeake Energy
                                                                                               2.3
                                                                       2.1
           2                                                                                                   SOUTHWEST MARCELLUS / UTICA
                         4Q 17’

                                                    4Q 18’

                                                                                                                   9+ Bcf/d of incremental gas takeaway capacity on line ‘17-’21
                                                                       4Q 17’

                                                                                               4Q 18’
                                                                                                               >
                                                                                                               >   Southwest Appalachia (2) has an average gas breakeven of $3/mcf (3) and
           0                                                                                                       reserves that could supply +5.1 years of U.S. gas consumption
Supply Area                       Northeast PA                         Southwest Marcellus / Utica             >   Gathering and processing projects contracted with minimum volume
                                                                                                                   commitments
 Williams                SSH                       BSH               ORSH                    USH               >   NGL takeaway capacity constraints lifted; Harrison Hub C3+ Pipeline project
 Franchise
                                                                                                                   in 2019
 Notes: Partially owned system volumes are shown at 100%. Excludes volumes for all non-operated assets.        >   11 active rigs in dedicated acreage; Highest rig count since 2013
 Source: Wood Mackenzie 2H ’18 for takeaway capacity; gas reserves and breakeven detail
 (1) Based on EIA ‘18 annual avg. of US gas consumption; (2) Includes 10 Marcellus & Utica a sub-plays where   >   Largest customers: Encino Energy and Southwestern Energy
 Williams has assets; (3) Wood Mackenzie, Henry Hub, 15% discount rate

 © 2019 The Williams Companies, Inc. All rights reserved.                                                                                        Scotia Howard Weil 47th Annual Energy Conference I March 2019   16
Consolidation of Northeast infrastructure through newly formed JV
 > Transaction with Canadian Pension Plan Investment Board (“CPPIB”) to                               MAP OF ASSETS IN
                                                                                                      NEWLY FORMED JV
       form a $3.8 billion strategic joint venture partnership in the Marcellus
       and Utica Basins
     – Williams consolidates 100% interest in the Utica East Ohio Midstream (“UEO”)
         partnership and assumes operatorship
     – Williams contributes 100% of UEO and Ohio Valley Midstream (“OVM”) to newly formed
         joint venture (JV)
     – CPPIB contributes $1.34 billion for a 35% interest in the JV. Closing is expected to occur
         in the second or third quarter of 2019.
     – Williams net cash flow of $600 million to fund attractive growth capital projects and
         reduce leverage

 > Newly formed JV unlocks opportunities to realize significant operating
       and capital cost synergies
     – Upstream and downstream interests aligned as CPPIB is the sole owner of Encino,
         UEO’s primary producer-customer
     – Creates platform for capital efficiency and additional integration of adjacent systems, both
         third party and WMB-owned
     – O&M savings, G&A savings and capital avoidances

© 2019 The Williams Companies, Inc. All rights reserved.                                                             Scotia Howard Weil 47th Annual Energy Conference I March 2019   17
Gulf of Mexico: Substantial discoveries in close proximity to existing
 assets expected to facilitate long-term growth
                                                                         MS                         AL
                                                                                                                                               7 tiebacks contracted, expecting more
                                                     LA                                                                  FL                    • Shell Appomattox dedication, Norphlet pipeline option
                                                                                                                                                   − Producer expected reserves: 650 MMboe
                             TX
                                                                                                                                  Gulf East        − Producer expected peak production: 175 Mboe/d
                                                                                                                                                   − Target in-service date: Mid 2019
                                                                                                               NORPHLET
                                                                                                                PIPELINE                       • Opportunities include Chevron/Total Ballymore discovery
                                                                                                                                                  3 miles from Blind Faith
                                                                                                                                                   − 0.5-1 Bboe resources. Largest discovery by Total in the GOM.

                                                                                                                                               >1 TCF of gas discoveries within reach of KCC
                                                                                                           APPOMATTOX
                                                                                                                                               • Lucius-Hadrian North, Buckskin dedications
                                                                                                                                                 − Combined additional reserves: 85 Bcf
                                                       TIGRIS                           BALLYMORE                                 Discovery      − Lucius-Hadrian North target-in service date: 1H 2019
                                                                                                                                                   Buckskin target in-service date: 2H 2019
                                                                                     ANCHOR                                                    • Opportunities include discoveries at Anchor, Shenandoah
                                                                                                                                                  and Katmai

 TRION & OTHER
MEXICO PERDIDO
                                                                                                         Gas Gathering                         Only existing Oil & Gas pipelines near active
  DISCOVERIES
                                        WHALE
                                                                                                         Oil Gathering                         Western Gulf exploration
                                                            LUCIUS – HADRIAN NORTH
                                                                                                         Norphlet Pipeline
                                                                                                                                  Gulf West    • Opportunities include Shell Whale (15 miles from existing
                                                                  & BUCKSKIN                             Deepwater Spar                           pipelines), Tigris, and Mexico Perdido discoveries
                                                                                                         Growth Projects                           − Shell Whale: Targeting potential FID in 2020. One of Shell’s largest
                                                                                                         Mexico Deepwater Basin                       finds in the GOM in the past decade, with over 1,400 feet of oil pay.

 Sources: Total 1/31/2018 Ballymore Press Release, Total 9/25/2018 Investor Day-Deepwater Presentation, Shell 1/31/2018 Whale Press Release, Shell 1/31/2019 4Q 2018 Results Presentation

 © 2019 The Williams Companies, Inc. All rights reserved.                                                                                                   Scotia Howard Weil 47th Annual Energy Conference I March 2019   18
Bluestem Pipeline Project:
Strategic partnership connecting Western supplies to Gulf Coast markets
 >     Growing NGL production from West G&P assets driving need for incremental
       connectivity to premium markets
 >     Delivers a long-term infrastructure solution and a platform for growth
     – Forms competitive G&P advantage by entering into a low-cost Transportation & Fractionation
         arrangement with physical access to Mont Belvieu pricing
     – Provides pipeline capacity and flow assurance for West G&P assets
     – Provides opportunity to expand G&P businesses by leveraging downstream NGL assets

 > Generates ability to monetize the Mont Belvieu to Conway spread
     – Maintains Overland Pass Pipeline’s competitive advantage and supports throughput
     – Strategically positions Conway NGL fractionator and storage assets

 >     Provides Williams with firm access to Mont Belvieu
     – Williams to expand OPPL DJ lateral and make improvements at Conway NGL storage facility
     – Williams to build a 188-mile NGL pipeline (Bluestem) from Conway, KS into an interconnect with
         Targa’s Grand Prix NGL Pipeline in Kingfisher, OK
     – Targa to build a 110-mile extension of Grand Prix NGL Pipeline from southern Oklahoma to the
         Bluestem connection, with an initial capacity of ~120,000 BPD
     – Williams has initial option to purchase 20% equity interest in one of Targa’s recently announced
         new fractionation trains 7 or 8 in Mont Belvieu
 >     In-service Date: 1Q 2021
 >     Growth Capital: $350-$400MM, primarily in 2020 (1)
 >     EBITDA multiple: ~6x
 (1) Includes   Bluestem pipeline and related projects; excludes fractionator JV option.

© 2019 The Williams Companies, Inc. All rights reserved.                                                  Scotia Howard Weil 47th Annual Energy Conference I March 2019   19
Fee-based business structure reinforces stability in cash flows
~97% of 2019 Gross Margin from Fee-based Sources
                                                                                 2019 Gross Margin (1)

          3% NGL and Other Commodity                                                                                                            38% Regulated Gas Pipeline
                   Exposure                                                                                                                        Fee-based Revenue
 > Reduced commodity exposure with sale of                                                        3%                                  > Fully contracted demand charge revenue
     Four Corners Area assets                                                                                                         > Attractive positions exposed to growth

                                                                                                                38%
                                                                               36%
        36% Volume-driven Non-regulated                                                                                                  23% Volume-protected Non-regulated
              Fee-based Revenue                                                                                                                  Fee-based Revenue
 > Volume-driven fee-based contracts for
                                                                                                  23%                                 > Mix of capacity payments, Minimum Volume
   gathering, processing, NGL and oil
   transportation and other non-regulated                                                                                                Commitments (MVCs) (2) and Cost of
   services                                                                                                                              Service agreements
 > Some contracts include escalation provisions

(1) Includes our proportional ownership of the gross margin of our equity method investments. Excludes certain regulated revenues, which are related to tracked operating costs.
(2) MVC revenue includes revenue level guaranteed by MVC and excludes any revenue on volumes exceeding MVC. MVC revenue also includes amortization of upfront payments associated with canceled MVCs.

© 2019 The Williams Companies, Inc. All rights reserved.                                                                                      Scotia Howard Weil 47th Annual Energy Conference I March 2019   20
Steady and predictable growth despite assets sales and commodity
price volatility

                                      Assets sales                               Williams Adjusted EPS 2017-2019
           $1.10                        of over
                                         $4.6B                                                                                                                                     High $1.01
           $1.00                Canadian Olefins in ‘16;
                              Geismar in ’17; Four Corners
           $0.90                  & Gulf Pipes in ‘18                                                                                                                          Midpoint $0.89
                                     (Note ~$2B in book
                                      gains are removed
           $0.80                     from Adjusted EPS)                                                                                                                            Low $0.77
 $/Share

                                                                                                                     $0.79
           $0.70

           $0.60
                                                      $0.63
           $0.50

           $0.40

           $0.30

           $0.20
                                                      2017                                                          2018                                             2019 Guidance Ranges
 Note: This slide contains non-GAAP financial measures. A reconciliation of all non-GAAP financial measures used in this presentation to their nearest GAAP financial measures is included at the back of this presentation.

© 2019 The Williams Companies, Inc. All rights reserved.                                                                                                         Scotia Howard Weil 47th Annual Energy Conference I March 2019   21
Reaffirming 2019 guidance metrics
Adjusted EBITDA growth driven by Transco and NE G&P fee-based revenue

  In $Billions except for percentages, ratios and per share amounts
                                                                                                               2019 GUIDANCE

 Net Income                                                                                                   $1.050 - $1.350 Bn

 Adjusted EPS                                                                                                       $0.77 - $1.01

 Adjusted EBITDA                                                                                              $4.850 - $5.150 Bn

 Distributable Cash Flow (DCF)                                                                                $2.900 - $3.300 Bn
                                                                                                                                                                                            March 25, 2019 dividend of
                                                                                                           10-15% annual growth                                                             $0.38/share reflects a 12.5%
 Dividend Growth Rate                                                                                       (annual dividend increases)                                                     annual dividend growth rate
                                                                                                                                                                                            CAGR 2017-2019
 Dividend Coverage Ratio                                                                                                   ~1.7x
                                                                                                                 Midpoint of Guidance

                                                                                                                                                                                            Growth Capex increase driven
 Growth Capex                                                                                                      $2.7 - $2.9 Bn
                                                                                                                                                                                            primarily by carry-forward of
                                                                                        Prior Guidance:                $2.6 Bn                                                              unspent 2018 capital
 Consolidated Debt / EBITDA1                                                                                             < 4.75x

 Note: This slide contains non-GAAP financial measures. A reconciliation of all non-GAAP financial measures used in this presentation to their nearest GAAP comparable financial measures are included at the back of this presentation..
 1 Consolidated Debt / Adjusted EBITDA ratio does not represent leverage ratios measured for WMB credit agreement compliance or leverage ratios as calculated by the major credit ratings agencies. Consolidated debt is net of cash on hand.

© 2019 The Williams Companies, Inc. All rights reserved.                                                                                                                         Scotia Howard Weil 47th Annual Energy Conference I March 2019   22
Williams is a unique large-scale, low-volatility, growing natural gas
infrastructure company with high quality revenues

       •       Volume-driven, natural gas strategy built on irreplaceable asset base handling 30% of low-
               cost U.S. natural gas supplies
       •       Competitively advantaged natural gas infrastructure positions generating abundant organic
               growth opportunities with attractive returns
       •       Stable and predictable fee-based cash flows driving expected 8% Adjusted EBITDA growth
               2018-2019 (1); 5-7% annual Adjusted EBITDA growth longer term beyond 2019
       •       Attractive current dividend yield of 5.6%(1)
       •       12.5% dividend growth CAGR 2017-2019; maintaining strong dividend coverage of ~1.7x for
               reinvestment in growth capital opportunities
       •       Deleveraging through capital discipline, reinvesting cash flow, and ongoing portfolio
               optimization transactions

   (1) Data and estimates per Bloomberg as of February 26, 2019. WMB 2017-2019 growth rates based on midpoint of guidance.
   Note: This slide contains non-GAAP financial measures. A reconciliation of all non-GAAP financial measures used in this presentation to their nearest GAAP comparable financial measures are included at the back of this presentation.

© 2019 The Williams Companies, Inc. All rights reserved.                                                                                                                 Scotia Howard Weil 47th Annual Energy Conference I March 2019       23
Forward Looking Statements

© 2019 The Williams Companies, Inc. All rights reserved.   Scotia Howard Weil 47th Annual Energy Conference I March 2019   24
FORWARD-LOOKING STATEMENTS

Forward-looking statements
 > The reports, filings, and other public announcements of The Williams Companies, Inc. (Williams) may contain or incorporate by reference statements that
     do not directly or exclusively relate to historical facts. Such statements are “forward-looking statements” within the meaning of Section 27A of the
     Securities Act of 1933, as amended (Securities Act), and Section 21E of the Securities Exchange Act of 1934, as amended (Exchange Act). These forward-
     looking statements relate to anticipated financial performance, management’s plans and objectives for future operations, business prospects, outcome of
     regulatory proceedings, market conditions, and other matters. We make these forward-looking statements in reliance on the safe harbor protections
     provided under the Private Securities Litigation Reform Act of 1995. All statements, other than statements of historical facts, included herein that address
     activities, events or developments that we expect, believe or anticipate will exist or may occur in the future, are forward-looking statements. Forward-
     looking statements can be identified by various forms of words such as “anticipates,” “believes,” “seeks,” “could,” “may,” “should,” “continues,”
     “estimates,” “expects,” “forecasts,” “intends,” “might,” “goals,” “objectives,” “targets,” “planned,” “potential,” “projects,” “scheduled,” “will,”
     “assumes,” “guidance,” “outlook,” “in-service date” or other similar expressions. These forward-looking statements are based on management’s beliefs
     and assumptions and on information currently available to management and may include, among others, statements regarding:
      – Financial performance including anticipated leverage and guidance for 2019;
      – Levels of dividends to Williams stockholders;
      – Future credit ratings of Williams, and its affiliates;
      – Amounts and nature of future capital expenditures;
      – Expansion and growth of our business and operations;
      – Expected in-service dates for capital projects;
      – Financial condition and liquidity;
      – Business strategy;
      – Cash flow from operations or results of operations;
      – Seasonality of certain business components;
      – Natural gas and natural gas liquids prices, supply, and demand;
      – Demand for our services.

© 2019 The Williams Companies, Inc. All rights reserved.                                                            Scotia Howard Weil 47th Annual Energy Conference I March 2019   25
FORWARD-LOOKING STATEMENTS

Forward-looking statements (cont’d)
 > Forward-looking statements are based on numerous assumptions, uncertainties and risks that could cause future events or results to be materially
    different from those stated or implied herein. Many of the factors that will determine these results are beyond our ability to control or predict. Specific
    factors that could cause actual results to differ from results contemplated by the forward-looking statements include, among others, the following:
    – Whether we are able to pay current and expected levels of dividends;
    – Whether we will be able to effectively execute our financing plan;
    – Availability of supplies, market demand, and volatility of prices;
    – Inflation, interest rates, and general economic conditions (including future disruptions and volatility in the global credit markets and the impact of these events on customers and suppliers);
    – The strength and financial resources of our competitors and the effects of competition;
    – Whether we are able to successfully identify, evaluate and timely execute our capital projects and other investment opportunities;
    – Our ability to acquire new businesses and assets and successfully integrate those operations and assets into existing businesses as well as successfully expand our facilities, and to
      consummate asset sales on acceptable terms;
    – Development and rate of adoption of alternative energy sources;
    – The impact of operational and developmental hazards and unforeseen interruptions;
    – The impact of existing and future laws and regulations (including but not limited to the Tax Cuts and Jobs Act of 2017), the regulatory environment, environmental liabilities, and litigation, as
      well as our ability to obtain necessary permits and approvals, and achieve favorable rate proceeding outcomes;
    – Our costs and funding obligations for defined benefit pension plans and other postretirement benefit plans;
    – Changes in maintenance and construction costs, as well as our ability to obtain sufficient construction-related inputs including skilled labor;
    – Changes in the current geopolitical situation;
    – Our exposure to the credit risk of our customers and counterparties;
    – Risks related to financing, including restrictions stemming from debt agreements, future changes in credit ratings as determined by nationally-recognized credit rating agencies and the
      availability and cost of capital;
    – The amount of cash distributions from and capital requirements of our investments and joint ventures in which we participate;

© 2019 The Williams Companies, Inc. All rights reserved.                                                                                        Scotia Howard Weil 47th Annual Energy Conference I March 2019   26
FORWARD-LOOKING STATEMENTS

Forward-looking statements (cont’d)
    – Risks associated with weather and natural phenomena, including climate conditions and physical damage to our facilities;
    – Acts of terrorism, cybersecurity incidents, and related disruptions;
    – Additional risks described in our filings with the Securities and Exchange Commission (SEC).
 > Given the uncertainties and risk factors that could cause our actual results to differ materially from those contained in any forward-looking statement, we
    caution investors not to unduly rely on our forward-looking statements. We disclaim any obligations to and do not intend to update the above list or
    announce publicly the result of any revisions to any of the forward-looking statements to reflect future events or developments.
 > In addition to causing our actual results to differ, the factors listed above may cause our intentions to change from those statements of intention set forth
    herein. Such changes in our intentions may also cause our results to differ. We may change our intentions, at any time and without notice, based upon
    changes in such factors, our assumptions, or otherwise.
 > Because forward-looking statements involve risks and uncertainties, we caution that there are important factors, in addition to those listed above, that may
    cause actual results to differ materially from those contained in the forward-looking statements. For a detailed discussion of those factors, see Part I, Item
    1A. Risk Factors in our Annual Report on Form 10-K filed with the SEC on February 21, 2019 and in Part II, Item 1A. Risk Factors in our Quarterly Reports
    on Form 10-Q.

© 2019 The Williams Companies, Inc. All rights reserved.                                                                         Scotia Howard Weil 47th Annual Energy Conference I March 2019   27
Non-GAAP Reconciliations

© 2019 The Williams Companies, Inc. All rights reserved.   Scotia Howard Weil 47th Annual Energy Conference I March 2019   28
NON-GAAP RECONCILIATIONS

Non-GAAP Disclaimer
 > This presentation may include certain financial measures – adjusted EBITDA, adjusted income (“earnings”), adjusted earnings per share, distributable
     cash flow and dividend coverage ratio – that are non-GAAP financial measures as defined under the rules of the Securities and Exchange Commission.

 > Our segment performance measure, modified EBITDA is defined as net income (loss) before income (loss) from discontinued operations, income tax
   expense, net interest expense, equity earnings from equity-method investments, other net investing income, remeasurement gain on equity-method
   investment, impairment of equity investments and goodwill, depreciation and amortization expense, and accretion expense associated with asset
   retirement obligations for nonregulated operations. We also add our proportional ownership share (based on ownership interest) of modified EBITDA of
   equity-method investments.

 > Adjusted EBITDA further excludes items of income or loss that we characterize as unrepresentative of our ongoing operations. Management believes this
   measure provides investors meaningful insight into results from ongoing operations.

 > Distributable cash flow is defined as adjusted EBITDA less maintenance capital expenditures, cash portion of net interest expense, income attributable to
   noncontrolling interests and cash income taxes, and certain other adjustments that management believes affects the comparability of results. Adjustments
   for maintenance capital expenditures and cash portion of interest expense include our proportionate share of these items of our equity-method
   investments. We also calculate the ratio of distributable cash flow to the total cash dividends paid (dividend coverage ratio). This measure reflects
   Williams’ distributable cash flow relative to its actual cash dividends paid.

 > This presentation is accompanied by a reconciliation of these non-GAAP financial measures to their nearest GAAP financial measures. Management uses
   these financial measures because they are accepted financial indicators used by investors to compare company performance. In addition, management
   believes that these measures provide investors an enhanced perspective of the operating performance of assets and the cash that the business is
   generating.

 > Neither adjusted EBITDA, adjusted income, nor distributable cash flow are intended to represent cash flows for the period, nor are they presented as an
   alternative to net income or cash flow from operations. They should not be considered in isolation or as substitutes for a measure of performance
   prepared in accordance with United States generally accepted accounting principles.

© 2019 The Williams Companies, Inc. All rights reserved.                                                        Scotia Howard Weil 47th Annual Energy Conference I March 2019   29
NON-GAAP RECONCILIATIONS

Reconciliation of Income (Loss) Attributable to The Williams
Companies, Inc. to Adjusted Income
                                                                                                                                                          2017                                                          2018
                                             (Dollars in millions, except per-share amounts)                                     1st Qtr     2nd Qtr     3rd Qtr     4th Qtr     Year         1st Qtr     2nd Qtr     3rd Qtr      4th Qtr       Year

                                             Income (loss) attributable to The Williams Companies, Inc. available to
                                                common stockholders                                                          $      373 $        81 $        33 $      1,687 $   2,174    $      152 $       135 $        129 $       (572) $     (156)

                                             Income (loss) - diluted earnings (loss) per common share                        $       .45 $       .10 $       .04 $      2.03 $    2.62    $       .18 $       .16 $        .13 $       (.47) $    (.16)
                                             Adjustments:
                                             Northeast G&P
                                              Share of impairment at equity-method investments                               $        — $        — $          1 $         — $        1    $        — $        — $          — $          — $         —
                                              Impairment of certain assets                                                            —          —          121           —        121             —          —            —            —           —
                                              Ad valorem obligation timing adjustment                                                 —          —            7           —          7             —          —            —            —           —
                                              Settlement charge from pension early payout program                                     —          —           —            7          7             —          —            —            4           4
                                              Organizational realignment-related costs                                                1          1            2           —          4             —          —            —            —           —
                                              Total Northeast G&P adjustments                                                         1          1          131           7        140             —          —            —            4           4
                                             Atlantic-Gulf
                                               Constitution Pipeline project development costs                                        2          6           4            4         16              2           1          1            —            4
                                               Settlement charge from pension early payout program                                    —          —           —           15         15             —           —           —            7            7
                                               Regulatory adjustments resulting from Tax Reform                                       —          —           —          493        493             11         (20)         —            —           (9)
                                               Benefit of regulatory asset associated with increase in Transco’s estimated
                                                deferred state income tax rate following WPZ Merger                                   —          —           —            —         —              —          —             (3)         —           (3)
                                               Share of regulatory charges resulting from Tax Reform for equity-method
                                                investments                                                                           —          —           —           11         11              2          —           —            —            2
                                               Organizational realignment-related costs                                               1          2            2           1          6             —           —           —            —           —
                                               Gain on sale of certain Gulf Coast pipeline assets                                     —          —           —           —          —              —           —           —           (81)        (81)
                                               (Gain) loss on asset retirement                                                        —          —           (5)          5         —              —           —          (10)          (2)        (12)
                                               Total Atlantic-Gulf adjustments                                                        3          8            1         529        541             15         (19)        (12)         (76)        (92)
                                             West
                                              Estimated minimum volume commitments                                                    15         15           18        (48)        —              —          —            —            —           —
                                              Impairment of certain assets                                                            —          —         1,021          9      1,030             —          —            —         1,849       1,849
                                              Settlement charge from pension early payout program                                     —          —            —          13         13             —          —            —             6           6
                                              Organizational realignment-related costs                                                 2          3            2          1          8             —          —            —            —           —
                                              Regulatory adjustments resulting from Tax Reform                                        —          —            —         220        220             (7)        —            —            —           (7)
                                               Charge for regulatory liability associated with the decrease in Northwest
                                                Pipeline’s estimated deferred state income tax rates following WPZ
                                                Merger                                                                                —          —            —          —          —              —          —            12           —           12
                                               Gain on sale of Four Corners assets                                                    —          —            —          —          —              —          —            —          (591)       (591)
                                               Gains from contract settlements and terminations                                      (13)        (2)          —          —         (15)            —          —            —            —           —
                                               Total West adjustments                                                                  4         16        1,041        195      1,256             (7)        —            12        1,264       1,269

© 2019 The Williams Companies, Inc. All rights reserved.                                                                                                                                                                Scotia Howard Weil 47th Annual Energy Conference I March 2019   30
NON-GAAP RECONCILIATIONS

Reconciliation of Income (Loss) Attributable to The Williams
Companies, Inc. to Adjusted Income (con’t)
                                                                                                                                                                                        2017                                                                                       2018
                           (Dollars in millions, except per-share amounts)                                                                         1st Qtr          2nd Qtr           3rd Qtr          4th Qtr            Year               1st Qtr          2nd Qtr            3rd Qtr             4th Qtr             Year
                           Other
                            (Gain) loss related to Canada disposition                                                                                     (2)               (1)              4                  5               6                   —                —                   —                   —                 —
                            Expenses associated with strategic asset monetizations                                                                         1                 4              —                  —                5                   —                —                   —                   —                 —
                            Geismar Incident adjustments                                                                                                  (9)                2               8                 (1)             —                    —                —                   —                   —                 —
                            Gain on sale of Geismar Interest                                                                                              —                 —           (1,095)                —           (1,095)                  —                —                   —                   —                 —
                            Gain on sale of RGP Splitter                                                                                                  —                (12)             —                  —              (12)                  —                —                   —                   —                 —
                            Accrual for loss contingency                                                                                                   9                —               —                  —                9                   —                —                   —                   —                 —
                            Severance and related costs                                                                                                    9                 4               5                  4              22                   —                —                   —                   —                 —
                            ACMP Merger and transition costs                                                                                              —                  4               3                  4              11                   —                —                   —                   —                 —
                            Expenses associated with Financial Repositioning                                                                               8                 2              —                  —               10                   —                —                   —                   —                 —
                            (Gain) loss on early retirement of debt                                                                                      (30)               —                3                 —              (27)                  7                —                   —                   —                  7
                            Impairment of certain assets                                                                                                  —                 23              68                 —               91                   —                66                  —                   —                 66
                            Expenses associated with strategic alternatives                                                                                1                 3               5                 —                9                   —                —                   —                   —                 —
                            Settlement charge from pension early payout program                                                                           —                 —               —                  36              36                   —                —                   —                   5                  5
                            Regulatory adjustments resulting from Tax Reform                                                                              —                 —               —                  63              63                   —                 1                  —                   —                  1
                            Benefit of regulatory assets associated with increase in Transco’s estimated deferred state
                              income tax rate following WPZ Merger                                                                                        —                 —                —                 —                 —                  —                 —                 (45)                 —                (45)
                            WPZ Merger costs                                                                                                              —                 —                —                 —                 —                  —                 4                  15                   1                20
                            Gain on sale of certain Gulf Coast pipeline systems                                                                           —                 —                —                 —                 —                  —                 —                  —                  (20)              (20)
                            Charitable contribution of preferred stock to Williams Foundation                                                             —                 —                —                 —                 —                  —                 —                  35                  —                 35
                            Total Other adjustments                                                                                                      (13)               29             (999)             111             (872)                   7               71                    5               (14)               69
                           Adjustments included in Modified EBITDA                                                                                        (5)               54              174              842            1,065                   15               52                    5             1,178             1,250

                           Adjustments below Modified EBITDA
                            Gain on disposition of equity-method investment                                                                             (269)               —                —                 —              (269)                 —                 —                  —                   —                 —
                            Accelerated depreciation by equity-method investments                                                                         —                 —                —                 9                 9                  —                 —                  —                   —                 —

                             Change in depreciable life associated with organizational realignment                                                        (7)               —                —                —                 (7)                 —                —                   —                  —                 —
                             Gain on deconsolidation of Jackalope interest                                                                                —                 —                —                —                 —                   —               (62)                 —                  —                (62)
                             Investment impairment                                                                                                        —                 —                —                —                 —                   —                —                   —                  32                32
                             Gain on deconsolidation of certain Permian assets                                                                            —                 —                —                —                 —                   —                —                   —                (141)             (141)
                             Allocation of adjustments to noncontrolling interests                                                                        77               (10)             (28)            (199)             (160)                 (5)              21                  —                  —                 16
                                                                                                                                                        (199)              (10)             (28)            (190)             (427)                 (5)             (41)                 —                (109)             (155)
                           Total adjustments                                                                                                            (204)               44              146              652               638                  10               11                   5              1,069             1,095
                           Less tax effect for above items                                                                                                77               (17)             (55)            (246)             (241)                 (3)              (3)                 (1)              (267)             (274)
                           Adjustments for tax-related items (1)                                                                                        (127)               —                —            (1,923)          (2,050)                  —                 —                 110                  —               110
                           Adjusted income available to common stockholders                                                                    $       119      $        108      $       124      $        170      $       521         $       159      $        143      $         243       $         230      $        775
                           Adjusted diluted earnings per common share (2)                                                                      $        .14     $         .13     $        .15     $         .20     $        .63        $        .19     $         .17     $          .24      $          .19     $         .79
                           Weighted-average shares - diluted (thousands)                                                                           826,476           828,575          829,368           829,607          828,518             830,197           830,107          1,026,504           1,212,822           976,097

                           (1)   The first quarter of 2017 includes an unfavorable adjustment related to the release of a valuation allowance. The fourth quarter of 2017 includes an unfavorable adjustment to reverse the tax benefit associated with remeasuring our deferred tax balances at a lower corporate rate resulting from
                                 Tax Reform. The third quarter of 2018 reflects tax adjustments driven by the WPZ Merger, primarily a valuation allowance for foreign tax credits.
                           (2)   The sum of earnings per share for the quarters may not equal the total earnings per share for the year due to changes in the weighted-average number of common shares outstanding.

© 2019 The Williams Companies, Inc. All rights reserved.                                                                                                                                                                                                         Scotia Howard Weil 47th Annual Energy Conference I March 2019           31
NON-GAAP RECONCILIATIONS

Reconciliation of Net Income to Adjusted Net Income

                                                           (Dollars in millions)                                                         2018

                                                           Net Income                                                                $     193

                                                           Adjustments (1)
                                                                 Total adjustments                                                   $    1,095

                                                                  Allocation of adjustments to noncontrolling interests                     (16)
                                                                  Tax effect for above items                                              (274)

                                                                  Adjustments for tax-related items                                         110

                                                           Adjusted Net Income                                                       $    1,108

                                                           (1) Adjustments per the accompanying Reconciliation of Income (Loss) Attributable to
                                                           The Williams Companies, Inc. to Adjusted Income

© 2019 The Williams Companies, Inc. All rights reserved.                                                                                           Scotia Howard Weil 47th Annual Energy Conference I March 2019   32
NON-GAAP RECONCILIATIONS

Reconciliation of Income (Loss) Attributable to The Williams
Companies, Inc. to Adjusted Income (con’t)
                                                                                                                                                        GUI DANCE RANGES
                                                                                                                                              2018                                       2019
                                                                                                                                           Midpt. High                         Low       Midpt.     High
                                          (Dol l a rs i n mi l l i ons , except per-s ha re a mounts )

                                          Net income (loss)                                                                                 $1,385      $1,460                 $1,050    $1,200     $1,350
                                          Less: Net income (loss) attributable to noncontrolling interests                                      325         345                  115        115        115
                                          Net income (loss) attributable to The Williams Companies, Inc.                                     1,060        1,115                  935      1,085      1,235

                                          Adjustments 1:
                                          Adjustments included in Modified EBITDA 2                                                            (521)        (521)                    -         -           -
                                          Adjustments below Modified EBITDA                                                                     (62)         (62)                    -         -           -
                                          Allocation of adjustments to noncontrolling interests                                                  16           16                     -         -           -
                                          Total adjustments                                                                                    (567)        (567)                    -         -           -
                                          Less tax effect for above items                                                                       141         141                      -         -           -
                                          Adjustments for tax-related items 3                                                                   110         110                      -         -           -

                                          Adjusted income available to common stockholders                                                    $744         $799                 $935     $1,085     $1,235
                                          Adjusted diluted earnings per common share                                                         $0.76        $0.82                 $0.77     $0.89      $1.01
                                          Weighted-average shares - diluted (millions)                                                          976         976                 1,217     1,217      1,217

                                          Note: Reconci l i a ti on s hown wi th a cqui s i ti on of WPZ compl eted on Augus t 10, 2018
                                          (1) A deta i l ed l i s t of a djus tments i s i ncl uded i n thi s pres enta ti on
                                          (2) Pri ma ri l y a $591 mi l l i on ga i n on the s a l e of Four Corners a s s ets
                                          (3) Refl ects ta x a djus tments dri ven by the WPZ Merger, pri ma ri l y a va l ua ti on a l l owa nce for forei gn ta x credi ts

© 2019 The Williams Companies, Inc. All rights reserved.                                                                                                                          Scotia Howard Weil 47th Annual Energy Conference I March 2019   33
NON-GAAP RECONCILIATIONS

Reconciliation of Income (Loss) Attributable to The Williams
Companies, Inc. to Adjusted Income (con’t)
                                                                                              2018 Guidance                                                                                            2018 Guidance
             (Dollars in millions, except per-share amounts)                                Midpoint   High         Adjustments (continued)                                                          Midpoint   High
             Income (loss) attributable to The Williams Companies, Inc. available to                                Other
             common stockholders                                                               $1,060    $1,115       (Gain) loss on early retirement of debt                                                   7             7
                                                                                                                      Impairment of certain assets                                                             66            66
             Income (loss) - diluted earnings (loss) per common share                           $1.09     $1.14
                                                                                                                      Regulatory adjustments resulting from Tax Reform                                          1             1
             Adjustments:                                                                                             Benefit of regulatory assets associated with increase in Transco’s estimated
             Northeast G&P                                                                                            deferred state income tax rate following WPZ Merger                                     (45)          (45)
                Total Northeast G&P adjustments                                                   —           —       WPZ Merger costs                                                                         19            19
             Atlantic-Gulf                                                                                            Charitable contribution of preferred stock to Williams Foundation                        35            35
                Constitution Pipeline project development costs                                    4          4       Total Other adjustments                                                                  83            83
                Regulatory adjustments resulting from Tax Reform                                   (9)        (9)   Adjustments included in Modified EBITDA                                                  (521)         (521)
                Benefit of regulatory asset associated with increase in Transco’s
                                                                                                                    Adjustments below Modified EBITDA
                estimated deferred state income tax rate following WPZ Merger                      (3)        (3)
                Share of regulatory charges resulting from Tax Reform for equity-method                               Gain on deconsolidation of Jackalope interest                                           (62)          (62)
                investments                                                                        2          2       Allocation of adjustments to noncontrolling interests                                    16            16
                (Gain) loss on asset retirement                                                   (10)      (10)                                                                                              (46)          (46)
                Total Atlantic-Gulf adjustments                                                   (16)      (16)    Total adjustments                                                                        (567)         (567)
             West                                                                                                   Less tax effect for above items                                                           141           141
                                                                                                                                                        (1)
                Gain on Sale of Four Corners assets                                             (593)     (593)     Adjustments for tax-related items                                                         110           110
                Regulatory adjustments resulting from Tax Reform                                   (7)        (7)
                                                                                                                    Adjusted income available to common stockholders                                        $744          $799
                Charge for regulatory liability associated with the decrease in Northwest
                Pipeline’s estimated deferred state income tax rates following WPZ                12          12    Adjusted diluted earnings per common share                                             $0.76         $0.82
                Total West adjustments                                                          (588)     (588)     Weighted-average shares - diluted (millions)                                              976           976

                                                                                                                    (1) Reflects tax adjustments driven by the WPZ Merger, primarily a valuation allowance for foreign tax credit
 Note: Reconciliation shown with acquisition of WPZ completed on August 10, 2018

© 2019 The Williams Companies, Inc. All rights reserved.                                                                                                           Scotia Howard Weil 47th Annual Energy Conference I March 2019    34
NON-GAAP RECONCILIATIONS

Reconciliation of Net Income to Modified EBITDA,
Adjusted EBITDA and Distributable Cash Flow
                                                                                                                                                                     2017                                                                                            2018
       (Dollars in millions, except coverage ratios)                                                                        1st Qtr             2nd Qtr             3rd Qtr             4th Qtr             Year              1st Qtr             2nd Qtr            3rd Qtr             4th Qtr             Year

          Net income (loss)                                                                                           $            569      $          193      $         125       $       1,622       $      2,509      $         270       $         269      $          200      $        (546) $               193
             Provision (benefit) for income taxes                                                                                     37                  65                  24            (2,100)           (1,974)                   55                  52              190               (159)                 138
             Interest expense                                                                                                      280                 271                267                 265              1,083                273                 275                 270                294             1,112
             Equity (earnings) losses                                                                                             (107)               (125)              (115)                (87)             (434)                (82)                 (92)             (105)               (117)             (396)
             Impairment of equity-method investments                                                                                  —                   —                   —                   —                 —                   —                   —                  —                   32                32
             Other investing (income) loss - net                                                                                  (272)                   (2)                 (4)                 (4)          (282)                    (4)              (68)                  (2)            (145)             (219)

             Proportional Modified EBITDA of equity-method investments                                                             194                 215                202                 184                  795              169                 178                 205                218                  770
             Depreciation and amortization expenses                                                                                442                 433                433                 428              1,736                431                 434                 425                435             1,725

             Accretion for asset retirement obligations associated with nonregulated operations                                        7                   9                   7                  10                33                   8                  10                 8                    7                33
          Modified EBITDA                                                                                                        1,150               1,059                939                 318              3,466              1,120                1,058             1,191                     19          3,388
          EBITDA adjustments                                                                                                          (5)                 54              174                 842              1,065                    15                  52                 5             1,178             1,250
             Adjusted EBITDA                                                                                                     1,145               1,113              1,113               1,160              4,531              1,135                1,110             1,196               1,197             4,638

          Maintenance capital expenditures (1)                                                                                     (58)               (105)              (143)               (165)             (471)               (110)               (160)              (138)               (122)             (530)
          Preferred dividends                                                                                                         —                   —                   —                   —                 —                   —                   —                  —                   (1)               (1)
          Net interest expense - cash portion (2) (5)                                                                             (289)               (280)              (271)               (271)            (1,111)              (276)               (279)              (274)               (299)            (1,128)
          Cash taxes                                                                                                                  (5)                 (1)               (11)              (11)                 (28)                 (1)              (10)                  (1)                  1               (11)
          Income attributable to noncontrolling interests (3)                                                                      (27)                (32)                 (27)              (27)             (113)                (25)                 (24)               (19)               (28)                 (96)
          WPZ restricted stock unit non-cash compensation                                                                              2                   1                   1                   1                 5                  —                   —                  —                   —                 —

          Amortization of deferred revenue associated with certain 2016 contract restructurings (4)                                (58)                (58)                 (59)              (58)             (233)                    —                   —                  —                   —                 —
          Distributable cash flow (5)                                                                                 $            710      $          638      $         603       $         629       $      2,580      $         723       $         637      $          764      $         748       $     2,872

          Total cash distributed (6)                                                                                  $            400      $          400      $         400       $         401       $      1,601      $         438       $         443      $          412      $         411       $     1,704

          Coverage ratios:
          Distributable cash flow divided by Total cash distributed (5)                                                           1.78                1.60               1.51                1.57                  1.61            1.65                 1.44              1.85                1.82              1.69
          Net income (loss) divided by Total cash distributed                                                                     1.42                0.48               0.31                4.04                  1.57            0.62                 0.61              0.49                (1.33)            0.11

       (1) Includes proportionate share of maintenance capital expenditures of equity investments.
       (2) Includes proportionate share of interest expense of equity investments.
       (3) Excludes allocable share of certain EBITDA adjustments.
       (4) Beginning first quarter 2018, as a result of the extended deferred revenue amortization period under the new GAAP revenue standard, we have discontinued the adjustment associated with these 2016 contract restructuring payments. For each quarter of 2018, the adjustments would have been $32
           million, $31 million, $32 million, and $33 million, respectively.
       (5) The first, second, and third quarters of 2018 have been corrected to increase amounts reported as Net interest expense - cash portion by $3 million, $4 million, and $4 million, respectively.
       (6) Includes cash dividends paid each quarter by WMB, as well as the public unitholders share of distributions declared by WPZ for the 2017 periods and the first two quarters of 2018.
© 2019 The Williams Companies, Inc. All rights reserved.                                                                                                                                                                            Scotia Howard Weil 47th Annual Energy Conference I March 2019                          35
NON-GAAP RECONCILIATIONS

Reconciliation of Modified EBITDA to Non-GAAP Adjusted EBITDA

                                                                                                                                        2017                                                         2018
                                                           (Dollars in millions)                                1st Qtr    2nd Qtr     3rd Qtr    4th Qtr      Year           1st Qtr    2nd Qtr    3rd Qtr     4th Qtr       Year

                                                             Northeast G&P                                  $      226 $      247 $       115 $       231 $       819     $      250 $      255 $       281 $       300 $ 1,086
                                                             Atlantic-Gulf                                         450        454         430          (96)     1,238            451        475         492         605       2,023
                                                             West                                                  385        356        (615)        286         412            413        389         412        (906)        308
                                                             Other                                                  89           2      1,009        (103)        997               6        (61)          6         20         (29)
                                                               Total Modified EBITDA                        $ 1,150 $ 1,059 $             939 $       318 $ 3,466         $ 1,120 $ 1,058 $ 1,191 $                  19 $ 3,388

                                                           Adjustments included in Modified
                                                             EBITDA (1):

                                                             Northeast G&P                                  $         1 $        1 $      131 $          7 $      140     $       — $        — $         — $           4 $         4
                                                             Atlantic-Gulf                                            3          8           1        529         541             15         (19)       (12)        (76)        (92)
                                                             West                                                     4        16       1,041         195       1,256              (7)       —           12       1,264       1,269
                                                             Other                                                  (13)       29        (999)        111        (872)              7        71            5        (14)         69
                                                               Total Adjustments included in
                                                                 Modified EBITDA                            $        (5) $     54 $       174 $       842 $ 1,065         $       15 $       52 $          5 $ 1,178 $ 1,250

                                                           Adjusted EBITDA:

                                                             Northeast G&P                                  $      227 $      248 $       246 $       238 $       959     $      250 $      255 $       281 $       304 $ 1,090
                                                             Atlantic-Gulf                                         453        462         431         433       1,779            466        456         480         529       1,931
                                                             West                                                  389        372         426         481       1,668            406        389         424         358       1,577
                                                             Other                                                  76         31           10           8        125             13         10          11            6         40
                                                               Total Adjusted EBITDA                        $ 1,145 $ 1,113 $ 1,113 $ 1,160 $ 4,531                       $ 1,135 $ 1,110 $ 1,196 $ 1,197 $ 4,638

                                                           (1) Adjustments by segment are detailed in the "Reconciliation of Income (Loss) Attributable to The Williams Companies, Inc. to Adjusted Income," which is also included in
                                                               these materials.

© 2019 The Williams Companies, Inc. All rights reserved.                                                                                                                                                           Scotia Howard Weil 47th Annual Energy Conference I March 2019   36
NON-GAAP RECONCILIATIONS

Reconciliation of Net Income to Modified EBITDA and Non-GAAP
Adjusted EBITDA

                                                                                                                      2018                          2019
                                     ($ in billions)                                                                 Guidance                      Guidance
                                                                                                              Low      Mid       High       Low      Mid         High
                                     Net income (loss)                                                       $0.975 $1.075      $1.175     $1.050 $1.200        $1.350
                                      Provision (benefit) for income taxes                                         
                                      Interest expense                                                             
                                      Equity (earnings) losses                                                     
                                      Proportional Modified EBITDA of equity-method investments                    
                                      Depreciation and amortization expenses and accretion expense
                                         associated with asset retirement obligations for nonregulated operatio        
                                     Modified EBITDA                                                           $4.435 $4.535 $4.635        $4.850 $5.000 $5.150

                                     Adjustments included in Modified EBITDA:
                                      Constitution Pipeline project development costs                                   -          -         -
                                      (Gain) loss on early retirement of debt                                           -          -         -
                                      Regulatory charges resulting from Tax Reform                                      -          -         -
                                      Share of regulatory charges resulting from Tax Reform
                                         for equity-method investments                                                  -          -         -
                                     Total Adjustments included in Modified EBITDA                                      -          -         -

                                     Adjusted EBITDA                                                         $4.450 $4.550 $4.650          $4.850 $5.000 $5.150

© 2019 The Williams Companies, Inc. All rights reserved.                                                                                  Scotia Howard Weil 47th Annual Energy Conference I March 2019   37
You can also read