Working Paper Series Do bank insiders impede equity issuances?
←
→
Page content transcription
If your browser does not render page correctly, please read the page content below

Working Paper Series
 Martin Goetz, Luc Laeven, Ross Levine Do bank insiders impede
 equity issuances?

 No 2511 / January 2021

Disclaimer: This paper should not be reported as representing the views of the European Central Bank
(ECB). The views expressed are those of the authors and do not necessarily reflect those of the ECB.
Abstract: We evaluate the role of insider ownership in shaping banks’ equity issuances in
response to the global financial crisis. We construct a unique dataset on the ownership
structure of U.S. banks and their equity issuances and discover that greater insider ownership
leads to less equity issuances. Several tests are consistent with the view that bank insiders are
reluctant to reduce their private benefits of control by diluting their ownership through equity
issuances. Given the connection between bank equity and lending, the results stress that
ownership structure can shape the resilience of banks—and hence the entire economy—to
aggregate shocks.

Keywords: Ownership Structure, Equity Issuances, Banking, Financial Crisis, Regulation
JEL Codes: G32; G21; G28

ECB Working Paper Series No 2511 / January 2021 1
Executive summary

 Banks with more equity tend to lend more, create more liquidity, and have higher
probabilities of surviving crises. Moreover, adverse shocks to bank equity predict

contractions in lending and aggregate output, and lower bank equity ratios slow recoveries

from crises. The strong linkages between bank equity, bank lending, and economic activity

raise a critical question: what factors shape the differing degrees to which banks issue new

stock to replenish bank equity in response to crises?

 In this paper, we address a debate concerning the impact of bank ownership structure

on the degree to which banks sell stock to replenish equity following adverse shocks. In the

presence of large private benefits of control, a bank’s controlling owners may resist new

stock issuances to protect those rents. From this “dilution reluctance” perspective, greater

insider ownership will reduce stock sales, potentially making the economy less resilient to

aggregate shocks. In contrast, other research suggests that banks with greater insider

ownership can more effectively coordinate the actions of diverse stakeholders with differing

interests during crises, allowing such banks to sell more stock than banks with less insider

ownership. The overall impact of insider ownership on stock sales in times of crisis,

therefore, is an open empirical question.

 We evaluate the role of insider ownership in shaping U.S. banks’ sale of stock in

response to the 2008 global financial crisis, which adversely affected bank valuations and put

pressure on banks to raise new capital. We compile a unique database on the ownership

structure and equity issuances of private and public banks. We hand-collect data on the

ownership of 566 U.S. bank holding companies (BHCs), where we focus on the role of

insider owners, i.e., bank directors and executives. We define “insider ownership” as the

proportion of the BHC’s stock owned by bank directors and executives. We also calculate

“common stock sales” for each BHC as the total amount of funds raised through common

stock sales as a proportion of bank equity. Using these data, we explore how insider

ownership shaped banks’ common stock issuances following the onset of the financial crisis.

ECB Working Paper Series No 2511 / January 2021 2
We discover that greater insider ownership is associated with less common stock sales

following the onset of the crisis. The estimates suggest an economically large relationship.

For example, consider two otherwise identical banks, where the “high” insider ownership

BHC has one standard deviation greater insider ownership than the “low” BHC. The

estimates suggest that the “high” insider ownership bank would have common stock sales as

a proportion of bank equity that are about 22% higher than “low” insider ownership bank.

The results are robust to using several statistical strategies for addressing concerns about

reverse causality and consistent with the idea that insiders are reluctant to dilute control rights

by selling common stock.

 We also show that the relationship between ownership structure and equity issuances

varies across banks in a manner that is consistent with the “dilution reluctance” view. First,

we examine whether banks that provide greater private benefits to insiders are also banks that

are more reluctant to dilute insider control through equity issuances following the onset of the

crisis. To measure the private benefits of control, we compute (a) the share of loans to bank

insiders and (b) the level of bank opacity, since greater opacity hinders effective governance

by non-insiders, offering greater private benefits of control. Consistent with this private

benefits view, the impact of ownership structure on equity issuances is larger among banks

that offer more private benefits to insiders.

 Second, we examine whether insider owners are more reluctant to dilute their control

rights through equity issuances when the expected positive impact of issuances on the banks

is smaller. Specifically, as the expected benefits from selling new shares in the form of

increased bank stability and market valuations falls, insiders will become increasingly

reluctant to issue stock and sacrifice private benefits of control. According to this

perspective, the insider owners of banks that are harder hit by shocks and hence less likely to

benefit from equity injections will be more reluctant to sell stock. We use two measures of

the degree to which each BHC is adversely affected by the financial crisis. We use

information on BHCs’ branch networks and determine BHCs’ exposure to declines in

housing prices during the financial crisis. The second measure uses information on BHCs’

ECB Working Paper Series No 2511 / January 2021 3
investment in mortgage-backed securities, as the crisis induced market participants to view

these assets as “toxic” and value them accordingly.

 We again find evidence consistent with the dilution reluctance view: bank insiders are

reluctant to reduce their private benefits of control by issuing equity, especially when the

positive effects of stock sales are likely to have smaller positive effects on bank valuations.

The negative impact of insider ownership on stock sales is stronger among banks more

adversely affected by the financial crisis.

 Our study speaks to recent policy reforms to bank regulations that have increasingly

emphasized the quality of bank capital not just its quantity. For example, Basel III introduced

a minimum common equity requirement with the goal of ensuring that banks not have a

sufficient quantity of capital also have sufficient amount of the most efficient and effective

loss-absorbing liability: common equity. These regulatory changes, however, have not yet

considered ownership structure. Our work stresses the importance of ownership structure,

finding that ownership structure shapes common equity issuances in response to a crisis and

hence affects a bank’s resilience to adverse shocks. This highlights the value of considering

ownership structure when designing bank regulations and assessing banks’ abilities to absorb

losses and cushion the impact of losses on the economy.

ECB Working Paper Series No 2511 / January 2021 4
1. Introduction

 There are strong linkages between bank equity and economic stability. As reviewed

by Thakor (2014), banks with more equity tend to lend more, create more liquidity, and have

higher probabilities of surviving crises. Baron, Verner, and Xiong (2019) show that adverse

shocks to bank equity predict contractions in lending and output, while Berger and Bouwman

(2013) and Jorda et al. (2017) discover that lower bank equity ratios are associated with

slower recoveries following crises. 1 Extensive research also stresses that bank equity can

foster stability by mitigating excessive risk-taking by banks and absorbing adverse shocks to

bank assets (e.g., Boot and Greenbaum 1993). These connections between bank equity and

the resilience of the economy to aggregate shocks highlight the value of understanding the

factors that shape the differing degrees to which banks issue new stock to replenish bank

equity in response to crises. The comparative incentives and influence of differing owners are

one potential factor influencing stock sales.

 Research offers conflicting perspectives on the impact of ownership structure on

stock issuances following adverse shocks to bank equity. In the presence of large private

benefits of control, a bank’s controlling owners may resist new stock issuances to protect

those rents (Barclay and Holderness 1989; Doidge et al. 2009). From this “dilution

reluctance” perspective, greater insider ownership will reduce stock sales, potentially making

the economy less resilient to aggregate shocks. In contrast, other research suggests that banks

with greater insider ownership can more effectively coordinate the actions of stakeholders

with differing interests during crises, (e.g., Chakraborty and Gantchev 2013), allowing such

banks to sell more stock than banks with less insider ownership. The overall impact of insider

ownership on stock sales in times of crisis, therefore, is an open empirical question.

 In this paper, we evaluate the role of insider ownership in shaping U.S. banks’ sale of

stock in response to the 2008 global financial crisis, which adversely bank valuations and put

1
 Theory explains how reductions in bank equity can reduce lending by increasing the risk premium paid by
banks, reducing banks’ ability to collateralize their assets, and hindering banks’ ability to commitment to
effective monitoring (e.g., Holmstrom and Tirole 1997; Bernanke, Gertler, and Gilchrist 1999; Gertler and
Kiyotaki 2010; He and Krishnamurthy 2013; Brunnermeier and Sannikov 2014; and Rampini and Viswanathan
2018).

ECB Working Paper Series No 2511 / January 2021 5
pressure on banks to raise new capital. We compile a unique database on the ownership

structure and equity issuances of private and public banks. We hand-collect annual data on

the ownership of 566 U.S. bank holding companies (BHCs). We define insiders as bank

directors and executives, as reported in banks’ regulatory FR Y-6 filings. Furthermore, we

compile data on stock sales by each bank. Using these data, we explore how insider

ownership shapes banks’ stock issuances following the onset of the financial crisis.

 There are two distinct periods of bank equity issuances following the collapse of Bear

Stearns, the failure of Lehman Brothers, and the placement of Fannie Mae and Freddie Mac

into government conservatorship. First, the U.S. Treasury started the Capital Purchase

Program (CPP) in Q4/2008 that encouraged financial institutions to sell preferred stock to the

Treasury. The program triggered a temporary surge in preferred stock sales in Q4/2008 and

Q1/2009. Second, following Q1/2009, the Supervisory Capital Assessment Program (SCAP)

(“stress test”) results encouraged banks to issue common equity and/or make other

adjustments to satisfy capital regulatory requirements (e.g., Bayazitova and Shivdasani

2012). Banks’ sales of common stock increased markedly after Q1/2009. Given our focus on

the potential dilution of control through stock sales, we are most concerned with common

stock—and not CPP-induced preferred stock sales to the Treasury. Thus, we focus on the

post-Q1/2009 period while controlling for bank issuances of preferred and common stock

before Q2/2009, but note that our results are robust to including earlier quarters.

 We employ three empirical tests to assess the relationship between insider ownership

and equity issuances. First, we conduct cross-sectional analyses of common stock sales and

insider ownership during the period from Q2/2009 through Q1/2011. We measure “insider

ownership” as the proportion of the BHC’s stock owned by insiders and calculate “common

stock sales” as the total amount of funds raised through common stock sales as a proportion

of bank equity in Q2/2008. We use ordinary least squares (OLS) regressions while

controlling for an array of BHC-specific and geographic fixed effects. Second, to address

concerns about the potential endogeneity of bank ownership, we employ a “shift-share”

instrumental variable (IV) in the spirit of Bartik (1991) and Goldsmith-Pinkham, Sorkin and

Swift (2018). Third, we extend these IV analyses and assess whether the relationship between

ECB Working Paper Series No 2511 / January 2021 6
stock sales and insider ownership varies across banks in ways that are consistent with

theories emphasizing that insider’s private benefits of control exert a first-order influence on

their reluctance to dilute those control rights through equity issuances.

 From the OLS analyses, we discover that greater insider ownership is associated with

less common stock sales following the onset of the crisis. The estimates suggest an

economically large relationship. For example, consider two otherwise identical banks, where

the “high” insider ownership BHC has one standard deviation greater insider ownership than

the “low” BHC. The estimates suggest that the “high” insider ownership bank would have

common stock sales as a proportion of bank equity that are about 22% greater than “low”

insider ownership bank. These findings are robust to altering the control variables and to

using different samples of banks. The results are consistent with the idea that insiders are

reluctant to dilute control rights by selling common stock.

 We continue to find that more insider ownership is associated with less common

stock sales when using instrumental variables to better identify the impact of insider

ownership on common stock sales. Specifically, we first identify for each BHC a set of peer

banks that are similar in size but active in different areas of the country, and compute the

change in the average level of insider ownership for these peers. To construct a predicted

level of insider ownership for each BHC, we use insider ownership for the BHC in 2003 and

multiply it by the average growth rate in insider ownership among its peer banks from 2003

through 2008. Under the assumption that a bank’s sale of common stock after the release of

the stress-test results in 2009 is exogenous to the change in average insider ownership of peer

banks prior to 2009, this “shift-share” IV approach allows us to identify the causal effect of

insider ownership on the sale of common stock. The 2SLS analyses confirm that greater

insider ownership reduces common stock sales and the estimated effects are very similar to

the OLS findings.

 We next conduct two tests of whether—and discover that—the relationship between

ownership structure and equity issuances varies across banks in a manner that is consistent

with the “dilution reluctance” view. By testing whether the IV results hold especially strongly

among banks where insiders are likely to be more resistant to losing their private benefits of

ECB Working Paper Series No 2511 / January 2021 7
control, this improves our identification strategy. First, we examine whether banks that

provide greater private benefits to insiders are also banks that are more reluctant to dilute

insider control through equity issuances following the onset of the crisis. To measure the

private benefits of control, we compute (a) the share of loans to bank insiders and (b) the

level of bank opacity, since greater opacity hinders effective governance by non-insiders,

offering greater private benefits of control (e.g., Jiang, Levine and Lin 2016). We then test

whether the negative impact of insider ownership on equity issuances is stronger among

banks offering greater benefits of control. Consistent with this private benefits view, the

impact of ownership structure on equity issuances is larger among banks that offer more

private benefits to insiders, i.e., among banks that lend more to insiders and are less

transparent.

 Second, we examine whether inside owners are more reluctant to dilute their control

rights through equity issuances when the expected positive impact of issuances on the banks

is smaller. Specifically, as the expected benefits from selling new shares in the form of

increased bank stability and market valuations falls, insiders will become increasingly

reluctant to issue stock and sacrifice private benefits of control. According to this

perspective, the inside owners of banks that are harder hit by shocks and hence less likely to

benefit from equity injections will be more reluctant to sell stock. We use two measures of

the degree to which each BHC is adversely affected by the financial crisis. Similar to Bord,

Ivashina and Taliaferro (2018), we use information on BHCs’ branch networks and

determine BHCs’ exposure to declines in housing prices during the financial crisis. The

second measure uses information on BHCs’ investment in mortgage-backed securities

(MBS), as the crisis induced market participants to view these assets as “toxic” and value

them accordingly. We compute each bank’s holdings of MBS to gauge its exposure to the

adverse shock to the value of these assets.

 We again find evidence consistent with the dilution reluctance view: bank insiders are

reluctant to reduce their private benefits of control by issuing equity, especially when the

positive effects of stock sales are likely to have smaller positive effects on bank valuations.

ECB Working Paper Series No 2511 / January 2021 8
We find that the negative impact of insider ownership on stock sales is stronger among banks

more adversely effected by the financial crisis.

 Our paper builds on existing empirical evidence on bank ownership structure. For

instance, Saunders, Strock, and Travlos (1990) find that shareholder-controlled banks take

more risks than those controlled by managers, who enjoy large private benefits from the

survival of the bank. Research also shows that bank risk is generally higher in banks with

more concentrated ownership, consistent with theories predicting that owners with substantial

cash flow rights induce banks to increase risk taking (e.g., Laeven and Levine 2009; and

Beltratti and Stulz 2012). Focusing on the global financial crisis, Fahlenbrach and Stulz

(2011) find that banks with larger managerial ownership, if anything, performed worse

during the global financial crisis. We contribute to this literature by analyzing the sale of

bank stock following the onset of the crisis, and linking differences in those to sales to

differences in the ownership structures of banks.

 Our paper complements the examination of European banks by Lepetit, Saghi-Zedek,

and Tarazi (2015). They show that following the global financial crisis, European banks were

more likely to reduce lending rather than raise new equity when (a) the bank’s ultimate

owner in a pyramid has control rights that materially exceed cash-flow rights and (b) the

bank operates in a country with weak shareholder protection laws. Our work differs in

several ways. First, rather than examining differences between control and cash-flow rights,

we focus on the influence of inside owners on stock sales. This focus on insiders both

complements the study of European ownership pyramids and is more relevant for U.S. banks,

where differences between control and cash flow rights are less central (e.g., Caprio, Laeven,

and Levine 2007). Second, we focus on issuances of common equity, which is crucial for

understanding the role of the private benefits of control in shaping stock sales following the

onset of the global financial crisis.

 Our paper also relates to recent research by Baron and Xiong (2017), Baron, Verner,

and Xiong (2019), and Baron (2020). This work examines the countercyclical equity issuance

puzzle: banks raise less common equity during credit expansions and raise comparatively

more equity in economic downturns. For example, Baron (2020) presents a model and

ECB Working Paper Series No 2511 / January 2021 9
evidence consistent with the view that government guarantees to bank creditors help account

for why banks resist equity issuances during economic booms. While also examining the

equity issuance decisions of banks, we focus on testing whether and how ownership structure

helps account for the different equity issuance decisions of banks following a major crisis.

 Furthermore, our research contributes to a large corporate finance literature on the

private benefits of control (e.g., Jensen 1986; Jensen and Meckling 1986; and Dyck and

Zingales 2004). Theory provides conflicting views regarding the willingness and ability of

inside owners to have their firms raise funds through equity issuances. As emphasized above,

corporate insiders may be reluctant to dilute their ownership stake and private benefits

(Barclay and Holderness 1989; Doidge et al. 2009). On the other hand, insider control can

facilitate the ability of owners to coordinate to raise equity in times of duress (Chakraborty

and Gantchev 2013). This literature, however, primarily focuses on non-financial firms, and

stock-exchange listed firms for which data on insider shareholdings is publicly available. We

contribute to this literature by analyzing public and private firms. This is possible because the

FR-Y6 regulatory filings are available for both publicly listed and privately-owned banks.

This offers a unique setting to study the effects of different ownership structures on equity

issuance decisions within publicly-listed and privately-owned firms, which is the more

typical ownership type in the United States and worldwide.

 Finally, our study speaks to recent policy reforms to bank regulations that have

increasingly emphasized the quality of bank capital not just its quantity (e.g., Hoshi and

Kashyap 2010 and Jiménez et al. 2017). For example, Basel III introduced a minimum

common equity requirement with the goal of ensuring that banks not have a sufficient

quantity of capital also have sufficient amount of the most efficient and effective loss-

absorbing liability: common equity. These regulatory changes, however, have not yet

considered ownership structure. Our work stresses the importance of ownership structure,

finding that ownership structure shapes common equity issuances in response to a crisis and

hence affects a bank’s resilience to adverse shocks. This highlights the value of considering

ownership structure when designing bank regulations and assessing banks’ abilities to absorb

losses and cushion the impact of losses on the economy.

ECB Working Paper Series No 2511 / January 2021 10
2. Bank Ownership and Stock Sales: Data and Patterns

 We assemble a unique dataset on bank ownership and combine those data with

information on the issuance of bank stock and other bank traits. We examine domestically-

owned bank holding companies that are organized as stock corporations. Our sample consists

of 566 BHCs with non-missing information on ownership and stock sales.

2.1 Bank ownership

 We assemble a new database on bank ownership from BHCs’ regulatory filings (FR

Y-6) for public and private U.S. BHCs. U.S. law requires BHCs to file FR Y-6 reports with

information on the identity and percentage ownership stakes of principal shareholders,

directors and executive officers. We go through each of the FR Y-6 reports compiled by SNL

Financial and manually construct a database on the percentage of each BHC owned by

directors and executives over the period from 2003 through 2008, data permitting. 2 We

exclude (a) BHCs with missing data on the sale of common stock or ownership, (b) BHCs

owned by a foreign entity, and (c) BHCs that are not organized as a stock corporation. This

yields a sample of 566. This sample includes public and private banks, which is unusual in

corporate finance given the challenges of collecting such data for large samples of private

firms (e.g., Helwege, Pirinsky, and Stulz 2007; Fahlenbrach and Stulz 2009).

 Insider Ownership equals the percentage of common stock owned by bank insiders,

i.e., directors and executives. For most of the analyses, we measure ownership in 2008, but

the results are robust, as shown in the Appendix, to using Insider Ownership in 2003, as

ownership structure changes little over time.

2 The FR Y-6 filings sometimes provide imprecise information ownership by an insider when the holdings are small, e.g.,
indicating that a person owns “less than 0.1% of shares.” We used a variety of approaches for addressing this, including
setting such ownership shares to zero or setting aggregate insider ownership shares equal to zero if the summation across all
insiders was less than five percent of total shares. We report the results using this 5% cutoff as our focus is on assessing
whether insiders make decisions about stock sales based on their private benefits of control and many studies use such a
cutoff. The results reported below, however, are robust to using alternative methods.

ECB Working Paper Series No 2511 / January 2021 11
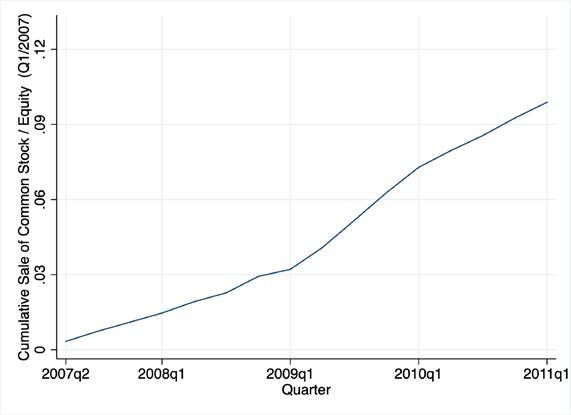
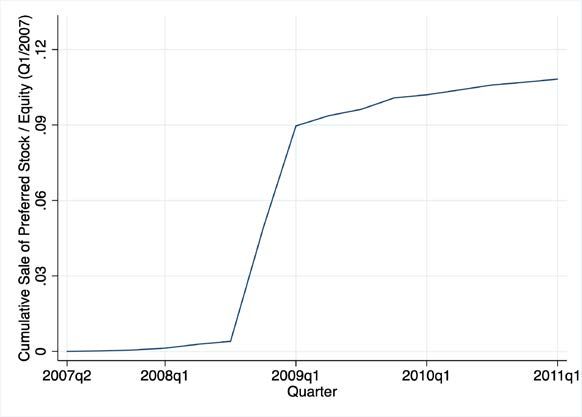
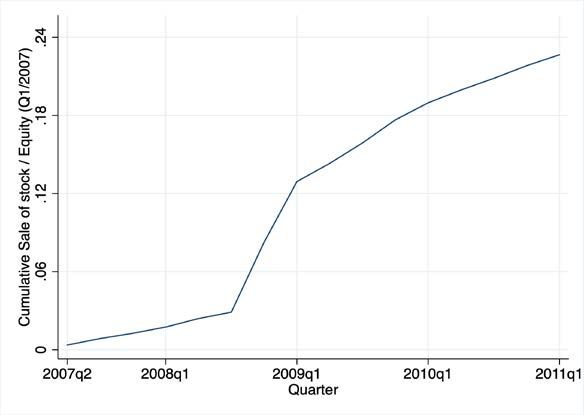
2.2 Sales of bank stock

 We collect information on the sale of common (item bhck3579) and preferred stock

(item bhck3577) by U.S. BHCs from regulatory filings FR Y-9C. For most of our analyses,

we focus on sales of common stock over the period from Q2/2009 through Q1/2011.

Specifically, Sale of Common Stock equals the total amount of funds raised by the sale of

common stock over the Q2/2009-Q1/2011 period divided by bank equity capital in Q2/2008,

where bank equity capital is total BHC equity reported in FR Y-9C filings (item bhck3210). 3

We winsorize Sale of Common Stock at the top 1 percentile. In some analyses, we examine a

longer time period and compute the Cumulative Sale of Common Stock at the quarterly

frequency starting in Q2/2007, scaled by bank equity in Q1/2007. We use analogous

definitions for cumulative preferred stock sales and total stock sales.

 As noted in the Introduction, we focus—though not exclusively—on the sale of

common stock from Q2/2009 through Q1/2011 for two reasons. First, we are concerned with

the control rights, and hence the voting rights, of insiders, which naturally focuses our

attention on common stock. Second, we do not want to focus on CPP-induced stock sales to

the U.S. Treasury in Q4/2008 and Q1/2009. As a result, the bulk of our analyses cover the

post-Q1/2009 period while controlling for bank issuances of preferred and common stock

before Q2/2009. The results, however, hold, if we also include the Q4/2008 - Q1/2009

period.

2.3 BHC-specific control variables

 We condition on an array of BHC-specific control variables. We obtain other balance

sheet information on BHCs from regulatory FR Y-9C (“Call Report”) filings. We compute

these bank characteristics in Q2/2008, which was immediately after the failure of Bear

Stearns and before the collapse of Lehman Brothers in September of 2008. Thus, we view

them as pre-determined with respect to the onset of the crisis.

 The baseline set of BHC-specific control variables are as follows, where all are

measured in Q2/2008. Equity Capital / RWA equals the ratio of bank equity capital to risk
3 All of the results hold when scaling by Tier 1 Capital rather than by total BHC equity.

ECB Working Paper Series No 2511 / January 2021 12
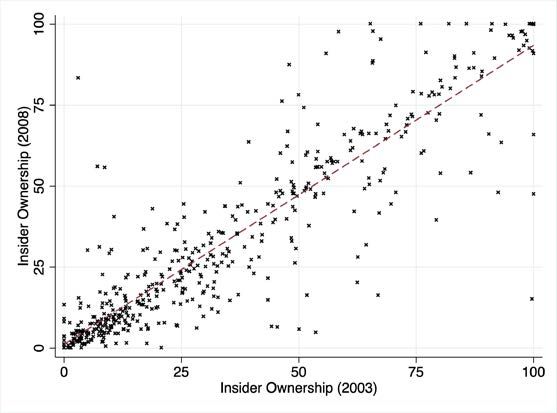
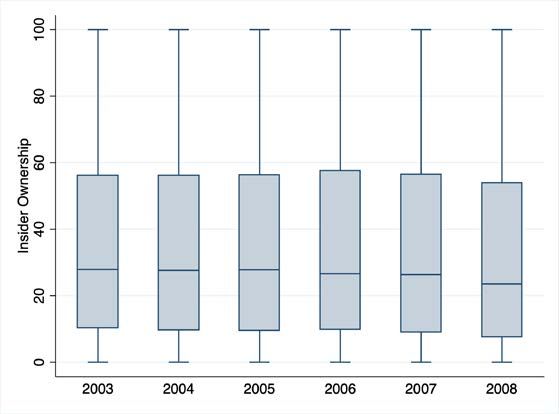
weighted assets (RWA). ln(Risk Weighted Assets) is the natural logarithm of risk weighted

assets. Deposits / Assets is the ratio of deposits to total assets. Loans/Assets is the ratio of

loans to total assets. Other Earning Assets / Assets is the share of other earning assets in total

assets. Income Diversity is defined as one minus the absolute value of (Interest income -

Noninterest income), divided by total operating income. Noninterest income / Operating

income is the ratio of noninterest income to operating income. Dividends / Net Income is the

ratio of dividends to net income. Net Income / Equity Capital is the ratio of net income to

bank equity. We winsorize these control variables at the bottom and top 1 percentile. Finally,

the baseline set of control variables also includes a dummy variable that equals one if the

BHC received TARP support (=1 if BHC received TARP).

2.4. Descriptive statistics and patterns

 Table 1 reports descriptive statistics. On average, insiders held about 33% of a BHC’s

common stock in 2008. There is substantial heterogeneity, as the standard deviation is 31%.

Indeed, 13 BHCs (= 2.3% of our sample) report that insiders do not hold any ownership in

the BHCs, while 23 BHCs (4% of our sample) are fully owned by bank insiders. While

insiders hold less than 7.5% of all shares for a quarter of all BHCs (bottom quartile), a

quarter of all BHCs report that insider hold at least 54%. Sale of Common Stock over the

Q2/2009 – Q1/2011 averaged about 7% with substantial cross-bank differences as the

standard deviation is 17%. The average ratio of bank equity to risk-weighted assets (Equity

Capital/RWA) in Q2/2008 was 11.4%, suggesting that the average BHC was well capitalized

as the crisis began.

 2.4.1 Insider Ownership

 Ownership structure is stable over time. Figure 1 displays the boxplot of insider

ownership for each year (Panel A). The interquartile range is quite stable over time indicating

that the distribution of insider ownership remains similar, though there is a slight decrease

over time, with median insider ownership of 28% in in 2003 and 24% in 2008. Panel B

explores this more where we plot the insider ownership of a BHC in 2008 against its insider

ownership in 2003. The linear fit is represented by the dashed line, indicating a strong and

ECB Working Paper Series No 2511 / January 2021 13
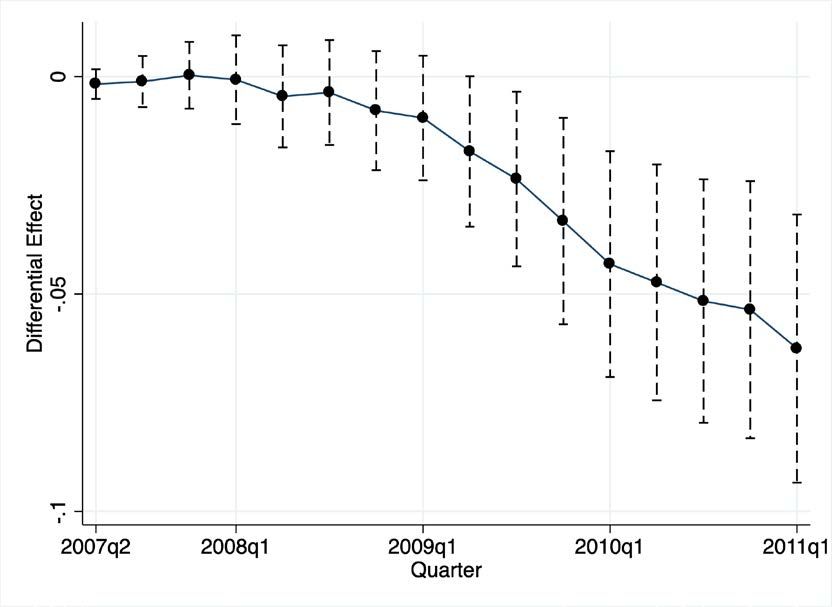
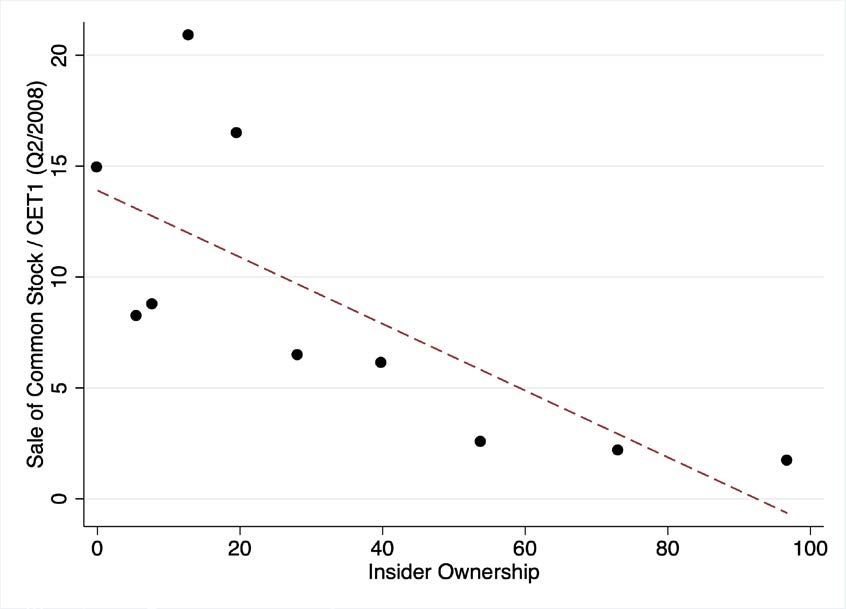
positive correlation between the insider ownership in 2008 and 2003. The coefficient

estimate of a regression of insider ownership in 2008 on insider ownership in 2003 is 0.92

and statistically significant at the 1% level.

 2.4.2 Sale of Stock

 Figure 2 illustrates the cumulative sales of common and preferred stock from

Q2/2007 through Q1/2011. The sale of preferred stock surged in Q4/2008 and Q1/2009, as

banks were encouraged to sell preferred shares to the U.S. Treasury as part of the CPP. After

that, there were exceedingly small amounts of preferred stock sales. In contrast, sales of

common stock rise throughout the period, with issuances accelerating after Q2/2009.

 Figure 3 documents the negative relationship between Sale of Common Stock from

Q2/2009 to Q1/2011 and Insider Ownership. Specifically, we first group BHCs into decile

bins based on Insider Ownership, so that the first bin contains BHCs in the lowest Insider

Ownership decile and the tenth bin contains all BHCs in the highest decile of Insider

Ownership. For each bin, we then compute the average Sale of Common Stock across BHCs

in the bin and the average Insider Ownership. We plot these observations in Figure 2,

illustrating the negative correlation between Sale of Common Stock and Insider Ownership.

 Figure 4 documents the evolution of common stock sales from Q2/2007 through

Q1/2011 while differentiating banks by the degree of insider ownership. To construct the

figure, we first estimate the following regression using quarterly information at the BHC-

level, from Q2/2007 through Q1/2011:

 , = ∑16
 =1( 1, + 2, ℎ ∗ ) + , , (2)

where , is the cumulative sale of common stock by

BHC i from Q2/2007 through quarter t, scaled by bank equity capital in Q1/2007,
 ℎ equals one if BHC i has above the median Insider Ownership and zero

otherwise, and is a dummy variable that equals one in quarter t, and otherwise equals zero.

Thus, the vector, D, simply represents time-fixed effects for the 16 quarters from Q2/2007
through Q1/2011. Consequently, ̂1,t represents the estimated average Cumulative Sale of

ECB Working Paper Series No 2511 / January 2021 14
Common Stock in quarter t, and ̂2,t is the estimated difference between this estimate for the

average BHC and BHCs with above the median values of Insider Ownership. Figure 3 plots
 ̂2,t for each quarter as well as the 99% confidence interval after standardizing ̂2,t, so that

they represent the change in cumulative common stock sales for a one standard deviation

increase in insider ownership.

 As shown, there is a notable and statistically significant divergence in Cumulative
Sale of Common Stock for BHCs with above the median levels of Insider Ownership relative

to the average BHC in the sample after Q1/2009. Although the high-insider ownership BHCs

tend to sell less common stock than other BHCs throughout the sample period and the

estimated gap in common stock sales between high- and low-insider ownership BHCs starts

to widen in 2008, the estimated difference does not become statistically significant until

Q2/2009, which is after the CPP-induced sales of preferred stock to the U.S. Treasury. Taken

together, Figures 1-3 offer patterns that are consistent with the view that banks with greater

insider ownership sell less common stock following the onset of the crisis. To control of

other factors, improve identification, and provide direct evidence on the view that bank

insiders are reluctant to have their banks sell common equity and dilute their control over

their banks because it would reduce the ability of those insiders to extract private rents, we

now turn to OLS, IV, and split sample analyses.

3. Ownership and the Sale of Common Stock

3.1 Econometric model: OLS

 We evaluate the relationship between the sale of common stock and ownership

structure over the period using the following cross-section regression in an approach similar

to Beltratti and Stulz (2012) and Fahlenbrach and Stulz (2011):

 = + ℎ + ′ + + , (1)

where ′ is composed of BHC-specific traits, and is a set of Federal Reserve District fixed

effects. We include these fixed effects to account for potential unobservable heterogeneity in

bank supervision and regulation across the twelve Federal Reserve Districts. We classify a

ECB Working Paper Series No 2511 / January 2021 15
BHC as belonging to a particular district based on the location of its headquarters. We
standardize the estimated coefficients, ̂ and �, to facilitate interpretation of the estimated

magnitudes. Specifically, the standardized coefficients indicate the estimated number of

standard deviation changes in the dependent variable associated with a one standard deviation

change in the explanatory variable.

 Table 2 reports regression results using different controls. Column (1) conditions on

the baseline set of BHC-specific control variables defined in Section 2.3. To these baseline

controls, column (2) adds the change in risk-weighted-assets (Change in RWA) from Q2/2009

through Q1/2011. Since banks may sell stock or reduce RWA to meet regulatory capital

requirements, we control for the change in risk-weighted assets over this period to assess the

independent connection between insider ownership and stock sales. To the baseline controls,

column (3) adds the change in the ratio of bank equity to risk-weighted assets (Change in

Equity/RWA) from Q2/2008 through Q1/2009. We include Change in Equity/RWA to address

the possibility that the relationship between ownership and equity issuances after Q1/2009

depends on stock sales—including regulatory-induced stock sales—during the initial months

of the crisis. Finally, column (4) includes all control variables simultaneously.

3.2 Results: OLS

 As shown in Table 2, BHCs sell less stock when insiders own a larger proportion of

the BHC. The results are robust: Insider Ownership enters negatively and significantly at the

one-percent level in all four specifications; and the estimated coefficient Insider Ownership

hardly changes when using different control variables. Furthermore, the estimated

relationship is economically meaningful. For example, the estimates indicate that BHCs with

one standard deviation greater Insider Ownership tend to sell about 9% less of a standard

deviation common stock than otherwise similar BHCs following the 2009 stress-tests. To put

this in dollar terms, consider both a BHC with “high” insider ownership, which we will

define as 0.5 standard deviations above the sample mean level of insider ownership, and an

otherwise similar BHC with “low” insider ownership, which we will similarly define as

having 0.5 standard deviations less insider ownership than the sample mean. The estimated

ECB Working Paper Series No 2511 / January 2021 16
coefficient on Insider Ownership indicates that in the high insider ownership bank, sales of

common stock as a proportion of total bank equity will be 1.5% lower in the high insider

ownership BHC relative to the low insider ownership bank (1.5=16.71*0.089. ). This is large

since average common equity sales were 7% of bank equity.

 Focusing on the non-ownership control variables, we note the following. First, the

results in Table 2 are robust to controlling for the large array of BHC-specific features,

including Equity Capital / RWA, ln(Risk Weighted Assets), Deposits / Assets, Loans/Assets,

Other Earning Assets / Assets, Income Diversity, Noninterest income / Operating income,

Dividends / Net Income, Net Income / Equity Capital, and =1 if BHC received TARP), which

helps in mitigating omitted variable bias concerns. Second, the correlation between Insider

Ownership and Equity Capital / RWA is both low (-0.048) and insignificant, suggesting that

the degree of insider ownership is not a proxy for bank capitalization. Third, larger banks—as

measured by Ln(RWA)—sell more common stock as a fraction of bank equity. This is not

surprising since larger banks tend to face few barriers to conducting seasoned equity

offerings and following the stress-test results, larger banks faced stronger regulatory

pressures to issue new common stock. Fourth, the Change in RWA (from Q2/2009 through

Q1/2011) enters positively and significantly: banks that expanded after the crisis also issued

more common stock during that period.

3.3 Estimation strategy: Instrumental variables (IV) based on a shift-shares approach

 Although the OLS regression results show a negative and statistically significant

relationship between the share of bank equity owned by insiders and the sale of common

stock, omitted variables could account for these findings. For example, unobservable

differences in the ability of inside and outside investors to monitor bank managers could

explain both the degree of insider ownership and the BHC’s access to equity markets and

hence common stock sales following 2008.

 To better identify the impact of ownership structure on BHC sales of common stock,

we construct a Bartik-type shift-share instrumental variable for Insider Ownership. Bartik

(1991) developed an approach to capture the exogenous component of local employment

ECB Working Paper Series No 2511 / January 2021 17
growth. He interacted pre-determined local industry employment shares with national

industry employment growth rates. Under the assumption that these national growth rates are

exogenous to local industries, this interaction term can plausibly serve as an instrumental

variable for local employment growth (Goldsmith-Pinkham, Sorkin and Swift, 2018).

 Following this approach, we start by identifying 30 peer-banks for each bank b. The

peer banks (a) have no overlap in their branch network with bank b (Levine, Lin and Wang,

2017) and (b) are similar to bank b with respect to total assets. We then compute this peer

group’s average growth rate in Insider Ownership between 2003 and 2008. Finally, to

construct a bank-specific instrument for bank b, we multiply b’s value of Insider Ownership

in 2003 by the average growth rate of b’s peer banks’ Insider Ownership between 2003 and

2008. This “shift-share” instrumental variable then captures for each bank b its “predicted”

level of insider ownership. Under the assumption that stock sales by bank b from Q2/2009

through Q1/2011 is not otherwise related to changes in the insider ownership of the bank’s

peers from 2003 through 2008, this instrumental variable is a valid instrument for insider

ownership for bank b. We call this Bartik-type instrument, Predicted Insider Ownership.

 In Table 3, we present the IV results in Panel A, the first-stage findings in Panel B,

and the reduced form results in Panel C. For each panel, we provide the estimates using the

same four sets of control variables from Table 2.

3.4 Results: IV

 As shown, the IV results confirm the OLS findings: BHCs with more insider

ownership sell less stock during the Q2/2009 to Q1/2011 period than other banks. Insider

Ownership enters negatively and significantly across all four specifications. Moreover, the IV

coefficients are similar to the OLS estimates from Table 2. The first stage regression results

show that there is a positive and statistically significant link between the predicted level of

bank b’s insider ownership share (Predicted Insider Ownership) and the bank’s actual degree

of insider ownership share (Insider Ownership). The reduced form regression results also

indicate that the instrumental variable, Predicted Insider Ownership, is strongly negatively

associated with the sale of common stock by banks.

ECB Working Paper Series No 2511 / January 2021 18
By instrumenting for insider ownership, we ameliorate concerns that some third factor

is shaping both insider ownership and stock sales. Our findings on stock sales are consistent

with the idea that inside owners are reluctant to issue equity and dilute their ownership stakes

in order to preserve their private benefits of control. We now differentiate among banks to

test more directly whether such “dilution reluctance” drives the relationship between stock

sales and insider ownership.

3.5 Dilution reluctance

 We next test whether the relationship between insider ownership and stock sales

varies across banks in a manner that is consistent with the view that bank insiders are

reluctant to reduce their private benefits of control by issuing equity. In particular, we

differentiate banks by the degree to which insiders enjoy private benefits of control. We then

test whether the negative relationship between insider ownership and stock sales is stronger

among high private-benefit banks. These tests provide additional information on the

mechanisms linking ownership structure and stock sales, which also improves identification.

 To differentiate banks, we use two measures of the private benefits of control. The

first measure—insider lending—gauges the degree to which banks extend credit to bank

insiders i.e. executive officers, directors, principal shareholders etc. This information is

provided for all commercial banks, and we aggregate this information at the BHC level and

calculate the share of insider loans in a BHC’s loan portfolio in the first quarter of 2009. On

average, about 1.7 percent of a BHC’s total loan amount in our sample consists of loans to

bank insiders. We split the sample based on the median share of insider loans and consider

BHCs that have an above median level of insider lending (“High” insider lending) to offer

more private benefits to inside owners than other banks (i.e., “Low” insider lending banks).

 The second indicator of the private benefits of control—bank opacity—measures the

degree to which bank insiders have the latitude to exploit their control of the bank to extract

private benefits. To measure bank opacity, a large literature, reviewed by Dechow, Ge and

Schrand (2010), compares banks’ observed loan loss provisions with predicted loan loss

provisions obtained from a statistical model. These “abnormal” accruals of loan loss

ECB Working Paper Series No 2511 / January 2021 19
provisions are indicative of greater bank opacity as they reflect greater earnings management

by bank managers. Following Jiang, Levine and Lin (2016), we construct abnormal loan loss

provision accruals and split the sample into high and low opacity banks by whether they have

“abnormal” accruals above or below the sample median. We split the sample of banks into

those with above the median levels of abnormal loan loss provision accruals—“High” opacity

BHCs—and those with below the median levels—“Low” opacity BHCs.

 As shown in Table 4, we find evidence consistent with the dilution reluctance view:

bank insiders were more reluctant to have their banks sell stock during the crisis when the

private benefits of controlling a bank were larger. That is, the negative impact of insider

ownership on stock sales is larger among banks that offer more private benefits of control to

insiders. In Panel A of Table 4, we split the sample by “Low” and “High” insider lending

banks, and split the sample by “Low” and “High opacity banks in Panel B. We again present

the results using different combinations of control variables. Across the different splits, we

find that in banks that offer greater private benefits to insiders—High insider lending and

High opacity banks, the degree of insider ownership is more negatively associated with stock

sales. That is, when the private benefits of control are higher, banks are more reluctant to

dilute those control benefits through equity issuances.

3.6 Adverse Shock to Equity

 We next test whether the impact of insider ownership on stock sales by banks is larger

among banks hit harder by the financial crisis. We conduct this test to shed additional

empirical light on the importance of the private benefits of control in shaping bank issuances

of stock. In particular, we take that perspective that there are costs and benefits to insiders

from having the bank sell stock following the onset of the crisis. One potential benefit to

insider owners is that common stock sales augment the bank’s capital cushion, increase the

viability of the bank, and boost the value of insiders’ shares. One potential cost to insiders is

that such stock sales reduce their control over the bank and the private benefits that they can

extract. When adverse shocks materially reduce the likelihood that common stock sales will

boost the value of bank shares, then inside owners will become more focused on preventing

ECB Working Paper Series No 2511 / January 2021 20
equity issuances that will dilute their control and hence reduce their abilities to extract private

benefits. From this perspective, banks in which insiders hold larger proportions of equity will

become more intensely focused on resisting equity issuances when their banks are hit with

large, adverse shocks.

 To conduct this test, we use two measures of the degree to which banks were

adversely hit by the financial crisis. First, following Bord, Ivashina and Taliaferro (2018), we

use information on BHCs branch networks and determine BHCs’ exposure to declines in

housing prices. To do this, we combine information on the location of bank branches with

data on changes in house prices in each Metropolitan Statistical Area (MSA) between

Q2/2007 and Q4/2008. This yields information on the exposure of each BHC, through its

branch network, to declines in housing prices. About a third of all BHCs do not report

branches in MSAs that experience a local downturn during the financial crisis. The other two

thirds of BHCs have branches in areas that experience house price declines. We separately

examine each of these two types of banks.

 The second measure of the degree to which banks were adversely affected by the

crisis focuses on their investment in mortgage backed securities (MBS). The expansion of the

U.S. mortgage market and the ability to securitize mortgages and sell them in financial

markets led to a reduction in lending standards and thus MBS (Keys et al., 2010). Capital

regulation, however, considered MBS less risky, incentivizing banks to invest in them.

Concerns regarding the quality of mortgage-backed securities intensified after the collapse of

Bear Stearns due to the bank’s heavy investment in these securities, deeming these assets

toxic. We split banks by whether they have above the median exposure to MBS as share of

their total assets in Q1/2009 and call them “High” MBS exposure banks, and banks with

below the median exposure, e.g., “Low” MBS exposure banks.

 Consistent with the view that insiders value their private benefits of control of banks

and are therefore reluctant to sell stock even during a major financial crisis, we find that the

impact of insider ownership on stock sales is more negative among banks hit hardest by the

crisis. In Panel C of Table 4, we report regression results where we split banks by whether

they are present in areas that experience a reduction in house prices during the financial crisis

ECB Working Paper Series No 2511 / January 2021 21
or whether the banks were not active in those areas. In Panel D of Table 4, we report results

where we split banks depending on their exposure to MBS. We find that insider ownership

leads to a reduction in banks’ sale of common stock, especially among banks that (a) are

active in areas that experience a reduction in local house prices and (b) depended more on

MBS when the mortgage crisis hit. These findings indicate that when adverse shocks reduce

the expected value of banks’ equity, bank insiders become focused on extracting private

benefits from the bank, so that insiders with larger shares of equity more effectively resist

bank equity sales.

4. Conclusions

 In this paper, we construct a unique dataset on the ownership structure of banks to

examine the impact of insider ownership on equity issuances. Consistent with the view that

inside owners are reluctant to lose their private benefits of control by diluting that control

through equity issuances, we find that the share of insider ownership is negatively associated

with equity issuances after the onset of the financial crisis. This suggests that the private

benefits of control—and hence the ownership structure of banks—shaped how U.S. BHCs

responded to the global financial crisis. Our results highlight an important channel through

which ownership structure affects capital buffers and hence the resilience and stability of

banks.

ECB Working Paper Series No 2511 / January 2021 22
References

Barclay, M.J. and Holderness, C.G., 1989. Private benefits from control of public
 corporations. Journal of Financial Economics, 25(2), 371-395.

Baron, M., 2020. Countercyclical bank equity issuance. Review of Financial Studies,
 forthcoming.

Baron, M., Verner, E. and Xiong, W., 2019. Salient crises, quiet crises. SSRN Working
 Papers.

Baron, M. and Xiong, W., 2017. Credit expansion and neglected crash risk. The Quarterly
 Journal of Economics, 132(2), 713-764.

Bartik, T., 1991. Who benefits from state and local economic development policies? W.E.
 Upjohn Institute.

Bayazitova, D. and Shivdasani, A., 2011. Assessing TARP. The Review of Financial Studies,
 25(2), 377-407.

Beatty, A., Ke, B., Petroni, K.R.,2002. Earnings management to avoid earnings declines
 across public and privately held banks. The Accounting Review 77, 547-570.

Beatty, A., Liao, S., 2011. Do delays in expected loss recognition affect banks’ willingness to
 lend? Journal of Accounting and Economics 52, 1-20.

Beltratti, A. and Stulz, R.M., 2012. The credit crisis around the globe: Why did some banks
 perform better?. Journal of Financial Economics, 105(1), 1-17.

Berger, A.N. and Bouwman, C.H., 2013. How does capital affect bank performance during
 financial crises?. Journal of Financial Economics, 109(1), 146-176.

Bernanke, B.S., Gertler, M. and Gilchrist, S., 1999. The financial accelerator in a quantitative
 business cycle framework. Handbook of Macroeconomics, 1, 1341-1393.

Bord, V., Ivashina, V. and Taliaferro, R, 2018, Large Banks and Small Firm Lending,
 working paper, Harvard Business School.

Brunnermeier, M.K. and Sannikov, Y., 2014. A macroeconomic model with a financial
 sector. American Economic Review, 104(2), 379-421.

Caprio, G., Laeven, L. and Levine, R., 2007. Governance and bank valuation. Journal of
 Financial Intermediation, 16(4), 584-617.

Chakraborty, I. and Gantchev, N., 2013. Does shareholder coordination matter? Evidence
 from private placements. Journal of Financial Economics, 108(1), 213-230.

ECB Working Paper Series No 2511 / January 2021 23
Dechow, P.W., Ge, W., Schrand, C., 2010. Understanding earnings quality: A review of the
 proxies, their determinants and their consequences. Journal of Accounting and
 Economics 50, 344-401.

Doidge, C., Karolyi, G.A., Lins, K.V., Miller, D.P. and Stulz, R.M., 2009. Private benefits of
 control, ownership, and the cross-listing decision. Journal of Finance, 64(1), 425-466.

Fahlenbrach, R. and Stulz, R.M., 2011. Bank CEO incentives and the credit crisis. Journal of
 Financial Economics, 99(1), pp.11-26.

Fahlenbrach, R. and Stulz, R.M., 2009. Managerial ownership dynamics and firm value.
 Journal of Financial Economics, 92(3), 342-361.

Gertler, M. and Kiyotaki, N., 2010. Financial intermediation and credit policy in business
 cycle analysis. In Handbook of monetary economics (Vol. 3, pp. 547-599). Elsevier.

Goldsmith-Pinkham, P., Sorkin, I. and Swift, H., 2018. Bartik instruments: What, when, why,
 and how (No. w24408). National Bureau of Economic Research.

He, Z. and Krishnamurthy, A., 2013. Intermediary asset pricing. American Economic
 Review, 103(2), 732-70.

Helwege, J., Pirinsky, C. and Stulz, R.M., 2007. Why do firms become widely held? An
 analysis of the dynamics of corporate ownership. Journal of Finance 62(3), 995-1028.

Holmstrom, B. and Tirole, J., 1997. Financial intermediation, loanable funds, and the real
 sector. Quarterly Journal of economics, 112(3), 663-691.

Hoshi, T. and Kashyap, A.K., 2010. Will the US bank recapitalization succeed? Eight lessons
 from Japan. Journal of Financial Economics, 97(3), 398-417.

Jensen, M., 1986, Agency costs of free cash flow, corporate finance, and takeovers, American
 Economic Review 76, 332 – 329.

Jensen, M.C., Meckling, W., 1986, Theory of the firm: managerial behavior, agency costs,
 and ownership structure, Journal of Financial Economics 3, pp.305 – 360.

Jiang, L., Levine, R. and Lin, C., 2016. Competition and bank opacity. The Review of
 Financial Studies, 29(7), 1911-1942.

Jiménez, G., Ongena, S., Peydró, J.L. and Saurina, J., 2017. Macroprudential policy,
 countercyclical bank capital buffers, and credit supply: evidence from the Spanish
 dynamic provisioning experiments. Journal of Political Economy, 125(6), 2126-2177.

Jordà, Ò., Richter, B., Schularick, M. and Taylor, A.M., 2017. Bank capital redux: solvency,
 liquidity, and crisis (NBER working paper w23287).

Laeven, L. and Levine, R., 2009. Bank governance, regulation and risk taking. Journal of
 Financial Economics, 93(2), 259-275.

Lepetit, L., Saghi-Zedek, N. and Tarazi, A., 2015. Excess control rights, bank capital
 structure adjustments, and lending. Journal of Financial Economics, 115(3), 574-591.

ECB Working Paper Series No 2511 / January 2021 24
Levine, R., Lin, C. and Wang, Z., 2020. Acquiring banking networks. Management Science,
 forthcoming.

Rampini, A.A. and Viswanathan, S., 2018. Financial intermediary capital. The Review of
 Economic Studies, 86(1), 413-455.

Saunders, A., Strock, E. and Travlos, N.G., 1990. Ownership structure, deregulation, and
 bank risk taking. Journal of Finance, 45(2), 643-654.

Thakor, A.V., 2014. Bank capital and financial stability: An economic trade-off or a Faustian
 bargain?. Annu. Rev. Financ. Econ., 6(1), 185-223.

ECB Working Paper Series No 2511 / January 2021 25
Table 1: Summary statistics
 This table presents descriptive statistics. 'Insider ownership (%)' is the share of stock, held by insiders in 2008, 'Predicted Insider ownership (%)' is the predicted insider ownership for a bank in 2008, 'Sale of common stock' is the total sale of common
 stock over the quarters Q2/2009 to Q1/2011, scaled by equity capital in Q2/2008, 'Equity capital / RWA' is total equity capital, scaled by RWA, 'ln(Risk weighted assets)' is the natural logarithm of risk weighted assets in Q2/2008, 'Deposits/Assets' is the
 share of deposits in total assets, 'Loans/Assets' is the share of loans in total assets, 'Other earning assets/Assets' is the share of other earning assets in total assets, 'Income diversity' is defined as 1 minus the absolute value of (Interest income - Noninterest
 income), divided by total operating income, 'Noninterest income/Operating income' is the share of noninterest income in operating income, 'Change in RWA' is the change of risk-weighted assets. '=1 if BHC received TARP' is an indicator variable,
 taking on the value of one whether a bank received financial support as part of TARP. 'Dividends / Net income (Q2/2008)' is the ratio of dividends to net income in Q2/2008, 'Net income / Equity capital (Q2/2008)' is the ratio of net income to equity
 capital in Q2/2008,'Change in RWA (Q2/2009 to Q1/2011)' is the ratio of RWA in Q1/2011 to RWA in Q2/2009 minus 1, 'Change in Equity capital/RWA (Q2/2008 to Q1/2009)' is the difference between the ratio of equity capital and RWA in Q1/2009
 and the ratio of equity capital and RWA in Q2/2008. The calendar quarters when these variables are computed are reported in parentheses.

 N Mean St.Dev. 25th pct Median 75th pct Min Max
 Insider ownership (%) 566 33.25 30.96 7.58 23.52 53.90 0 100.00
 Predicted Insider ownership (%) 493 34.43 31.25 8.64 25.79 51.33 0 138.78
 Sale of common stock (* 100) 566 7.19 16.71 0 0.02 4.11 -0.02 96.88
 Ln(Risk weighted assets) (Q2/2008) 566 13.80 1.11 13.10 13.54 14.17 12.07 18.59
 Deposits / Assets (Q2/2008) 566 0.76 0.09 0.72 0.77 0.82 0.38 0.90

ECB Working Paper Series No 2511 / January 2021
 Loans / Assets (Q2/2008) 566 0.70 0.11 0.65 0.72 0.78 0.31 0.90
 Other earning assets / Assets (Q2/2008) 566 0.01 0.01 0 0 0.01 0 0.09
 Income diversity (Q2/2008) 566 0.66 0.11 0.58 0.65 0.73 0.37 0.96
 Noninterest income / Operating income (Q2/2008) 566 0.17 0.10 0.11 0.15 0.20 0.01 0.60
 Equity capital / RWA (Q2/2008) (*100) 566 11.42 3.81 8.75 10.78 13.41 5.11 27.40
 Sale of common stock (Q3/2008 to Q1/2009 ) (*100) 566 0.97 3.00 0 0 0.70 0 22.00
 =1 if BHC received TARP 566 0.32 0.47 0 0 1 0 1
 Dividends / Net income (Q2/2008) 566 0.45 0.69 0.13 0.39 0.61 -1.72 4.13
 Net income / Equity capital (Q2/2008) 566 0.04 0.04 0.03 0.05 0.06 -0.21 0.14
 Change in RWA (Q2/2009 to Q1/2011) 554 -0.06 0.16 -0.15 -0.05 0.03 -0.47 0.58
 Change in equity capital / RWA (Q2/2008 to Q1/2009) 566 0.45 1.83 -0.52 0.32 1.72 -5.79 4.55

26
You can also read