Instone Real Estate Group AG - Investor presentation October 2020 Developing real estate with passion
←
→
Page content transcription
If your browser does not render page correctly, please read the page content below
Instone Real Estate Group AG

                          Investor presentation
                              October 2020

Developing real estate with passion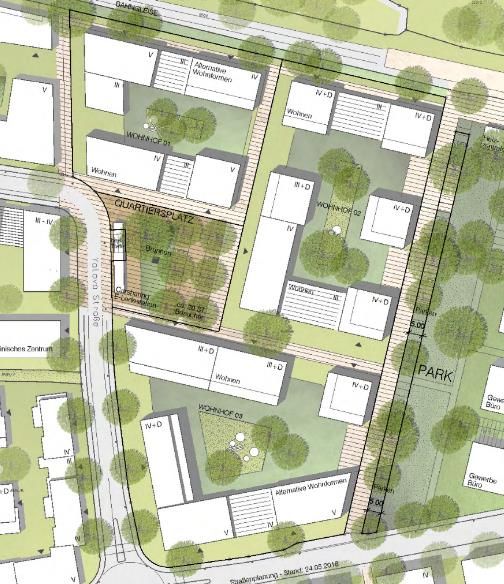
Disclaimer (I)

    recipients should not purchase, subscribe for or otherwise acquire any securities of the Company. Any offer of securities in the Company will be made solely by means of, and on the
    basis of, a securities prospectus which is to be published. An investment decision regarding the publicly offered securities of Instone should only be made on the basis of the securities
    prospectus. The securities prospectus will be published promptly upon approval by the German Federal Financial Supervisory Authority (Bundesanstalt für Finanzdienstleistungsaufsicht)
    and will be available free of charge from Instone Real Estate Group AG, Grugaplatz 2-4, 45131 Essen, Germany, or on Instone’s website (www.instone.de).

    Certain financial information included in this presentation consists of “non-IFRS financial measures” and adjustments thereto. These non-IFRS financial measures and adjustments
    thereto may not be comparable to similarly titled measures presented by other companies, nor should they be construed as an alternative to other financial measures determined in
    accordance with IFRS. You are cautioned not to place undue reliance on any non-IFRS financial measures, adjustments thereto and ratios included herein.

    A portion of the information contained in this presentation, including market data and trend information, is based on estimates or expectations of the Company, and there can be no
    assurance that these estimates or expectations are or will prove to be accurate. Where any information and statistics are quoted from any external source, such information or statistics
    should not be interpreted as having been adopted or endorsed by the Company or any other person as being accurate. All statements in this report attributable to third party industry
    experts represent the Company's interpretation of data, research opinion or viewpoints published by such industry experts, and have not been reviewed by them. Each publication of such
    industry experts speaks as of its original publication date and not as of the date of this presentation.

2       |   Oct. 2020     |    Company presentation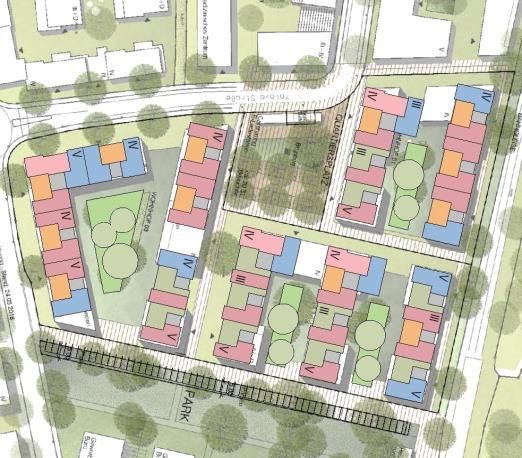
Disclaimer (II)

    This presentation and any materials distributed in connection with this presentation are not directed to, or intended for distribution to or use by, any person or entity that is a citizen or resident or
    located in any locality, state, country or other jurisdiction where such distribution, publication, availability or use would be contrary to law or regulation or which would require any registration or
    licensing within such jurisdiction. This presentation does not constitute an offer to sell, or a solicitation of an offer to purchase, any securities in the United States. The securities described herein have
    not been, and will not be, registered under the U.S. Securities Act of 1933, as amended (the “Securities Act”), and may not be offered or sold in or into the United States, except pursuant to an
    exemption from, or in a transaction not subject to, the registration requirements of the Securities Act. In the United States, this document is directed only at persons reasonably believed to be “qualified
    institutional buyers” as defined in Rule 144A under the Securities Act.

    In member states of the European Economic Area (“EEA”), the placement of shares described in this presentation is only directed at persons who are 'qualified investors' within the meaning of Article
    2(e) of the Regulation (EU) 2017/1129 of the European Parliament and of the Council of 14 June 2017 (as amended, the “Prospectus Regulation”) (“Qualified Investors”). In the United Kingdom, the
    placement of shares described in this presentation is only directed at persons who (i) are investment professionals falling within Article 19(5) of the Financial Services and Markets Act 2000 (Financial
    Promotion) Order 2005, as amended (the “Order”), or (ii) are persons falling within Article 49(2)(a) to (d) of the Order (high net worth companies, unincorporated associations, etc.) (all such persons
    together being referred to as “Relevant Persons”). This document is directed only at Relevant Persons and must not be acted on or relied on by persons who are not Relevant Persons. Any investment
    or investment activity to which this document relates is available only to Relevant Persons and will be engaged in only with Relevant Persons.

3       |    Oct. 2020       |    Company presentation
01 Key Investment Highlights 06 Outlook
02 Q2-2020 Highlights and 07 Valuehome: Growth Persepective
Key Rights Issue Terms
03 Background of the Offering Market Environment
08
Portfolio Update 09 Appendix
04
05 Q2-2020 Financial PerformanceKey Investment Highlights
Investment Highlights
    1.       Leading German residential developer as key beneficiary of structural housing shortage
              • Top3 market position on basis of nationwide platform: attractive land bank with focus on the Top 8 cities
              • Strong in-house expertise and coverage of entire value chain (from acquisition to construction management) as competitive
                edge, reflected in industry leading gross margins (32.2% in H1-2020)

    2.       Secured project pipeline with GDV of €5.7bn provides high earnings visibility
              • Gross development value (GDV) of €5.7bn (thereof €2.3bn under or pre-construction, €2bn already sold) fully covers targeted
                revenues for the coming years
              • Future NAV (as of Q2) of c.€32.3 per share as indicates intrinsic value of current development portfolio
              • Earnings outlook 2020 of €90m translates into dividend yield of c.3% on diluted basis; significant growth potential

    3.       New innovative valuehome product promises step change in growth
              • Market entrance in the mid-market segment, a significantly undersupplied market with huge growth potential
              • Innovative, highly scalable product based on propriety planning technology with unrivalled low production costs
              • Major driver for strong targeted top line growth to €1.6-1.7bn mid-term (2020: €0.9-€1.0bn)

    4.       Strong balance sheet as sound foundation (net debt/EBITDA: 2.8x) for sustainable growth

    5.       Highly experienced management as major success factor (opportunities and risk management)

6        |    Oct. 2020   |   Company presentation
Proven track record of 29 years
First mover in building up a
nationwide residential developer
>1 million sqm platform in Germany
Successfully developed and
Focus on developing modern, urban,
marketed since 1991
8 branches + HQ multi-family, residential buildings
Established operating platform with
Presence in all German ability to achieve further scale gains
Management team metropolitan regions
Attractive project portfolio and
with a proven track record identified acquisition opportunities
of >40 years of value generation underpinning strong and profitable growth
~390 employees
Prudent approach to risk management
as of 30/06/2020 Proprietary and tailored management
~€5.7bn information system
GDV project portfolio Diligent site selection criteria leading to
as of 30/06/2020 attractive and consistent returns
7 | Oct. 2020 | Company presentationCovering the Entire Value Chain with Deeply Rooted
Construction Expertise
Planning
Acquisition application Sales Construction Completion
Internal/external Internal/external External
Fully in-house experts sales teams contractors
€€€€€
No speculative High building density 30% pre-sale hurdle Strong construction Positive track-record
land banking assessment rate prior to construction management background concerning on time deliveries
Average phase
duration
6 to 12 months 12 to 40 months Dependent on project size and potential phasing
8 | Oct. 2020 | Company presentationWe strive to become the No.1 German homebuilder with a
view to industrialising products and processes
Coverage of all relevant market segments;
industrialised products and processes
Launch of valuehome product
Leading developer focused on key metropolitan areas
Today Future strategy
9 | Oct. 2020 | Company presentationQ2 Highlights and Key Rights Issue Terms
Highlights
Sales recovery underscores attractiveness of business model; sound fundamentals persist
Temporary sales decline attributable to COVID-19 impact; sales ratio now fully normalised
Restart of acquisition activities in June (2 projects, GDV of €187m GDV)
Operational
Construction starts since beginning of June (3 projects; sales volume €234.5m); sales starts (1 project,
Highlights
sales volume €36.3m – several projects in pre-marketing phase with strong indications of interest)
Lower funding costs: refinancing of €75m term loan (5%) via €100m promissory note (4.0%, 5 yrs)
Q2-2020 results heavily affected by COVID-19 pandemic
Adjusted revenues: €179.6m (+3.1% yoy; H1-2019: €174.2m)
Adjusted gross profit margin: 32.2% (H1-2019: 33.6%)
H1- 2020
Results Adjusted EBIT: €28.2m (H1-2019: 31.9m; -11.6%)
Adjusted earnings after tax (EAT): €13.7m (H1-2019: €25.1m; -45.4%)
FY 2020 a transitional year – Positive outlook for FY-2021 reiterated
Reinstating 2020 profit forecast: Adjusted revenue and adjusted EAT target of €470-500m and €30m-€35m
2021 outlook reiterated: adjusted revenues of €900.0m-€1.0bn; adjusted EAT of at least €90.0m
Outlook
Target payout-ratio: 30% of net profit (starting for FY 2020)
Capital increase to fund targeted step-change in growth; mid-term revenue target raised to €1.6bn-1.7bn
11 | Oct. 2020 | Company presentationOverview of Transaction
Capital raising to fund a step change in growth
Type Fully underwritten rights issue
Subscription ratio 15:4
Subscription price €18.20 per share
Net proceeds Approx. €175m
Discount to TERP* 23.1%
Ex-rights day Tuesday, 01/09/2020
Subscription period Tuesday, 01/09/2020 – Monday, 14/09/2020 - 5.30 p.m.
Rights trading Tuesday, 01/09/2020 – Wednesday 09/09/2020 – about 12:00 (noon)
Rump placement (if any) Tuesday, 15/09/2020
Use of Proceeds Funding a step-change in growth – target mid-term sustainable revenues of €1.6bn-1.7bn
Land investments equivalent to at least €1.5bn GDV
(i) accelerate valuehome initiative
(ii) take advantage of temporary opportunities to generate superior project returns
*Based on Instone Xetra volume weighted average price on 26 August 2020
12 | Oct. 2020 | Company presentationBackground of the Offering
Seizing short-term opportunities and investing for a
targeted step change in growth
1 2
Post COVID-19 market opportunity valuehome initiative provides for step change in growth
Sales ratio (%) at pre-COVID-19 levels* Substantial increase in INS addressable market
Long term Instone Sales ratio
5.0 Sales ratio 4.7
4.5 Sales ratio without package sale Rottenburg 4.1
4.0 3.4
# of households
3.5 3.13.23.0 3.3 3.1 2.8
2.8
3.0 2.6 2.5
2.4
2.6 2.6 2.6 €5,810
2.5 1.9
2.0 1.61.6 1.6 1.7 1.9
1.2 1.9
1.5 1.10.9 1.1
0.90.8 0.80.91.01.0
1.0 0.60.5 0.5 1.2 Social housing
0.5
0.0
1,500 3,000 4,500 6,000 …
household income €
INS valuehome INS core product
• Demand:
• Innovating every step of the development value
• Fully normalised retail sales ratio
chain – INS innovation leader in the industry
• Supply of land:
Reducing complexity highly
• Competition for projects currently less intense
Lowering production costs scalable
• Additional supply expected from commercial
Times savings product
projects that are no longer economically viable
Laying the foundation for industrialized
Stable land prices today potential to
development
HPI expected to resume in 18 to 24 months generate
superior Reaching critical price points for the
CPI to remain contained mid-term
returns development of a mass market
14 | Oct. 2020 | Company presentation *Sales ratio = weekly number of units sold/total number of units on offer (four week moving average)Fundamentals support near term investment
Funding a step change in growth; target sustainable mid term revenues of €1.6-1.7bn
Upgrading our mid-term revenue target
~€175m Equity raising
In €m
Use of proceeds 1,600-1,700
>1,000
900-1,000
Additional Seize attractive post
investment to COVID-19 market
accelerate opportunities in 470-500
valuehome growth core product
2020 2021 2022 ... Mid-term
Identified €4.3bn GDV opportunities
Approved/In Purchase €600m-€700m step-up over previously communicated “steady
negotiation discussion initiated state” revenue target
INS valuehome creates a unique secular growth opportunity
€1.3bn €3.0bn
15 | Oct. 2020 | Company presentationIdentified priority project acquisitions
Target incremental project acquisitions with >€1.5bn in GDV over the next 6-18 months
thereof
Management approval after
Termsheet negotiations Under active discussion
Region # of projects June 30, 2020 Total GDV
# GDV # GDV # GDV
Bavaria 3 1 65 2 160 - - 225
Rhine-Main 8 - - 3 270 5 1,990 2,265
Baden-
6 - - 1 150 5 400 550
Wurttemberg
NRW 6 - - 2 220 4 440 660
Hamburg 4 1 50 1 50 2 160 260
Berlin 1 - - 1 225 - - 225
Leipzig 1 - - 1 150 - - 150
Total 29 2 115 11 1,225 16 2,990 4,330
16 | Oct. 2020 | Company presentationUse of proceeds: Incremental land investments equivalent to
at least €1.5bn GDV
Illustrative funding of incremental land investments
~€310m >€1.5bn Equity will be used for the acquisition of incremental
Land GDV plots of land
Equity
€175m of equity eventually translates into incremental
40-50% GDV of >€1.5n
Debt
~80% Management expects to invest the proceeds within 6-18
~€175m Building months
50-60% Midterm revenue target raised to €1.6bn – €1.7bn p.a.
Equity
~20%
Land
17 | Oct. 2020 | Company presentationGerman residential prices showing strong resilience - winner of the crisis Recent data points/surveys show residential prices continue to move up • IMX (immoscout): Prices for new built condos up +1.3% in Q2 (qoq) • JLL: Residential prices up +9.3% in H1-20 in top 8 cities (yoy; vs. +6.7% in H1-19) • Hypoport, EPX*: Condo prices +5.0% YTD in Germany • vdp: German condo prices +2.9% in H1 (YTD) Financing markets remain supportive for residential demand • Bundesbank: Mortgage loans for private households +13% (yoy) in June (€22.8bn) • Interhyp: Interest costs for mortgage loans near all-time low (avg. 0.7-0.8% for 10 yrs.) *Europace house price index 18 | Oct. 2020 | Company presentation
Portfolio Update
Project Portfolio (as of 30/06/2020)
Significant share of pre-sold units support future cash flow and earnings visibility
                       Total portfolio by region (GDV)                                 Total portfolio by development (GDV)

                                              Munich
                               Berlin
                                               3.8%
                                5.1%                                                                                          1
                       Nuremberg
                         5.8%                                                                                                                  under
                                                                                                                                            construction
                                                                      Frankfurt
                   Hamburg                                             34.7%                                                                     20,6%
                    7.0%

              Stuttgart                  €5.7 billion
               8.1%
                                                                                                                                                     pre
                                                                                                                                                 construction
                     Leipzig                                                                                                                       20.2%
                      9.7%                                                          pre sale
                                                                                     59.2%
                                                               NRW
                                      Others 1                 14.2%
                                      11.7%

              „Others“ include Wiesbaden, Mannheim, Hannover, Potsdam, Bamberg    1thereof   3.6% of delivered volume of the project portfolio

               •     53 projects / 13,075 units                                    •     €2.3bn GDV pre-construction or under
               •     88% in metropolitan regions                                         construction
               •     ~80 sqm / unit                                                •     €1.2bn GDV under construction
               •     ~€5,400 ASP / sqm                                             •     €2.0bn of portfolio already sold (87% of
                                                                                         pre-construction and under construction)
                                                                                   •     €1.0bn of currently under construction
                                                                                         portfolio is sold (84%)
20   |   Oct. 2020     |     Company presentation
Q2-2020 Financial Performance
Adjusted Results of Operations
Q2 affected by COVID-19 effects – Recovery well underway
 €m                                   Q2-2020    Q2-2019   Delta    H1-2020   H1-2019   Delta

 Revenues                              79.9       90.0     -11.2%    179.6     174.2    3.1%     Q2-Revenues affected by reduced
                                                                                                 sales speed and postponed marketing
 Project cost                          -51.8      -58.6    -11.6%   -121.8    -115.7    5.3%
                                                                                                 launches due to COVID-19
 Gross profit                          28.1       31.4     -10.5%    57.8      58.5     -1.2%

 Margin                               35.2%      34.9%              32.2%     33.6%              Sustained high gross margins
                                                                                                 underscores resilient pricing
 Platform cost                         -18.0      -14.9    20.8%     -29.9     -26.2    14.1%
                                                                                                 environment as well as quality of
 Share of results of joint ventures     0.0       -0.4                0.3      -0.4              product pipeline
 EBIT                                  10.2       16.2     -37.0%    28.2      31.9     -11.6%   Moderately rising H1 platform costs
 Margin                               12.8%      18.0%              15.7%     18.3%              reflect investments into future
                                                                                                 growth (incl. valuehome)
 Investment and other result            0.2       -2.0               -0.6      -2.4

 Financial result                      -4.2       -0.6               -8.9      -3.1              Interest expenses in line with rising
                                                                                                 debt to finance land acquisitions
 EBT                                    6.2       13.6     -54.4%    18.7      26.5     -29.4%
                                                                                                 especially in H2-19
 Margin                                7.8%      15.1%              10.4%     15.2%

 Taxes                                 -1.1        3.7               -4.9      -1.4

 Tax rate                             -17.7%     27.2%              -26.2%     -5.3%
                                                                                                 Normalisation of tax rate: Low
 EAT                                    5.0       17.4     -71.3%    13.7      25.1     -45.4%   FY-19 taxes due to one-time effect

22    |   Oct. 2020   |   Company presentation
Decreasing Q2-sales due to COVID-19 impact
Concluded sales contracts y-o-y Concluded sales contracts – expected development in H2-2020
In €m In €m
>450
132
123
Sales launch
in H2
63 69 69
54 Sales launch
in H1
26 123
97
Q1 Q2 H1
Private Institutional H1-20 Expected Expected FY20e
sales sales private institutional
2019 2020 sales sales
H1 sales below previous year’s level following a good start to the year as COVID-19 impacts (sales speed, marketing launches have
been postponed)
Strong recovery (in private and institutional business) suggests rising sequential sales in H2
2020 sales volume target: >€450m
23 | Oct. 2020 | Company presentationEquity raising will strengthen INS balance sheet to
support secular growth
PF 30/06/2020 H1 LTC of 54.6% implies still moderate leverage
€m 30/06/2020 31/12/2019
adjustments PF*
Financial debt 600.0 +25.0 625.0 595.5 Reminder that inventories are recorded at
cost
thereof: Corporate debt 202.3 +25.0 227.3 180.8
thereof: Project debt 397.7 397.7 414.7 Hidden reserves provide additional downside
protection
Cash and cash equivalents -60.0 -200.0 -260.0 -117.1
H1 net debt/adjusted EBITDA of 4.2x reflects
Net financial debt 540.0 -175.0 365.0 478.4
temporary decline in profitability
Inventories and Contract asset 989.4 989.4 951.1
H1 Pro-forma for equity raising and debt refinancing:
LTC** 54.6% 36.9% 50.3%
Adjusted EBIT (LTM)*** 125.9 125.9 129.6 net debt/adjusted EBITDA of 2.8x
Adjusted EBITDA (LTM)*** 130.0 130.0 133.7 LTC of 36.9%
Net financial debt / adjusted
4.2 2.8 3.6
EBITDA €1.6-1.7bn mid term revenue target fully funded with
capital raise
*PRO FORMA for c. €175m net proceeds from capital increase and €100m debt refi
**Loan-to-Cost: Net financial debt/ (Inventories + Contract assets)
***LTM: Last twelve months. Adj. EBIT/EBITDA for FY 2019 has been restated to align the adj. EBIT/EBITDA calculation to the changed definition used from January 1,
2020 onwards.
24 | Oct. 2020 | Company presentationFinancing structure further improved with issue of €100m
promissory note
Maturity profile PRO FORMA (refi term loan) Secured/unsecured debt PRO FORMA (refi term loan)*
In €m Corporate debt Project debt Corporate debt Project debt, secured
225
161
31.9%
112 63 100
98 28
68.1%
2020 2021 2022 2023 2024 2025
Issued €100m promissory note at 4.0% (5 years)
Weighted average corporate debt maturity 3.3 years
Redeemed €75m Term loan (5.0%, due 2023)
Weighted average corporate interest costs 3.13%
Share of total debt with floating interest 84.0% Cancelled €50m undrawn portion of Term loan
• Further reduced cost of corporate debt
• Termed out debt maturities
*Based on total available credit lines (drawn and undrawn)
25 | Oct. 2020 | Company presentationOperating Cash Flow
Expect positive operating cash flow for FY 2020 including new land investments
€m H1-2020 H1-2019
H1 operating cash-flow remains positive prior to
EBITDA adj. 30.2 33.9
new land investment
Other non-cash items 0.5 -4.4
Existing projects are fully self-funding
Taxes paid -7.1 -6.3
Expect positive operating cash (including new land
Change in working capital -61.4 -21.7 investments) for FY 2020
Operating cash flow -37.8 1.5 Substantial milestone payments from pre-
Land plot acquisition payments (incl. RETT*) 50.3 56.0
sold institutional projects in Q4
Operating cash flow excl. investments 12.5 57.4 Full recovery of retail sales
*RETT: Real Estate Transfer Tax
26 | Oct. 2020 | Company presentationStrong Liquidity Position (30/06/20)
Capital raising will further increase INS financial flexibility
ACTUAL PRO FORMA*
€m Total t/o drawn t/o available Total t/o drawn t/o available
Corporate debt
Term loan 125.0 75.0 50.0 0.0 0.0 0.0
Promissory note 106.0 106.0 0.0 206.0 206.0 0.0
Revolving Credit Facilites 124.0 20.0 104.0 124.0 20.0 104.0
Total 355.0 201.0 154.0 330.0 226.0 104.0
Cash and cash equivalents 60.0 260.0
Total corporate funds available 214.0 364.0
Project debt
Project finance** 611.9 400.4 211.5 611.9 400.4 211.5
*Figures pro forma for net equity proceeds of c. €175m; €100m new promissory note; €75m term loan redemption; €50m cancellation of undrawn term loan portion
**Net available project financing
27 | Oct. 2020 | Company presentation€1.8bn INS prospective NAV pro-forma for capital raise and
illustrative incremental land investment
Management expects capital raise to be accretive to NAV post investment
PRO FORMA Illustrative
NAV (€m) as of 30 June ACTUAL
pre-investment post-investment
Expected selling prices of Illustrative Calculation – key assumption
5,701 5,701 7,201
project pipeline (GDV)
€308m spent for land investments
Payments received -591 -591 -591
Expected project costs -3,204 -3,204 -4,104 Land plot acquisitions with expected sales
value (GDV) of €1.5bn
Net debt -540 -365 -672
Net Asset Value 1,366 1,541 1,834 Expected incremental project expenses
equivalent to ca. 60% of GDV
Adj. number of shares** (m) 39.3 47.0 47.0
Net Asset Value per share (€) 34.75 32.78 c. 39.0
Payments received reflect project related income
received to date from pre-sale of pipeline, rental
income and ordinary course sale of land plots
Expected project costs include future expected
payouts required to complete INS project pipeline
*Adjusted number of shares reflects bonus shares associated with rights issue as per IFRS calculation
28 | Oct. 2020 | Company presentationOutlook
Outlook
Strong structural growth ahead
€m Outlook 2020 Outlook 2021 Revenue (adjusted)
Revenues (adjusted) 470-500 900-1,000 In €m
1,600-1,700
Gross profit margin >28 n/a
(adjusted)
EAT (adjusted) 30-35 >90 >1,000
900-1,000
Volume of concluded >450 n/a
470-500
Sales contracts
Comments 2020 2021 2022 ... Mid-term
Planned payout ratio of 30% of adjusted EAT
Thereof from existing 100% 100% 100%
projects*:
FY-2020 a transitional year due to severe
temporary effects from the COVID-19 pandemic
Thereof from projects 93% 71% 57%
with building right*:
Revenues secured 78% 31% 28%
through pre-sales*:
* % figures as of 30 June 2020; referring to midpoint of guidance
30 | Oct. 2020 | Company presentationValuehome: Growth Perspective
Mid to long-term opportunity: valuehome
     Entering the largest and most under-served residential market in Germany: “valuehome”

          Instone's approach
          Adding a new pillar to the existing Instone platform based on standardisation, digital processes and significant scale potential
          with game changing implications for production costs and pricing
          Elements
          • Modular planning: move from prototyping to standardisation
          • Reduce complexities throughout the construction process; introduce lean construction management
          • Digital platform including digital distribution channel and configurator standardising client optionality
          • Focus on essentials: highly efficient floor plans, minimise costly underground construction
          • Maintain high architectural standards with modern designs and strong sustainability marks
          • Target increasingly attractive locations in B cities and in the commuter belts
          Target customer
          • Price points targeted to “lower mid markets” - between social housing and Instone's core business
          • Focus on institutional investors including municipal housing company‘s and professional landlords
          Key benefits
          • Substantially expand Instone's addressable market
          • Enter less competitive land market
          • Highly scalable, less complex low risk product with significant mid to long-term growth potential
          • Improve Instone's economics for existing “social housing” demands and competitive position in the current core business
          • Generate strong margins and highly attractive capital return

32    |   Oct. 2020   |   Company presentation
Addressing the most significant, largely untapped
customer group: mid- to lower income households
Instone Core Product:
Illustrative economics
Four-room-flat 110 sqm / 5,500 EUR/sqm
# of households
Purchase price: 665,000 € €5,810
incl. acquisition costs (~10 %);15% equity
1.0% interest rate / 2.0% amortisation
Running operational cost: 3 €/sqm month
1,743 € p.m. Social
housing
financial charge
5,810 € p.m.*
1,500 3,000 4,500 6,000 …
household income €
required household income INS Valuehome INS core product
► Significant customer potential and demand gap for Valuehome product
Notes:
* 30% of disposable income
33 | Oct. 2020 | Company presentationRental markets in B locations benefit from positive
spill-over effects
Average basic rent of a 80sqm flat Rental growth 2019 in % Rent (incl. ancillary costs) as % of
disposable household income
998 1.010
33,3%
28,5%
5,1%
23,6% 24,1%
586
517 3,8% 3,7%
2,5%
DÜS KÖLN MÖN DUI DÜS KÖLN MÖN DUI DÜS KÖLN MÖN DUI
Rent levels (in euro / as percent of household income) in Düsseldorf and Köln far exceed rents in B locations
Conversely, rents in more affordable cities i.e. Mönchengladbach, Duisburg show higher growth – reflecting a catch-
up in prices resulting from spill-over effects
INS is well positioned to capitalize on these spill-over effects, leveraging its established acquisition network
Notes:
B Locations: Düsseldorf, Köln, Mönchengladbach, Duisburg
34 | Oct. 2020 | Company presentationDemanding challenges for cost-effective housing
solutions
Cost efficiency requirements Key challenges
Highly fragmented market
General building law and social
Simplification of Product housing pre-requisites are
regulated on state level
Standardisation of Planning Additional municipal statutes
exist in each city (e.g. parking
spaces)
“Industrialisation” of Highly qualified staff required due
Development and Construction to individual prototyping, complex
construction process and
customer individualisation
Low innovation spirit of
construction industry
►Instone´s nationwide platform with long-term experience and in-depth development expertise
offers opportunity to fill demand gap for valuehome product
35 | Oct. 2020 | Company presentationUnrivalled 2,000€/m² total production costs achievable
Around 25% cost saving potential
Reduction of total production cost
including planning, marketing, sales
€ Around 25% etc. from ~ 2,800€/m² to c
cost saving 2,000€/m² - 2,300€/m²
potential
Ancillary costs Cost savings by standardisation
Selling expenses (-50%)
~50% of selling expenses
Personnel expenses (-50%)
~50% of personnel expenses
Planning costs (-50%)
~50% of planning costs
Outdoor facilities
~20% reduction of building costs
Building costs (-20%)
Reducing underground construction
Optimised floor planning
Standardisation of materials
Preparation costs
Land acquisition
Further potential
“INDIVIDUAL” “MODULAR”
Prefabrication
Scalability potential
“PROJECT COSTS”
36 | Oct. 2020 | Company presentationConsiderable savings in project duration resulting in
superior project IRR
Up to 30 %
time saving
Time savings
potential
~ 6m of planning and approval
process
Up to 12m of construction process
“MODULAR”
Additional potential
Land acquisition.................................................................Handover
Prefabrication / industrialisation
“INDIVIDUAL” reaching critical mass in scale
Type approval
“PROJECT DURATION”
37 | Oct. 2020 | Company presentationHighly attractive project economics
Project related economics
• Standardised planning and simplified execution provides for
attractive economics in smaller size projects
Project Size €30-50m
• Projects gross margins expected to be lower compared to target
margins for INS core product
Target gross margin ~20% • Lower margin reflects reduced capital intensity and risk profile of
valuehome product
In line with • EBIT margin in line with core product
Target EBIT margin • Standardized planning and more efficient / repetitive construction
core product works allow for leaner valuehome plattform vs INS core product
• Acclerated planning, reduced complexity, minimized underground
Exceeding construction as well as sales more geared towards institutions
Target IRR/ ROCE results in improved project IRR and superior ROCE
core product
Notes:
* Excluding corporate overhead allocation
38 | Oct. 2020 | Company presentationIllustrative valuehome cash flow profile vs INS core product
100%
Notarised land
acquisition
Start of sales
and marketing
Start of
construction
Construction
completion
Sales
completion 1) „valuehome“
90%
pre sale phase 8 month
80%
sales phase 30 month
70%
construction phase 18 month
60%
50% project duration 36 month
40%
30%
20%
10%
0%
Notarised land Start of sales Start of Construction Sales
100%
acquisition and marketing construction completion completion
2) „Instone core product“
90%
pre sale phase 20 month
80%
70%
sales phase 30 month
60% construction phase 24 month
50%
project duration 50 month
40%
30%
20%
10%
0% Sales development Cash inflows
Revenue development Cash outflows
39 | Oct. 2020 | Company presentationInnovative modular and highly standardised
planning concept
5-ROOM
108 SQM
Modular housing groundplan kit
Gapless BIM-based planning process 4-ROOM
89 SQM
Fully integrated technical planning
Realtime mass and cost calculation 3-ROOM
78 SQM
Standardised tender documents
Digital interface to fit-out configurator
1-ROOM
► Exceptionally rapid and highly efficient 35 SQM
planning process with consistent quality
4-ROOM
95 SQM
2-ROOM
56 SQM
40 | Oct. 2020 | Company presentationThe modular planning process is the foundation of
our new product
Illustrative simulation of modular planning approach applied to Project Rottenburg
PLANNING PHASES
LPH1 LPH2 LPH3 LPH4 LPH5
basic evaluation sketches groundplans application details
INDIVIDUAL LEVEL OF DETAIL
PLANNING
PROCESS
1 3 5 7 9 12 months
6m Buildingpermit
PLANNING PHASES
LPH1-
LPH5
LEVEL OF DETAIL
MODULAR mass calculation
Incl. cost calculation
PLANNING tender documents
PROCESS
1 2 months
6m Building permit
► INS Modular product uses BIM based standardized planning to reduce time and costs
41 | Oct. 2020 | Company presentationMore easily scalable construction and potential for
industrialized production processes
Instone Instone Valuehome
Lean construction process
core
increase of efficiency incl. underground excl. underground
product parking parking
Lower cost risks due to standardisation
6
Standardised product leads to continuous
improvement process
Months
12
Reduction of complexity leads to lower
personnel expenses (also after-sale)
18
24
Ground-work operation Shell construction Finishing and interior fittings
42 | Oct. 2020 | Company presentationComparison of products
Traditional Instone Product Instone Valuehome
Lower to mid-price segment
Mid to high price segment
Positioning between social housing and
Price No Luxury
Selling price €4,000/sqm – 9,000/sqm Instone core product
Selling price up €3,000/sqm – 5,000/sqm
Highly customised Highly standardised
Typically includes substantial underground Minimising costly underground construction
Complexity construction (e.g. parking space) (e.g. parking space)
Medium to high level of customer optionality Low level of customer optionality
Focused on largest and fastest growing Focused on B locations in and around
metropolitan areas (A cities and attractive B metropolitan areas
Location cities) Certain B cities in commuter belts
Mainly targeting coveted inner-city locations Typically well-connected suburban locations
Project size >€50m
Project size >€20m
Preference for development of entire
Project size Less complex projects; lower share of
residential quarters; typically including
masterplanning processes
masterplanning process
Municipal housing companies
Mid- to high income owner occupiers Institutional investors
Target
Affluent buy-to-let investors Professional landlords
Customer Institutional investors Affluent buy-to-let investors
To a lesser extent owner occupiers
43 | Oct. 2020 | Company presentationInstone has a clearly defined path to rolling out the
valuehome product
INS valuehome is a highly scalable new product based on proprietary modular planning
technology
• first step towards industrialising the entire development value chain
• address the largest end customer segment by income and substantially increase INS‘s
addressable market as well as long term revenue potential
Expect to create a clear competitive advantage for INS
• INS valuehome production costs are unrivalled in the market at €2,000 – 2,300/sqm
• management believes valuehome product development is c 2-3 years ahead of
competition
The new product is highly synergistic to the established nationwide INS platform
• sourcing of attractive projects in and around our current focus markets
• improve economics of social housing sections in our existing projects
Roll out has started – more acquisitions to follow
• INS project pipeline already includes 4 valuehome projects
• acquisition teams have identified > €500m GDV of suitable valuehome projects
44 | Oct. 2020 | Company presentationMarket Environment
Structural demand growth supported by net immigration
Population growth, indexed 2015=100 German households and net migration development
EU19 D FR SP IT Net migration Total households
In k In k
103%
1200 43,000
2019-2035
+ ~1m 42,500
102% 1000
42,000
41,500
800
101% 41,000
600 40,500
100% 40,000
400
39,500
99% 39,000
200
38,500
0 38,000
98%
2015 2016 2017 2018 2019
Germany outperforms the EU19 average Number of households with positive underlying trend due to further
net migration and increase in number of single-person households
Source: Eurostat Source: destatis, DB Research
46 | Oct. 2020 | Company presentationBacklog of undersupply is further building up
Supply and demand imbalance in German residential market: No signs of easing
In k units Approved residential units Completed residential units Cumulative gap Demand
400
Ø demand p.a. of 341k units
350
300
250
200
375 360
348 347
150 313 ~314
278 285 287 293
~266
248
100 ~213
~157
50 ~93
0
2015 2016 2017 2018 2019
Source: supply - destatis (Fachserie 5 Reihe1, 10/07/2020), average demand 2016-2020 IW-Report 28/2019
47 | Oct. 2020 | Company presentationLending markets stay very supportive and German resi
still highly affordable
Mortgage loans: volumes still rising; rates at record lows Financial charges stable despite price appreciation
Volume Rolling 4quarters Interest Financial charge p.m. Housing prices €/qm
In €m In % In € Interest rates
80,000 4.5 5,000 4.5%
4.0 4,500 4.0%
70,000
3.5 4,000 CAGR
3.5%
+7.6%
60,000 3.0 3,500
3.0%
2.5 3,000
50,000 2.5%
2.0 2,500
2.0%
40,000 1.5 2,000
1.5%
1.0 1,500
30,000 1,000 1.0%
0.5
CAGR 0.5%
20,000 0.0 500
+1.1%
Q1/10
Q3/10
Q1/11
Q3/11
Q1/12
Q3/12
Q1/12
Q3/13
Q1/14
Q3/14
Q1/15
Q3/15
Q1/16
Q3/16
Q1/17
Q3/17
Q1/18
Q3/18
Q1/19
Q3/19
Q1/20
0 0.0%
2010 2011 2012 2013 2014 2015 2016 2017 2018 2019
Source: Deutsche Bundesbank as of 02/09/2020, total volumes of residential mortgage Source: Bulwiengesa housing prices for new multi-family flats (04/2020), Deutsche Bundesbank as
loans to households, effective interest rate for mortgage loans with maturities >5-10 of 02/09/2020, weighted interst rates for loans with an initial rate fixation >5-10 years, calculation of
years financial charge based on assumption of inital amoritsation of 2% and 15% equity
48 | Oct. 2020 | Company presentationPositive price trend also in COVID environment underpins
strength of the asset class
Price development in Germany, indexed 2010=100
In % Housing prices Rents Construction cost Consumer price index
220
CAGR 16-20
+7.9%
200
180
CAGR 16-20
160 +3.3%
140 CAGR 16-20
+3.6%
120
CAGR 16-20
+1.3%
100
2010 2011 2012 2013 2014 2015 2016 2017 2018 2019 2020
Source: Bulwiengesa (10/2020) house prices and rents for new flats in German A-Cities, destatis (09/2020)
49 | Oct. 2020 | Company presentationAppendix
Income statement (reported)

 €m                                                     H1-2020   H1-2019

 Total revenue                                           168.9     171.0
 Changes in inventories                                  54.3      48.4
                                                         223.2     219.3

 Other operating income                                   4.6       2.6
                                                                            Cost of materials including land price payments and corresponding ancillary
 Cost of materials                                      -162.2    -160.5
                                                                            costs of around €50.6m for previously secured projects.
 Staff costs                                             -20.0     -16.5
 Other operating expenses                                -13.6     -12.0    lncrease in staff costs reflects the increase in FTEs to 323.1 (H1-2019: 267.3).
 Depreciation and amortization                           -2.0      -2.0
 Earnings from operative activities                      30.1      30.9

 Income from associated affiliates                        0.3      -0.4
 Other net income from investments                       -0.6      -1.9

 Finance income                                           0.0       0.7
 Finance costs                                           -12.0     -6.2     The increase of finance costs is related to the increase in gross debt due to
 Changes of securities classified as financial assets    -0.1       0.2
                                                                            investments in new land acquisition.

 EBT                                                     17.7      23.3
                                                                            In H1-2019 tax rate was positively influenced by a special effect associated with
 Income taxes                                            -4.7      -0.4
                                                                            the first-time recognition of loss carryforwards.
 EAT                                                     13.0      22.9

51    |   Oct. 2020   |   Company presentation
Condensed balance sheet
€m 30/06/2020 31/12/2019
As at 30 June 2020, inventories increased to €786.5m (31/12/2019: €732.1m)
Non-current assets 19.7 20.4
due to construction progress as well as land acquisitions of €50.6m.
Inventories 786.5 732.1
Contract assets 202.9 219.0 Receivables from customers for work-in-progress (contract assets) already
Other receivables 37.3 34.7 sold and valued at the current completion level of development fell to €491.4m
Cash and cash equivalents 60.0 117.1 (31/12/2019: €479.4m) due to the increased completions. Advance payments
from customers amounted to €292.9m (31/12/2019: €266.9m).
Current assets 1.086.7 1.102.9
Total assets 1.106.4 1.123.4
The decline in contract assets is due to the greater increase in advance
payments received in relation to construction progress.
Total equity 323.2 310.2
Financial liabilities 253.6 451.6 Non-current financial liabilities fell to €253.6 million as of 30 June (31/12/2019:
Other provisions and liabilities 26.7 26.6 €451.6m). Current financial liabilities increased to €346.4m (31/12/2019:
Deferred tax liabilities 13.0 12.0 €143.9m). Corporate financing of €75.0m and also a project financing of
€134.3m were reclassified from non-current to current financial liabilities.
Non-current liabilities 293.4 490.2
Financial liabilities 346.4 143.9
Trade payables 64.5 87.6 Trade payables decreased to €64.5m (31/12/2019: €87.6m) and essentially
Other provisions and liabilities 79.0 91.5
comprise the services provided by contractors.
Current liabilities 489.9 323.0
Total equity and liabilities 1.106.4 1.123.4
52 | Oct. 2020 | Company presentationTypical Project Cash Flow Profile
Notarised land Cash inflow >
Start of sales Start of cash outflow Sales Construction
acquisition
and marketing construction completion completion
100%
90%
Cash
80% inflows
70%
Completion in %
Sales ratio
60%
50% Cash Instone uses MaBV
outflows framework to achieve
40% 30% pre-sales at
construction start
30%
20%
Initial planning
10% costs
0%
(10)%
1 3 5 7 9 11 13 15 17 19 21 23 25 27 29 31 33 35 37 39 41 43 45 47 49
Month
53 | Oct. 2020 | Company presentationDevelopment of Project Portfolio
Project portfolio development (ytd) (GDV, €m)
€5.846m -€275m €187m -€16m -€40m €5.701m
12/2019 Completed projects New Approvals Deduction Change in sales 06/2020
volume
54 | Oct. 2020 | Company presentationUnits under Construction and Concluded Sales Contracts
Units under construction Concluded sales contracts (€m)
1,403
2,138
2,059 2,046
1,757
1,614
463
360
132 123
2017 2018 2019 Q1/2020 Q2/2020 2017 2018 2019 H1/2019 H1/2020
55 | Oct. 2020 | Company presentationProject Portfolio Key Figures €m Q2 2020 Q1 2020 Q4 2019 Q3 2019 Q2 2019 Q1 2019 Volume of sales contracts 54.1* 69.4 1,088.2 183.1 69.0 62.8 Project Portfolio (as of) 5,701.3 5,744.4 5,845.7 5,384.1 5,091.7 4,790.2 thereof already sold (as of) 2,017.1 2,189.0 2,174.0 1,261.1 1,128.7 1,061.1 Units Q2 2020 Q1 2020 Q4 2019 Q3 2019 Q2 2019 Q1 2019 Volume of sales contracts 347* 109 2,063 380 120 170 Project Portfolio (as of) 13,075 12,952 13,715 12,233 11,628 11,041 thereof already sold (as of) 4,648 4,799 4,814 2,944 2,684 2,564 (Unless otherwise stated, the figures are quarterly values) *Of which €24.3m (303 units) from updated business plan of already sold project Westville. 56 | Oct. 2020 | Company presentation
H1-2020 – Revenue Contribution (Top Projects)

                                                                   Adj. Revenues
Project                                          City
                                                                        (€m)

St. Marienkrankenhaus                            Frankfurt a. M.            30.0

Schumanns Höhe                                   Bonn                       22.1

Quartier Stallschreiber Straße - Luisenpark      Berlin                     15.9

west.side                                        Bonn                       15.8

Westville                                        Frankfurt a. M.            10.5

Franklin                                         Mannheim                    9.7

City-Prag - Wohnen im Theaterviertel             Stuttgart                   7.4

Schulterblatt "Amanda"                           Hamburg                     6.9

Schwarzwaldstraße                                Herrenberg                  6.6

Theaterfabrik                                    Leipzig                     5.5

Others                                                                      49.3

Total                                                                     179.6

57   |    Oct. 2020   |   Company presentation
H1-2020 – Concluded Sales Contracts (Top Projects) Project City Units €m Westville* Frankfurt a. M. 303 24.3 St. Marienkrankenhaus Frankfurt a. M. 19 21.8 Grundstück Bonn, Schumanns Höhe Bonn 45 17.2 Herrenberg, Schwarzwaldstraße Herrenberg 27 12.8 Schulterblatt "Amanda" Hamburg 14 9.9 „Carlina Park“, Schopenhauerstraße Nürnberg 19 8.7 Quartier Stallschreiber Straße - Luisenpark Berlin 8 6.0 Theresienstraße München 1 4.8 „Neckar.Au Viertel“ Rottenburg 11 4.4 Marina Bricks Regensburg 6 3.9 Others 3 9.7 Total 456 123.5 *€24.3m (303 units) from updated business plan 58 | Oct. 2020 | Company presentation
Construction Launches (30/06/20)

                                                              Exp. Sales
Project                                          City                       Units
                                                               Volume

Schulterblatt "Amanda"                           Hamburg             ~ 93       ~ 165
Schorndorf, S`LEDERER                            Schorndorf          ~ 87       ~ 230

Total                                                               ~ 180       ~ 395

59   |    Oct. 2020   |   Company presentation
Sales Offer as of 30/06/20 (Top Projects)
Sales volume
Project City Units Already sold in %
(€m)
St. Marienkrankenhaus Frankfurt a. M. 62.4 50 67%
„Carlina Park", Schopenhauerstr. 10 Nürnberg 58.3 84 13%
Schulterblatt „Amanda" Hamburg 57.0 74 36%
Scholle 1 Düsseldorf 33.9 58 6%
„Neckar.Au Viertel“ Rottenburg 19.8 55 18%
Marina Bricks Regensburg 13.5 19 54%
Schwarzwaldstraße Herrenberg 13.3 28 73%
Quartier Stallschreiber Straße - Luisenpark Berlin 12.3 11 90%
Others 2.8 6
Total 273.4 385
60 | Oct. 2020 | Company presentationProject Portfolio as of 30/06/20
(projects > €30m sales volume, representing total: ~ €5.6bn)
Sales volume Land plot Building right Sales Construction
Project Location
(expected) acquired obtained started started
Hamburg
Schulterblatt "Amanda" Hamburg 95 Mio. €
Kösliner Weg Norderstedt-Garstedt 102 Mio. €
Sportplatz Bult Hannover 120 Mio. €
Rothenburgsort Hamburg 183 Mio. €
Büntekamp Hannover 95 Mio. €
Berlin
Quartier Stallschreiber Straße / Luisenpark Berlin 236 Mio. €
Wendenschlossstr. Berlin 52 Mio. €
Rote Kaserne West Potsdam 49 Mio. €
NRW
Sebastiansraße / Schumanns Höhe Bonn 70 Mio. €
Niederkasseler Lohweg Düsseldorf N/A
Unterbach / Wohnen am Hochfeld Düsseldorf 172 Mio. €
Literaturquartier Essen 68 Mio. €
REME Mönchengladbach 105 Mio. €
west.side Bonn 187 Mio. €
Gartenstadtquartier Dortmund 100 Mio. €
Semi-filled circle means that the milestone has yet been achieved for sections of the project (land plot acquisition, start of sales or construction). Concerning the building right the semi-filled circle means
that the zoning process has been initiated. No circle for „land plot acquired“ means that the land has not yet been purchased but secured by contract.
61 | Oct. 2020 | Company presentationProject Portfolio as of 30/06/20
(projects > €30m sales volume, representing total: ~ €5.6bn)
Sales volume Land plot Building right Sales Construction
Project Location
(expected) acquired obtained started started
Rhine-Main
Wiesbaden-Delkenheim, Lange Seegewann Wiesbaden 111 Mio. €
Siemens-Areal Frankfurt 554 Mio. €
St. Marienkrankenhaus Frankfurt am Main 211 Mio. €
Friedberger Landstraße Frankfurt am Main 324 Mio. €
Elisabethenareal Frankfurt Frankfurt am Main 30 Mio. €
Steinbacher Hohl Frankfurt am Main 53 Mio. €
Gallus Frankfurt am Main 41 Mio. €
Westville Frankfurt am Main N/A
Aukamm Wiesbaden 149 Mio. €
Heusenstamm Heusenstamm 148 Mio. €
Leipzig
Semmelweisstraße Leipzig 73 Mio. €
Parkresidenz Leipzig 250 Mio. €
Rosa-Luxemburg-Straße Leipzig 114 Mio. €
Heide Süd Halle 38 Mio. €
Semi-filled circle means that the milestone has yet been achieved for sections of the project (land plot acquisition, start of sales or construction). Concerning the building right the semi-filled circle means
that the zoning process has been initiated. No circle for „land plot acquired“ means that the land has not yet been purchased but secured by contract.
62 | Oct. 2020 | Company presentationProject Portfolio as of 30/06/20
(projects > €30m sales volume, representing total: ~ €5.6bn)
Sales volume Land plot Building right Sales Construction
Project Location
(expected) acquired obtained started started
Baden-Wurttemberg
City-Prag - Wohnen im Theaterviertel Stuttgart 126 Mio. €
Franklin Mannheim 69 Mio. €
Schwarzwaldstraße Herrenberg 49 Mio. €
S`LEDERER Schorndorf N/A
Neckartalterrassen Rottenburg 147 Mio. €
Schäferlinde Herrenberg 56 Mio. €
Bavaria South
Ottobrunner Straße München 84 Mio. €
Beethovenpark Augsburg 58 Mio. €
Augsburg 2 Augsburg 51 Mio. €
Bavaria North
Schopenhauerstraße Nürnberg 67 Mio. €
Stephanstraße Nürnberg 65 Mio. €
Seetor Nürnberg 112 Mio. €
Eslarner Straße Nürnberg 50 Mio. €
Lagarde Bamberg 73 Mio. €
Semi-filled circle means that the milestone has yet been achieved for sections of the project (land plot acquisition, start of sales or construction). Concerning the building right the semi-filled circle means
that the zoning process has been initiated. No circle for „land plot acquired“ means that the land has not yet been purchased but secured by contract.
63 | Oct. 2020 | Company presentationInstone Share
Basic data Shareholder structure (August 2020)
• ISIN: DE000A2NBX80
Fidelity: 10.00%
Others:
• Ticker symbol: INS 54.32%
Janus Henderson: 6.96%
• No of shares: 36,998,336
• Index: SDAX T. Rowe: 6.10%
• Market cap* : €913.9m
Cohen&Steers: 5.24%
• Average daily trading
volume: €1.3m Capital: 4.87%
• Free float: 100% DWS: 3.24%
• Indices: SDAX Allianz: 3.20%
Amundi: 3.07%
• Market segment: Prime Standard,
Union: 3.00%
Frankfurt
* Based on closing price on 25/08/2020 at €24.70
64 | Oct. 2020 | Company presentationFinancial Calendar 2020 August 27 Group Interim Report for the first half of 2020 August 28/31 Virtual Roadshow September 2/4/9 Virtual Roadshow September 3 Commerzbank Corporate Conference September 7 Jefferies DE/EU Property Virtual Conference November 17-18 BNP EU Mid Cap CEO Conference November 26 Quarterly Statement for the first nine months of 2020 2021 March 18 Annual Report 2020 May 20 Quarterly Statement for the first quarter of 2021 November 11 Quarterly Statement for the first nine months of 2021 65 | Oct. 2020 | Company presentation
Investor Relations Contact

 Burkhard Sawazki
 Head of Business Development & Communication

 T +49 201 45355-137
 M +49 173 2606034
 burkhard.sawazki@instone.de

 Simone Cujai
 Senior Investor Relations Manager

 T +49 201 45355-428
 M +49 162 8035792
 simone.cujai@instone.de

                                                      Instone Real Estate Group AG
                                                        Grugaplatz 2-4, 45131 Essen
                                                E-Mail: investorrelations@instone.de
                                                          Internet: www.instone.de/en
66   |   Oct. 2020   |   Company presentation
You can also read