Fairfield Office and Retail Market Study - PREPARED FOR THE FAIRFIELD TOD STUDY SEPTEMBER 2018 BY W-ZHA, LLC - Town of Fairfield
←
→
Page content transcription
If your browser does not render page correctly, please read the page content below
2018

Fairfield Office and
Retail Market Study
PREPARED FOR THE FAIRFIELD TOD STUDY
SEPTEMBER 2018 BY W-ZHA, LLC
-1-

Table of Contents

Study Purpose and Defintions .............................................................................................................. 2
Economic Framework ........................................................................................................................... 6
The Office Market................................................................................................................................17
   Existing Conditions ................................................................................................................................ 17
   Local Market Potential .......................................................................................................................... 22
   East Fairfield County Market Potential ................................................................................................ 25
   Super-Regional Market Potential ......................................................................................................... 26
   Office Market Conclusions.................................................................................................................... 29
The Retail Market ...............................................................................................................................31
   Downtown Station Area ........................................................................................................................ 35
   Metro Center Station Area .................................................................................................................... 36
   Retail Prospects – Downtown Station Area ......................................................................................... 41
   Retail Prospects – Fairfield Metro Station Area .................................................................................. 46
   Retail Conclusions................................................................................................................................. 50
-2-

STUDY PURPOSE
This office and retail market analysis was conducted to inform a Transit-Oriented Development Study
initiated by the Town of Fairfield. Two stations areas are examined, the Downtown Fairfield Station
Area and the Metro Center Station Area. The market analyses summarize office and retail market
potential within three-quarters of a mile of these stations over the next 10 years.

DEFINITIONS
THE TOWN OF FAIRFIELD

The Town of Fairfield is located in Lower Fairfield County, otherwise known as Connecticut’s Gold Coast
for the wealth of its residents. The Town borders the City of Bridgeport and the towns of Trumbull,
Easton, Weston and Westport. The Town is home to both Fairfield University (enrollment
approximately 4,000) and Sacred Heart University (enrollment approximately 5,400).

                                          The Town of Fairfield

The Town is readily accessible via Interstate 95 and the Merritt Parkway as well as Route 8. Fairfield is
approximately 50 miles from New York City. Fairfield’s two train stations are on Metro North’s New
Haven line which provides service to New Haven, New York and points in between.

THE DOWNTOWN TRAIN STATION AREA

The Downtown train station is in the heart of Fairfield’s mixed-use downtown area. The Downtown
train station is operated by the Fairfield Parking Authority and is one of the busiest stations on the
Metro North New Haven line. The station has 1,100 surface parking spaces available to train riders.
Single family neighborhoods are within easy walking distance to the station.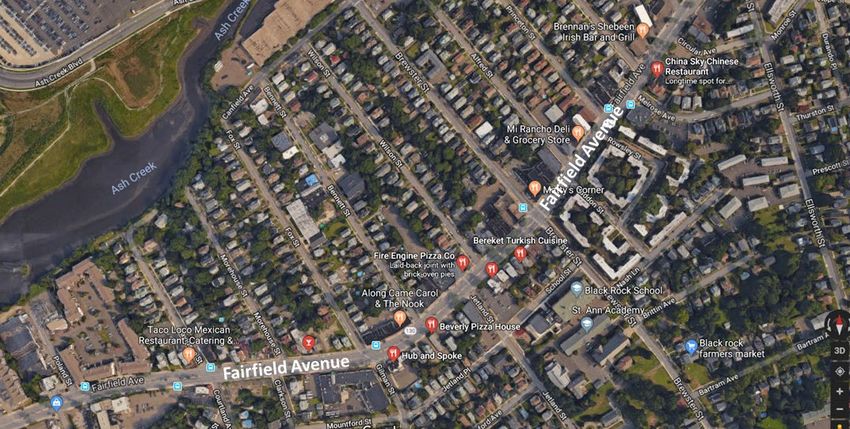
-3-
-4-

                                       The Downtown Station Area

Fairfield’s Downtown station is in the heart of the Fairfield’s Town Center. Fairfield’s downtown is
attractive and walkable with a plethora of restaurants, entertainment, shops and services. The
Downtown also contains several schools, government offices, and arts and cultural anchors. These uses
are mostly concentrated along Post Road (U.S. Route 1).

Within a three-quarter mile radius of the Downtown station is the 6.25 acre Exide Battery site. The site
is located on Post Road (U.S. Route 1). It abuts the railroad tracks and the Mill River. A brownfield, this
site is currently undergoing remediation. The Exide site is considered a potential western gateway to
Downtown Fairfield.

THE METRO CENTER STATION AREA

The Fairfield Metro Center is a new Metro North commuter rail station constructed by the Connecticut
Department of Transportation. The rail station is part of a 35-acre site with a master plan allowing for
one million square feet of office space with ancillary office space and a 175-room hotel. The site’s plan
and infrastructure development are the result of a public/private partnership involving the State of
Connecticut, the Town of Fairfield and a private developer.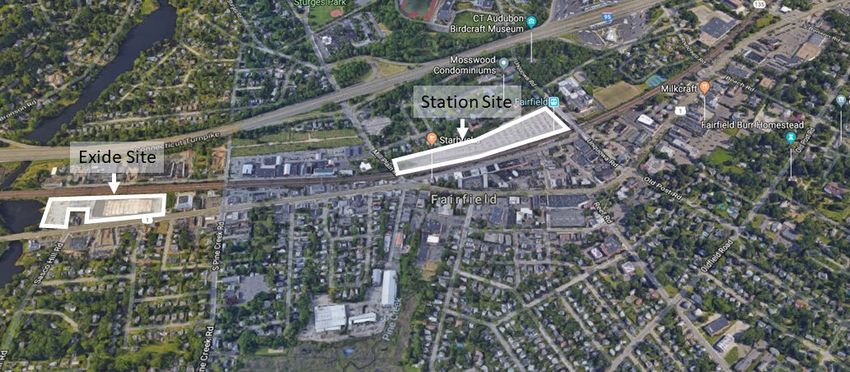
-5-
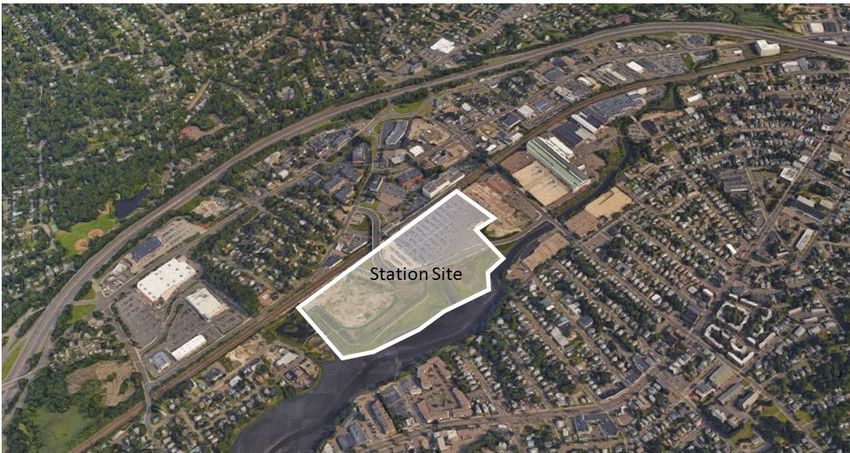
The Metro Center Station Area
With three interchanges off of I-95, regional vehicular access to the Metro Center site is very good. ,
There have also been improvements to Commerce Drive and a number of intersections to support
significant new development in the Metro Center Station Area.
Metro Center Site
Ash Creek Boulevard provides access to the 1,500-car commuter parking lot owned by the Connecticut
Department of Transportation. Near the station concourse, Ash Creek Boulevard is 35 feet higher than
the undeveloped portion of the site to the west and east. In the original Master Plan, parking garages
formed a platform upon which office and hotel uses were built to be at-grade with Ash Creek Boulevard.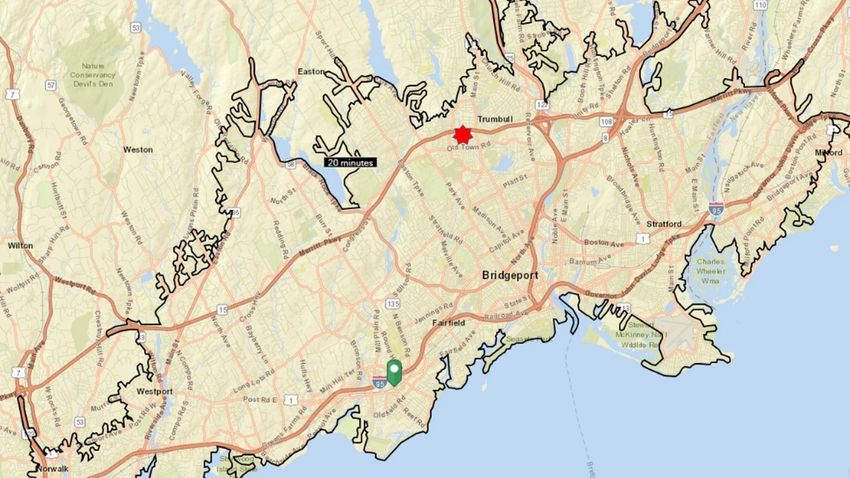
-6-

The Fairfield Metro Center is directly across Ash Creek from Bridgeport’s Black Rock neighborhood.
There is a plan to connect the “point” of the Metro Center site to the Black Rock neighborhood via a
pedestrian bridge at Fox Street.

The area surrounding the Fairfield Metro Center Station has a diverse mix of land uses. There are two
older, existing residential neighborhoods with single family homes as well as two- to three-family rental
units. There is a 70-unit condominium project across Kings Highway from the station. There is a new
apartment building (101-units) and another planned (--units) also within walking distance from the
Metro Center station.

While there is some residential use, the area around the station is mostly mixed-use commercial. There
is a new Whole Foods-anchored shopping center at the corner of Kings Highway and Grasmere Avenue
and another shopping center at the Route 1 circle. There is a BJ’s Wholesale Club and two Cineplex’s on
Brewster Street near the eastern entrance to the Station. For-lease and owner-occupied office space,
car dealerships, and restaurants are also present in the Metro Center Station Area.

ECONOMIC FRAMEWORK
DEMOGRAPHICS

According to estimates provided by ESRI, a national spatial and analytic company, there are 60,614
residents in the Town of Fairfield. The town accounts for 6.3 percent of Fairfield County’s population
(958,880).

                                                                Population and Household Trends
                                        Connecticut, Fairfield County, Stamford, Norwalk, Bridgeport, Town of Fairfield
                                                                        2000, 2010, 2018

                                                                                               Population
                                                                                                                      Change
                                                                                                     2000-2010                  2010-2018
                                                           2000        2010           2018          #       CAGR              #        CAGR
        Connecticut                                     3,405,565    3,574,097     3,631,470    168,532     0.48%          57,373      0.20%
        Fairfield County                                 882,567      916,829       958,883      34,262     0.38%          42,054      0.56%
        Stamford                                         117,103      122,643       135,232      5,540      0.46%          12,589      1.23%
        Norwalk                                           82,908      85,603         91,395      2,695      0.32%          5,792       0.82%
        Bridgeport                                       139,529      144,229       148,280      4,700      0.33%          4,051       0.35%
        Town of Fairfield                                 57,340      59,404         60,614      2,064      0.35%          1,210       0.25%
                                                                                            Households
                                                                                                                      Change
                                                                                                       2000-2010                2010-2018
                                                           2000        2010           2018            #       CAGR            #        CAGR
        Connecticut                                     1,301,670    1,371,087     1,384,848       69,417     0.52%        13,761      0.12%
        Fairfield County                                 324,232      335,545       346,445        11,313     0.34%        10,900      0.40%
        Stamford                                          45,404      47,357         51,371        1,953      0.42%        4,014       1.02%
        Norwalk                                           32,695      33,217         35,023         522       0.16%        1,806       0.66%
        Bridgeport                                        50,307      51,255         51,940         948       0.19%         685        0.17%
        Town of Fairfield                                 20,397      20,457         20,560          60       0.03%         103        0.06%

        Source: ESRI; W-ZHA
        F:\8000s, misc\82373 Fairfield\[demo.xlsx]pop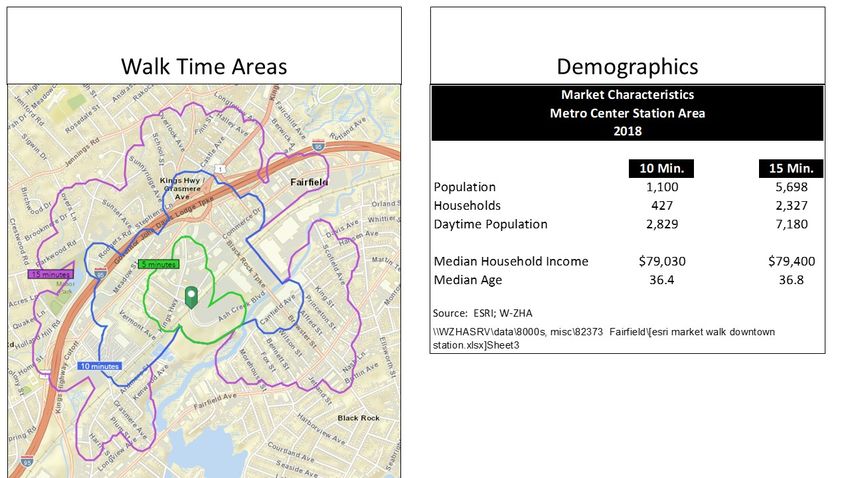
-7-

Fairfield County’s population and households have grown faster than the State since 2010. Forty
percent of the County’s household growth occurred in Stamford. Experiencing little household growth
since 2010, the Town of Fairfield accounted for less than 1 percent of the County’s growth from 2010 to
2018.

                                            Housing Stock
              Fairfield County, Stamford, Norwalk, Bridgeport, and the Town of Fairfield
                                       2012-2016 ACS Estimate

                                   100%
                                   90%                                                                    86%

                                   80%
              % of Housing Stock

                                   70%
                                   60%
                                   50%
                                   40%
                                   30%
                                   20%                                                                          14%
                                   10%
                                    0%
                                          Fairfield County   Stamford        Norwalk         Bridgeport   Town of
                                                                                                          Fairfield

                                                             Single Family    Multi-Family

                      Source: American Community Survey, 2012-2016 ACS Estimate; W-ZHA

The Town of Fairfield’s housing stock is predominantly single family homes (85 percent). Multi-family
housing constitutes a small share of the Town’s housing stock.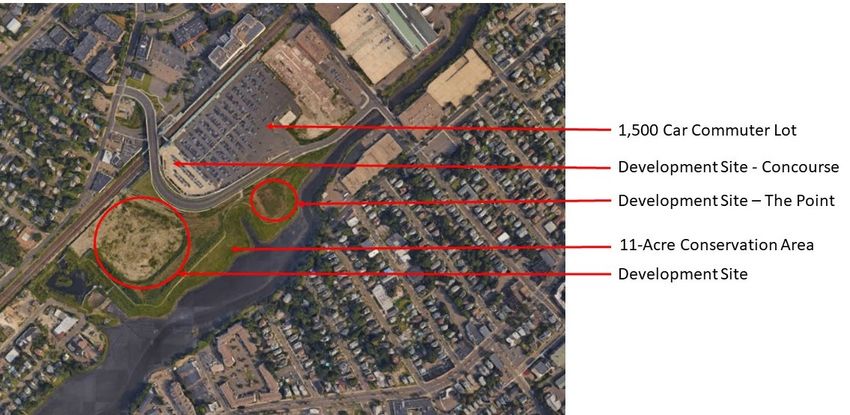
-8-

                                                                         Demographic Indicators
                                                  Connecticut, Fairfield County, Stamford, Norwalk, Town of Fairfield
                                                                                  2018

                                                                                             Fairfield                            Town of
                                                                            Connecticut      County      Stamford     Norwalk     Fairfield
Avg Household Size                                                              2.54           2.71         2.61        2.59        2.73
Median Age                                                                      41.3           40.6         38.3        39.4        40.9
Median Household Income                                                       $75,016        $90,961      $82,738     $81,250     $127,074
% Owner Occupied                                                               58.7%          59.4%        45.8%       53.0%       73.9%
                /1
Diversity Index                                                                  59.5             64.9     71.5         74.7        31.0

1. The Diversity Index measures the probability that two people from the same area will be from
different race/ethnic groups.
Source: ESRI; W-ZHA

Almost three-quarters of the Town of Fairfield’s household are home owners. The median age of a
Town resident is 40.9 which is slightly old than the County median age. The median household income
among Fairfield’s households is significantly higher than the State and County average. As indicated by
the Diversity Index, the Town of Fairfield is racially and ethnically homogenous.

                                                                            % of Residents 25 to 34 Years Old
                                                                                      Select Areas
                                                                                          2018
                                                        18%
               % of Population Age 25 to 34 Years Old

                                                        16%

                                                        14%

                                                        12%

                                                        10%
                                                                                                                        8%
                                                        8%

                                                        6%

                                                        4%

                                                        2%

                                                        0%
                                                              Fairfield County   Stamford     Norwalk    Bridgeport   Town of
                                                                                                                      Fairfield

                                Source: ESRI.; W-ZHA                                                                  demo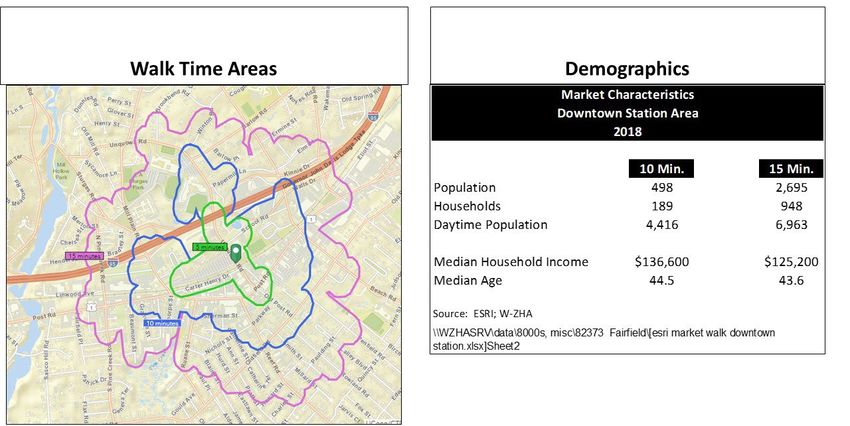
-9-

The Town of Fairfield has a much lower percentage of its population in the 25 to 34 year old age cohort
as compared to the County as a whole and surrounding cities. This could be a function of the Town’s
housing supply, which is predominantly single family residences.

                              Employed Population Over 16 Years of Age
                                           Select Areas
                                               2018

                                              White
                                             Collar /1      Services /2      Blue Collar /3
                  Fairfield County            68.5%           17.2%             14.4%
                  Stamford                    65.5%           20.5%             14.0%
                  Norwalk                     65.8%           19.5%             14.7%
                  Bridgeport                  47.6%           28.6%             23.9%
                  Town of Fairfield           81.5%           11.5%              7.0%

                  1. Include management/business/financial, professional, sales, and
                  administrative support occupations.

                  2. Service occupations include fire, police, and housekeeping services.
                  3. Blue collar occupations include construction, production,
                  installation/repair/maintenance and transportation.

                  Source: ESRI; W-ZHA

Over 80 percent of the Town’s employed residents over the age of 16 are in white collar occupations.
These occupations include management positions, professionals, sales personnel and administrative
support. Approximately 11% of employed residents are in sales and only 7% are in blue collar
occupations like construction, repair, production and transportation.
- 10 -
Where Employed Town Residents Work
2015
Share of
Resident
Travel to…for Work Workers
Stamford 10.0%
Norwalk 8.6%
Bridgeport 7.0%
Westport 5.9%
New York City 5.8%
New Haven 3.1%
Shelton 2.6%
Stratford 2.6%
Milford 2.2%
Trumbull 2.0%
Source: U.S. Census Bureau, OnTheMap Application and
LEHD Origin-Destination Employment Statistics; W-ZHA
According to Census data, there were approximately 22,900 employed persons residing in the Town of
Fairfield in 2015 (most recent data available for this dataset). 81 percent of these workers leave the
Town of Fairfield for work. 10 percent of the workers travel to Stamford for work, 8.6 percent of the
workers travel to Norwalk and 7 percent travel to Bridgeport. Less than 6 percent of resident workers
travel to New York City for work. Nineteen percent of the Town’s resident workers work in the Town of
Fairfield.
JOBS
According to Connecticut Department of Labor data, there were 25,159 jobs in the Town of Fairfield in
2017. The Town’s jobs are concentrated in the health care and social service, education, retail and
accommodation/recreation industries.- 11 -
Jobs by Industry
Town of Fairfield
2017
Industry Town of Fairfield
Construction 532 2.1%
Manufacturing 643 2.6%
Wholesale Trade 584 2.3%
Retail Trade 3,445 13.7%
Transportation/Warehousing & Utilities 351 1.4%
Information 116 0.5%
Finance & Insurance 873 3.5%
Real Estate and Rental & Leasing 432 1.7%
Professional, Scientific, & Technical Services 1,269 5.0%
Management of Companies & Enterprises 210 0.8%
Admin. & Support & Waste Mgmt. & Remed.
Services 1,443 5.7%
Educational Services 3,332 13.2%
Health Care & Social Assistance 4,187 16.6%
Arts, Entertainment, & Recreation 817 3.2%
Accommodation & Food Services 2,806 11.2%
Other Services (except Public Administration) 1,512 6.0%
Government 2,595 10.3%
Total 25,159 100.0%
Source: Connecticut Department of Labor; W-ZHA
F:\8000s, misc\82373 Fairfield\[demo.xlsx]town emp
Fairfield University and Sacred Heart University significantly contribute to the Town’s employment. The
Town of Fairfield has a much higher concentration of its jobs in education as compared to the State and
County. The Town also has a relatively high share of its jobs in retail, accommodations and food service.- 12 -
Jobs by Industry
Connecticut, Fairfield County, Town of Fairfield
2018
18.0%
16.0%
14.0%
Share of Jobs
12.0%
10.0%
8.0%
6.0%
4.0%
2.0%
0.0%
CT County Town of Fairfield
Source: Connecticut Department of Labor; W-ZHA
Many jobs were lost in Connecticut between 2000 and 2010 due to the Great Recession. The State,
County and the cities of Stamford, Norwalk and Bridgeport lost jobs during this timeframe and have yet
to recover to year 2000 employment levels. While the Town of Fairfield lost jobs from 2000 to 2010 it
has more than recovered from the Great Recession. The Town has 1,750 more jobs today than it did in
2000.
Jobs
Connecticut, Fairfield County, Stamford, Norwalk, Bridgeport, Town of Fairfield
2000, 2010, 2017
Change
2000-2010 2010-2017
2000 2010 2017 # CAGR # CAGR
Connecticut 1,673,134 1,596,050 1,669,766 (77,084) -0.47% 73,716 0.65%
Fairfield County 427,596 397,809 419,999 (29,787) -0.72% 22,190 0.78%
Stamford 83,167 67,995 76,052 (15,172) -1.99% 8,057 1.61%
Norwalk 46,166 42,844 44,680 (3,322) -0.74% 1,836 0.60%
Bridgeport 48,327 42,114 42,178 (6,213) -1.37% 64 0.02%
Town of Fairfield 23,409 23,362 25,159 (47) -0.02% 1,797 1.06%
Source: Connecticut Department of Labor, Employment and Wages by Industry (QCEW); W-ZHA
F:\8000s, misc\82373 Fairfield\[demo.xlsx]emp trend- 13 -
The Town of Fairfield had strong job growth between 2010 and 2017. Employment in the Town of
Fairfield has grown by almost 1,800 jobs since 2010, accounting for 8 percent of the County’s job
growth. During this time period, the Town of Fairfield grew by almost as many jobs as Norwalk, a city
with twice as many total jobs. Only Stamford grew jobs at a faster rate than Fairfield over this time
period.
The Town of Fairfield’s job growth since 2010 occurred mostly in the education, accomodation and food
services and administration and support 1 industries.
Jobs by Industry
Town of Fairfield
2000, 2010, 2017
Change
2000-2010 2010-2017
Industry 2000 2010 2017 # CAGR # CAGR
Construction 526 452 532 -74 -1.50% 79 2.33%
Manufacturing 1,623 633 643 -990 -8.98% 9 0.21%
Wholesale Trade 579 512 584 -67 -1.23% 72 1.89%
Retail Trade 3,400 3,184 3,445 -216 -0.65% 261 1.13%
Transportation & Warehousing 247 264 351 17 0.68% 86 4.12%
Information 457 190 116 -267 -8.40% -74 -6.81%
Finance & Insurance 1,003 957 873 -46 -0.47% -84 -1.30%
Real Estate and Rental & Leasing 314 349 432 35 1.07% 82 3.06%
Professional, Scientific, & Technical Services 1,811 1,605 1,269 -205 -1.19% -336 -3.30%
Management of Companies & Enterprises na na 210 na na na na
Admin. & Support & Waste Mgmt. & Remed.
Services 1,276 950 1,443 -326 -2.91% 493 6.15%
Educational Services 2,254 2,755 3,332 501 2.03% 577 2.75%
Health Care & Social Assistance 3,423 3,841 4,187 418 1.16% 346 1.24%
Arts, Entertainment, & Recreation 734 669 817 -65 -0.92% 148 2.89%
Accommodation & Food Services 1,735 2,248 2,806 513 2.62% 559 3.22%
Other Services (except Public Administration) 1,147 1,164 1,512 16 0.14% 349 3.81%
Government 2,475 2,867 2,595 392 1.48% -272 -1.41%
Source: Connecticut Department of Labor; W-ZHA
F:\8000s, misc\82373 Fairfield\[demo.xlsx]Sheet4
Since 2010, the Town has lost approximately 500 jobs in industries that typically occupy office space –
information, finance, insurance, real estate, professional, scientific, and technical services and
management of companies industries (“office-inclined industries”). In 2010 these office-inclined
industries accounted for 15 percent of the Town’s jobs. In 2017, jobs in these industries accounted for
12 percent of the Town’s jobs.
In the County employment in these industries accounted for 22 percent of total 2017 employment. In
Stamford office-inclined employment accounted for 38 percent of the city’s jobs. In Norwalk, these
1
The administration and support industry is part of the Administration and Support and Waste Management and
Remediation industry sector. According to the 2012 Economic Census most of the Town’s jobs in this industry
sector were in the administration and support industry. The administration and support industry includes
establishments that support the day-to-day operations of other organizations like general management, personnel
administration, clerical activities, and cleaning activities.- 14 -
industries accounted for 30 percent of the city’s jobs in 2017. As is evident by the industry mix, the
Town of Fairfield is not a regional business center.
Jobs by Industry
Stamford, Norwalk, Bridgeport, and Town of Fairfield
2017
Industry Stamford Norwalk Bridgeport Town of Fairfield
Construction 2,152 2.8% 1,226 2.7% 1,306 3.1% 532 2.1%
Manufacturing 2,118 2.8% 1,275 2.9% 3,254 7.7% 643 2.6%
Wholesale Trade 2,359 3.1% 1,643 3.7% 945 2.2% 584 2.3%
Retail Trade 6,476 8.5% 6,403 14.3% 3,126 7.4% 3,445 13.7%
Transportation/Warehousing & Utilities 1,826 2.4% na 0.0% 1,002 2.4% 351 1.4%
Information 5,154 6.8% 3,432 7.7% 473 1.1% 116 0.5%
Finance & Insurance 9,831 12.9% 3,367 7.5% 1,818 4.3% 873 3.5%
Real Estate and Rental & Leasing 1,435 1.9% 639 1.4% 500 1.2% 432 1.7%
Professional, Scientific, & Technical Services 8,596 11.3% 4,123 9.2% 1,100 2.6% 1,269 5.0%
Management of Companies & Enterprises 3,605 4.7% 1,726 3.9% 396 0.9% 210 0.8%
Admin. & Support & Waste Mgmt. & Remed.
Services 6,828 9.0% 2,592 5.8% 1,812 4.3% 1,443 5.7%
Educational Services 1,227 1.6% 347 0.8% 1,499 3.6% 3,332 13.2%
Health Care & Social Assistance 9,121 12.0% 6,115 13.7% 12,875 30.5% 4,187 16.6%
Arts, Entertainment, & Recreation 1,500 2.0% 1,460 3.3% 821 1.9% 817 3.2%
Accommodation & Food Services 5,737 7.5% 3,204 7.2% 2,179 5.2% 2,806 11.2%
Other Services (except Public Administration) 2,287 3.0% 1,772 4.0% 1,623 3.8% 1,512 6.0%
Government 5,754 7.6% 4,106 9.2% 7,412 17.6% 2,595 10.3%
/1
Total 76,052 44,680 42,178 25,159
/2
Office-Inclined Industry Employment 28,620 37.6% 13,287 29.7% 4,287 10.2% 2,900 11.5%
/3
Medical Office-Inclined Employment 2,891 3.8% 2,400 5.4% 3,624 8.6% 1,953 7.8%
1. Total employment includes non-classified industries and industries where employment data is suppressed due to confidentiality.
2. General office-inclined industries include information, finance and insurance, real estate, professional, scientific and technical services, and management of
companies.
3. Medical office-inclined industries are assumed to be medical offices - ambulatory health services. The data is an estimate based on ambulatory service employment
as a percentage of total health and social service employment in 2012.
Source: Connecticut Department of Labor; W-ZHA
F:\8000s, misc\82373 Fairfield\[demo.xlsx]towns dis
As compared to its neighboring cities, the Town of Fairfield’s employment is more oriented to services
and trade and less oriented to white collar industries.
The health care and social assistance industry sector includes ambulatory health care service jobs
(doctors’, dentists’, physical therapists’, psychiatrists’ offices, etc.), hospital jobs, jobs in nursing and
residential care facilities and social assistance jobs. Jobs in the ambulatory health care services typically
drive the medical office market.
The 2012 U.S. Economic Census details employment by industry subsector. This analysis has applied
each jurisdiction’s 2012 share of ambulatory health care workers to total health care and social
assistance workers to the 2017 data to estimate jobs in the ambulatory health care industry. In the- 15 -
Town of Fairfield 47 percent of the jobs in the health care and social services industry were in
ambulatory health care. These jobs account for 7.8 percent of the Town’s total jobs.
Job Projections
Fairfield County
2016 – 2026
470,000
460,000
450,000
440,000
430,000
Jobs
420,000
410,000
400,000
390,000
380,000
2000 2002 2004 2006 2008 2010 2012 2014 2016 2018 2020 2022 2024 2026
Source: Moody’s Analytics; W-ZHA
Moody’s Analytics projects employment for every county in the United States. Moody’s projects that
Fairfield County employment will increase by approximately 20,000 jobs between 2016 and 2026. This
translates into a compound average growth rate of 0.5% per year. This is a slower average annual
growth rate than that realized between 2010 and 2017 (0.8%).
The Moody’s Analytics employment data and the Connecticut Department of Labor data are slightly
different. This analysis has applied Moody’s 5-year average annual growth rates by industry to the
Connecticut Department of Labor data to develop employment projections for 2018, 2023 and 2028.
Using this methodology, employment in the County is projected to grow by approximately 19,350 jobs.- 16 -
/1
Modified Employment Projection
Fairfield County
2018, 2023, 2028
Change
000's of Jobs 2018 - 2028
Industry 2018 2023 2028 # CAGR
Construction 13,204 13,626 13,975 771 0.6%
Manufacturing 31,011 31,401 29,530 -1,482 -0.5%
Wholesale Trade 14,488 14,718 14,830 343 0.2%
Retail Trade 49,630 49,540 50,023 393 0.1%
Transportation/Warehousing & Utilities 10,200 10,589 10,460 260 0.3%
Information 12,676 11,954 11,918 -758 -0.6%
Finance & Insurance 33,421 33,308 34,363 942 0.3%
Real Estate and Rental & Leasing 5,364 5,366 5,219 -145 -0.3%
Professional, Scientific, & Technical Services 29,852 30,579 31,512 1,660 0.5%
Management of Companies & Enterprises 12,392 12,001 11,953 -439 -0.4%
Admin. & Support & Waste Mgmt. & Remed. Services 25,031 27,918 31,672 6,641 2.4%
Educational Services 11,593 12,001 11,930 338 0.3%
Health Care & Social Assistance 65,152 69,091 72,024 6,873 1.0%
Arts, Entertainment, & Recreation 10,482 10,108 10,167 -316 -0.3%
Accommodation & Food Services 32,992 34,770 36,365 3,373 1.0%
Other Services (except Public Administration) 19,008 19,234 19,256 249 0.1%
Government 44,566 43,728 45,214 647 0.1%
Total 421,063 429,933 440,412 19,349 0.5%
1. Applied Moody's Analytics compound annual growth rate projections to Connecticut Department of Labor 2017 Fairfield County
employment statistics.
Source: Connecticut Department of Labor; Moody's Analytics; W-ZHA
F:\8000s, misc\82373 Fairfield\[demo.xlsx]modified emp proj
The largest job gains over the next 10 years are projected to be in the administration and support
industry and the health care and social service industry sectors. The accommodation and food service
industry and the professional, scientific and technical service industries are projected to both projected
to grow at a faster rate than the overall average.
For those industries that typically occupy office buildings, employment growth is projected to be slow.
Employment in these industries is projected to decrease over the next 5 years and rebound after 2023.
Overall, for office-inclined industries jobs are projected to increase by an annual growth rate of 0.1%,
well below the overall growth rate of 0.5%.- 17 -
Office-Inclined Industry Employment Projection
Fairfield County
2018, 2023, 2028
Change
2018-2023 2023-2028 2018-2029
Industry 2018 2023 2028 # CAGR # CAGR # CAGR
Information 12,676 11,954 11,918 (722) -1.2% (36) -0.1% (758) -0.6%
Finance & Insurance 33,421 33,308 34,363 (113) -0.1% 1,055 0.6% 942 0.3%
Real Estate and Rental & Leasing 5,364 5,366 5,219 2 0.0% (147) -0.6% (145) -0.3%
Professional, Scientific, & Technical
Services 29,852 30,579 31,512 727 0.5% 933 0.6% 1,660 0.5%
Management of Companies &
Enterprises 12,392 12,001 11,953 (391) -0.6% (48) -0.1% (439) -0.4%
Total 95,724 95,231 96,993 (493) -0.1% 1,763 0.4% 1,270 0.1%
Source: Moody's Analytics; W-ZHA
F:\8000s, misc\82373 Fairfield\[demo.xlsx]Sheet19
THE OFFICE MARKET
EXISTING CONDITIONS – FAIRFIELD COUNTY AND SUBMARKETS
Unless otherwise noted, the source of the office market data presented herein is Cushman Wakefield, a
real estate brokerage firm with offices in Fairfield County. According to Cushman Wakefield statistics
there is both less total Class A and B office space and less occupied office space in Fairfield County today
than there was five years ago.
Office Market Trends
Fairfield County
4th Quarter 2013 and 2nd Quarter 2018
4th Quarter 2013 2nd Quarter 2018 Change
Inventory Occupied Inventory Occupied Inventory Occupied
Sq Ft Sq Ft Sq Ft Sq Ft Sq Ft Sq Ft
Fairfield County 40,266,524 31,881,502 39,433,690 29,753,085 (832,834) (2,128,417)
Class A 31,257,704 24,759,157 30,172,187 22,995,131 (1,085,517) (1,764,026)
Class B 9,008,820 7,122,345 9,261,503 6,757,954 252,683 (364,391)
Source: Cushman Wakefield, "Fairfield County Office Statistics: Q4 2013 and Q2 2018"; W-ZHA
F:\8000s, misc\82373 Fairfield\[demo.xlsx]Sheet20
Office supply contraction is likely due to building obsolescence and office building conversions. Changes
in how we work largely explains the reduction in occupied office space despite office-inclined industry
employment growth over the last five years. Across all U.S. markets the amount of office space required
per employee has been steadily declining due to telecommuting/technology, open floorplan design,
flexible working hours and other factors.- 18 -
As of the 2nd Quarter of 2018, 25 percent of the office space in the County was available for-lease.
Typically, a stabilized market has an overall (Class A and B space) vacancy rate below 15 percent.
Office Market Statistics
Fairfield County
2nd Quarter 2018
Inventory Available Occupied
Sq Ft Sq Ft Rate Sq Ft
Greenwich 4,031,102 740,620 18.4% 3,290,482
Stamford 16,273,822 4,974,451 30.6% 11,299,371
South Central 8,084,508 2,149,840 26.6% 5,934,668
Central 2,001,626 270,617 13.5% 1,731,009
Eastern 5,828,056 1,039,174 17.8% 4,788,882
Greater Danbury 3,214,576 505,903 15.7% 2,708,673
Fairfield County 39,433,690 9,680,605 24.5% 29,753,085
Source: Cushman Wakefield, "Fairfield County Office Statistics: Q2 2018"; W-ZHA
F:\8000s, misc\82373 Fairfield\[demo.xlsx]Sheet17
Cushman Wakefield tracks office performance in six submarkets of the County and the cities within each
submarket. These submarkets include Greenwich, Stamford, Norwalk, South Central (Darien/New
Canaan, Norwalk, and Wilton), Central (Westport and Fairfield/Southport), Eastern (Bridgeport,
Shelton/Stratford, and Trumbull) and Greater Danbury. The Stamford and the South Central
(Darien/New Canaan, Norwalk, and Wilton) submarkets contain the most office space (62 percent of the
County total) and account for approximately three-quarters of the vacant space in the County.
The Town of Fairfield is in the Central submarket. The Central submarket is the smallest from an office
inventory perspective. The Central submarket has the lowest overall vacancy rate (13.5%) of all the
County submarkets.- 19 -
Average Rental Rates
Fairfield County by Sub-Market
2013 and 2nd Quarter 2018
Change
2013 2nd Qtr 2018 /Sq Ft %
Greenwich $70.40 $51.71 ($18.69) -26.5%
Stamford $41.60 $36.94 ($4.66) -11.2%
South Central $27.89 $28.89 $1.00 3.6%
Central $35.13 $39.91 $4.78 13.6%
Eastern $20.87 $17.25 ($3.62) -17.3%
Greater Danbury $24.06 $24.75 $0.69 2.9%
Fairfield County $37.20 $32.47 ($4.73) -12.7%
Source: Cushman Wakefield, "Fairfield County Office Statistics: 2013 and Q2 2018"; W-ZHA
F:\8000s, misc\82373 Fairfield\[demo.xlsx]Sheet16
High vacancy has led to rent depreciation in some Fairfield County submarkets. Overall rents in Fairfield
County declined by approximately 13 percent between 2013 and 2018.
The Central submarket, where Fairfield is located, experienced average rental rate gains during this time
period. Average rents increased by over 10 percent during this time period. Where the Central
submarket’s average rent was well below the Stamford average in 2013, by 2018 the average rent in the
Central submarket was the 2nd highest in Fairfield County, only behind Greenwich.
As has been the trend across the United States, office tenants are increasingly interested in locating in
walkable, mixed-use settings with transit access. Businesses, particularly those who rely on young
knowledge workers, are competing for talent and concerned about employee retention. Research
indicates that knowledge workers value walkable settings, bike and transit access, environmental
stewardship and socially diverse locations.- 20 -
Office Performance
Stamford and Greenwich Central Business District versus Suburbs
2nd Quarter 2018
$100.00 35.0%
$90.00
$80.00 30.0%
Overall Vacancy Rate
$70.00
$60.00 25.0%
$50.00
$40.00 20.0%
$30.00
$20.00 15.0%
$10.00
$0.00 10.0%
Greenwich Greenwich Stamford CBD Stamford
CBD Suburb Suburb
Avg Rent Vacancy
Source: Cushman Wakefield, "Fairfield County Office Statistics: Q2 2018"; W-ZHA
Office market data reflect this trend. In both the Stamford and Greenwich markets, office performance
is tracked for the Central Business District and the suburban markets. In each case, the Central Business
District has a lower vacancy rate and commands higher rents.
EXISTING CONDITIONS – TOWN OF FAIRFIELD
Office Space by Class
Westport and the Town of Fairfield
2nd Quarter 2018
Source: Cushman Wakefield, "Fairfield County Office Statistics: Q2 2018"; W-ZHA- 21 -
Westport and Fairfield/Southport make up the Central Fairfield County submarket. According to
Cushman Wakefield data, there are 740,260 square feet of Class A and Class B office space in the Town
of Fairfield. With 1.2 million square feet of office, Westport has almost twice the inventory as Fairfield.
Approximately 82 percent of Westport’s office is classified as Class A, while only 57 percent of Fairfield’s
is considered premium space. A number of brokers remarked that Fairfield does not really have a
building that satisfies true Class A criteria.
Office Market Performance
Westport, Fairfield/Southport, Central Sub-Market
2nd Quarter 2018
Available
Sq Ft Sq Ft % Avg Rent
Westport 1,261,364 222,645 17.7% $41.93
Class A 1,112,220 196,718 17.7% $43.45
Class B 149,144 25,927 17.4% $32.15
Fairfield/Southport 740,262 47,972 6.5% $31.34
Class A 422,324 30,298 7.2% $34.26
Class B 317,938 17,674 5.6% $26.74
Total Central Sub-Mkt 2,001,626 270,617 13.5% $39.91
Class A 1,534,544 227,016 14.8% $42.14
Class B 467,082 43,601 9.3% $29.96
Source: Cushman Wakefield, "Fairfield County Office Statistics: Q2 2018"; W-ZHA
As was noted earlier, the Central submarket has the lowest vacancy among the Fairfield County office
submarkets. The Town of Fairfield’s overall vacancy rate is only 6.5% for Class A and B space. Fairfield’s
Class A space is over 90 percent occupied as is the Town’s Class B space. Fairfield’s office supply is
effectively full. The largest space available is 14,000 square feet and the remainder of the available
office space is in small spaces.
Fairfield is looked at as a more affordable location as compared to points west like New Canaan, Darien,
and Westport. So far, Fairfield has not been looked at as a business location for businesses interested in
New York access. The trip to New York from Fairfield is about an hour and 20 minutes – there are more
convenient locations available. The Town’s train stations are considered an employee amenity, not
portals for business interaction.
While the data indicates that Fairfield rents average $31.00 per square foot, brokers suggest that deals
are being done for less -- like $25.00 to $28.00 per square foot triple net. Office rents typically include
free parking at four to five spaces per 1,000 square feet. Operating expense pass thru’s range from
$7.00 to $13.00 per square foot in Fairfield, with $8.00 to $10.00 a good average.- 22 -
Interviews with office brokers and developers indicate that today the typical Fairfield office tenant is
small. The bulk of the Fairfield general multi-tenant market are tenants of 1,300 to 4,000 square feet.
These tenants tend to be professional service firms (like lawyers) or finance/insurance/real estate firms.
Brokers remarked that there really is no state-of-the-art Class A office space in Fairfield. A true Class A
office building has state-of-the-art building systems, open floor plans, and lots of natural light. Some
brokers indicated that Fairfield also has a lack of professionally managed office supply which some larger
tenants require. A large tenant in Fairfield would be 10,000 to 20,000 square feet.
OFFICE PROSPECTS
In the Town of Fairfield there are likely three potential demand drivers for office space: 1) Local
Demand: Growth in the demand for office given Fairfield’s population needs; 2) East Fairfield County
Demand: Growth in the demand for office due to existing tenants in nearby office parks re-locating to
Fairfield to be in a walkable, transit-oriented location; and, 3) Super-Regional Demand: A large business
(100,000 square feet-plus) locates in Fairfield for its location and rail access.
Local Market Potential
Local market potential is driven by servicing the local population. The Town of Fairfield’s population is
projected to grow by 1,300 people and 136 households over the next 10 years. This is comparable to
the Town’s population and household growth between 2010 and 2018 (1,200 people and 160
households). All in all, the Town is not projected to grow significantly over the next 10 years.
Population and Household Projections
Fairfield County and the Town of Fairfield
2018, 2023, 2028
Population
Change
2018-2028
2018 2023 2028 /1 # CAGR
Fairfield County 958,883 982,066 1,005,809 46,926 0.48%
Town of Fairfield 60,614 61,274 61,941 1,327 0.22%
Households
Change
2018-2028
2018 2023 2028 /1 # CAGR
Fairfield County 346,445 353,530 360,760 7,085 0.20%
Town of Fairfield 20,560 20,696 20,833 136 0.07%
1. Extrapolated from 2018-2023.
Source: ESRI; W-ZHA
F:\8000s, misc\82373 Fairfield\[demo.xlsx]Sheet7- 23 -
Using the 2010 to 2018 timeframe as a proxy for the future, the 160 new households in Fairfield resulted
in no net new jobs in the non-medical office-inclined industries. In fact, even with population and
household growth, the number of Town jobs in information, finance and professional, scientific and
technical services declined. Noted by brokers that Fairfield has a “stable” general office market, the
prospect that local population growth will generate demand for additional general office space is
unlikely.
There is a sense, however, that a growing and aging local population may impact the medical office
market. The Town’s employment in health and social services increased by approximately 350 jobs
between 2010 and 2017. Assuming the Town’s 2012 Economic Census ratio of ambulatory care jobs to
total health and social service jobs (47 percent) remains constant, between 2010 and 2017 there were
an additional 160 jobs in doctors’, dentists’ and other health practitioner’s offices. Some of this growth
did translate into office demand in Fairfield according to local brokers.
Population for Every Ambulatory Care Job
Town of Fairfield
2010, 2017 and Extrapolated 2018
Extrapolated
2010 2017 2018
Health and Social Assistance Jobs /1 3,841 4,187 4,238
/2
% Ambulatory Care 46.7% 1,794 1,955
Population 59,404 60,614
Population/Ambulatory Care Job 33 31
1. Extrapolated 2017 data to 2018 by applying compound average annual growth rate from
2010 to 2017.
2. Based on 2012 Economic Census data, which is the most recent data available.
Source: 2012 Economic Census; ESRI; W-ZHA
F:\8000s, misc\82373 Fairfield\[demo.xlsx]med ratio
Over the next 10 years, population growth will potentially generate demand for 10,000 square feet of
medical-related office space. This projection may be conservative given the Town’s aging population.- 24 -
Medical Office Potential
Town of Fairfield
2018 to 2028
2018-2028
Population Change 1,327
Population/Ambulatory Care Job 32
Total New Job Potential 41
Office Space /Job (Sq Ft) 230
Medical Office Space Potential (Sq Ft) 10,000
Source: 2012 Economic Census; ESRI; W-ZHA
F:\8000s, misc\82373 Fairfield\[demo.xlsx]med off pot
Even with transit nearby, medical office space is typically parking intensive allocating 5-plus spaces per
1,000 square feet of space.- 25 -
East Fairfield County Market Potential
The general consensus among commercial real estate brokers is that the Town of Fairfield has a small,
stable office market with limited multi-tenant growth potential unless an anchor tenant (15,000 square
feet – plus) appears. There were, however, some that believe there are office tenants that would locate
in Fairfield today if space were available.
These prospective tenants are currently located in suburban office parks in eastern Fairfield County in
locations where rail transit is not available and walkability is limited. These businesses want to locate in
this part of the County and are not considering Stamford or Norwalk or Greenwich locations. An anchor
tenant among this target market is likely between 15,000 and 20,000 square feet.
Class A Office in Shelton/Stratford and Trumbull Sub-Markets
2nd Quarter, 2018
Class A Overall Occupied Average
Space Vacancy Space Rent
Shelton/Stratford 3,040,341 7.5% 2,812,315 $20.01
Trumbull 227,558 68.0% 72,819 $19.22
Total 3,267,899 11.7% 2,885,134 na
Source: Cushman Wakefield, "Fairfield County Office Statistics: 2018"; W-ZHA
It is difficult to determine whether this opportunity really exists as there few credit landlords with large
spaces available near transit in Fairfield.
It is true that there is a considerable amount of Class A space available to the east that does not offer
the types of amenities that are present at the Downtown Station and could, potentially, be present at
the Metro Center Station Area. Walkable, transit-oriented, amenity rich environments are what many
businesses seek to both brand their companies and recruit and retain employees. If the Town of
Fairfield were to capture 5 percent of the Class A space in the suburban submarkets to the east that
translates into approximately 150,000 square feet of office space.
The challenge with this scenario is the cost of new construction in the Town of Fairfield. Class A tenants
in the eastern suburbs are paying $20 to $25 per square foot, triple net. For office investment to make
sense on a mid-rise, structure-parked office building, assuming a land value of $1 million per acre, would
require rent in excess of $35.00 triple net. This is considerably higher than the average for the eastern
suburbs, but not considerably higher than a premiere Downtown Fairfield location.
This rent may be marketable in Downtown Fairfield, but it may be more challenging at Metro Center,
particularly if all Metro Center offers in terms of amenity is the train station. If Metro Center evolves
into a distinctive mixed-use district, this rent level may be marketable at this location.- 26 -
Office development will only be feasible with an anchor office tenant commitment. Pure speculative
office development will likely not happen. With an anchor office tenant the building will either be a
build-to-suit or a multi-tenant office building with some speculative office space.
Super-Regional Market Potential
Super-regional market positioning targets large companies seeking a Northeast Corridor location.
Rather than a 20,000 square foot anchor tenant, the target market would be the 100,000 square foot-
plus tenant. The product would be 150,000 to 200,000-plus Class A office buildings. This was the
original concept for the Metro Center site.
There are a number of factors that bring into question whether this positioning for the Metro Center
site will be successful. One consideration is the level of employment growth projected for the County
and the County’s available office supply. Another consideration is Metro Center’s competitiveness vis-a-
vis Stamford (and, to a lesser extent, Norwalk) given the amount of available space within walking
distance of its train station.
Jobs in Fairfield County are projected to grow by 0.5 percent per year between now and 2028. This rate
of growth is below the national growth rate of 0.7 percent per year. County employment growth in
office-inclined industries is projected to be negligible over the same projection period.
In 2018, there were 68 square feet of occupied multi-tenant office space per job in Fairfield County.
Using this as a proxy, the 19,000 new jobs forecast for Fairfield County generate the potential for 1.3
million square feet of office.
Office Potential from Overall Job Growth
Fairfield County
2018-2028
Total Employment 2018 2023 2028 2018-2028
Fairfield County 421,063 429,933 440,412 19,349
2018 Occupied Office to Job Ratio 68
Office Space Potential 1,308,000
Source: W-ZHA
F:\8000s, misc\82373 Fairfield\[demo.xlsx]off inc proj f
According to data from Cushman Wakefield, there were 9.68 million square feet of available office space
in the County as of the 2nd Quarter of 2018. There are over 7 million square feet of available Class A
space in the County. Not only will the existing supply be available immediately, it will likely come at a
rent far less than that required for new construction. It will be very difficult for Fairfield to compete
successfully for the large tenant that does not require rail proximity.
For those businesses seeking locations on the Northeast Corridor with easy rail access, it is likely that
will also be seeking a mixed-use walkable environment. Because Downtown Fairfield cannot- 27 - accommodate a large office building, Fairfield Metro Center would have to compete primarily with Stamford and Norwalk for these businesses. From a rail service perspective, it takes less than an hour to get to New York from Stamford. Both Amtrak and Metro North service Stamford. Fairfield does not have Amtrak service and Metro Center is about a 1 hour and 20 minute ride to New York. Today, Stamford offers a walkable, mixed-use environment near the Station. Whether it be the Central Business District’s hotels, restaurants, and Stamford Town Center or Harbor Landing, there are many live/work/play options available to transit-oriented office tenants in Stamford. Stamford is a City with a diverse population and a growing number of young professionals. This makes Stamford an attractive location for larger businesses. Office buildings within easy walking distance to the Stamford railroad station were evaluated for space availability. Over 40 percent of the 3.4 million square feet of Class A space within walking distance to the train station is available or scheduled to be available for lease. 2 This amounts to 1.4 million square feet of space. While quoted rents are high, real estate broker interviews suggest that large tenants can occupy space in Stamford for far less than it would cost to lease in a newly constructed, high-rise Class A office building. 2 The Stamford office market has been challenged by big tenant moves. In 2016, UBS left 677 Washington Boulevard and downsized into 600 Washington Boulevard across the street. Within easy walking distance to the Stamford Train Station, 677 Washington Boulevard is now being marketed as a multi-tenant building. Charter Communications will be vacating 400 Atlantic Avenue and building a 500,000 square foot headquarters at the Gateway Harbor Point project with targeted occupancy in 2019.
- 28 -

                                   Office Space Within Walking Distance to the Train Station
                                                          Stamford
                                                        Summer 2018

                                                          Stamford
                                                                                       Available   Available
Address                                   Name                Yr Built       Sq Ft        Sq Ft       %          Rent
600 Washington Street                 RBS Building             2009        540,000       66,000     12.2%       $60.00
677 Washington Street                 Old UBS Bldg             1997        687,857      675,857     98.3%         NA
750 Washington Street               Stamford Towers            1989        326,468       47,484     14.5%       $53.00
680 Washington Street               Stamford Towers            1989        132,762       5,060       3.8%       $53.00
400 Atlantic Avenue                 Stamford Towers            1980        501,488      355,946     71.0%         NA
300 Atlantic Avenue                300 Atlantic Avenue         1987        295,000       32,048     10.9%       $53.00
1 Station Place                      1 Station Place           1999        282,433      107,115     37.9%      $58 - $60
2187 Atlantic Street               2187 Atlantic Street        1985        105,738       75,624     71.5%       $46.00
1 Dock Street                         1 Dock Street           Historic      86,000       13,204     15.4%       $42.00
2200 Atlantic Street                One Harbor Point           2010        260,272          0        0.0%       $62.00
100 Washington Blvd                 Two Harbor Point           2010        140,222       23,919     17.1%       $62.00
Total Office Near Station                                                 3,358,240    1,402,257    41.8%

Source: Cushman Wakefield; W-ZHA

Fairfield’s Metro Center station is designed to accommodate such a user, but with all else being equal,
Stamford is a superior location. While there are restaurants and retail near the Metro Center station,
the Station site itself is somewhat of an island. Future development on the site may enhance Metro
Center’s walkability, but in the near term, the Metro Center site is challenged from a walkability
standpoint. With zoning only allowing for office and retail/services, the potential for Metro Center to
evolve into a live/work/play environment is limited.

There is a limited supply of office space available near Norwalk’s SoNo (South Norwalk) train station.
While SoNo is an attractive mixed-use entertainment, recreation and residential district, most of
Norwalk’s transit-oriented office space is at the Merritt 7 station on Metro North’s Danbury branch of
the New Haven line. There are thru trains to New York from the Merritt 7 station.

It takes about the same amount of time to get to New York from the Merritt 7 station as it does from
Fairfield’s Metro Center station. The Walkscore at the Merritt 7 Corporate Park near the Station is 42 –
“Car Dependent”. Merritt 7 office tenants have shuttle service to the Merritt 7 station as well as
amenities like a fitness center, two cafes, a Starbucks and a salon. The environment around the Merritt
7 station is not a true live/work/play environment. Regardless, FactSet, a technology company, recently
leased 173,000 square feet in this location.
- 29 -
Office Space Within Walking Distance to the Train Station
Norwalk Merritt 7 Station
Summer 2018
Merritt 7
Available Available
Address Name Yr Built Sq Ft Sq Ft % Rent
/1
101 Merritt 7 101 Merritt 7 1980 225,767 19,207 8.5% $36.00
/1
201 Merritt 7 201 Merritt 7 1982 241,584 48,170 19.9% $36.00
301 Merritt 7 301 Merritt 7 1985 205,000 0 0.0% NA
401 Merritt 7 /1 401 Merritt 7 1987 260,370 33,743 13.0% $36.00
501 Merritt 7 /1 501 Merritt 7 1990 215,976 95,809 44.4% $36.00
601 Merritt 7 /1 601 Merritt 7 2002 265,000 191,952 72.4% $36.00
20 Glover Avenue Merritt on the River 1980 244,800 107,225 43.8% $35.00
45 Glover Avenue The Towers 2001 278,563 0 0.0% NA
801 Main Avenue The Towers 2004 290,000 0 0.0% NA
901 Main Avenue The Towers 2006 369,000 0 0.0% NA
Total Office Near Station 2,596,060 496,106 19.1%
1. Average asking rent for the Merritt 7 Corporate Park.
Source: Cushman Wakefield; W-ZHA
F:\8000s, misc\82373 Fairfield\[demo.xlsx]avail sp
Approximately 20 percent of the office near the Merritt 7 station is available. Class A office rent near
the Merritt 7 station is in the mid-$30’s, considerably lower than Stamford’s Class A rents.
As a transit-oriented location, Fairfield Metro Center will compete with the Merritt 7 Station Area.
While Norwalk is advantaged because it is further west and a larger city, it takes about the same time to
get to New York from Fairfield Metro Center. For a for-lease building, the challenge Fairfield Metro
Center will face is the cost of new construction and its impact on the lease rate.
A newly constructed, high-rise Class A office building with structured parking will require a triple net
rent in the mid-$40’s. Metro Center’s location east of Norwalk, the island character of the site, and the
lack of a true live/work/play environment will make it difficult to lease space at this price point. A build-
to-suit building for a single tenant is the more likely scenario if such an opportunity arises.
OFFICE MARKET CONCLUSIONS
While the overall Fairfield County office market is challenged with high vacancy, this is not the case in
the Town of Fairfield. This analysis concludes that over the next 10 years there will likely be medical
office demand and, potentially, regional office demand. The potential for a super-regional office play at
Metro Center is considered slim given the available space in more competitive locations.- 30 -
Office Market Conclusions
Downtown and Metro Center Station Areas
2018 - 2028
Square Feet Notes
Downtown 10,000 - 20,000 Part of a Mixed-Use Project
Metro Center 80,000 - 150,000 Buildings of 60,000+; Anchor Tenant Required
Source: W-ZHA
F:\8000s, misc\82373 Fairfield\[demo.xlsx]Sheet2
The Downtown Station area is best positioned for professional and medical office. This space would
likely not be stand-alone, but part of a mixed-use project. Premium rents of $40 per square foot would
be feasible in the vicinity of the train station.
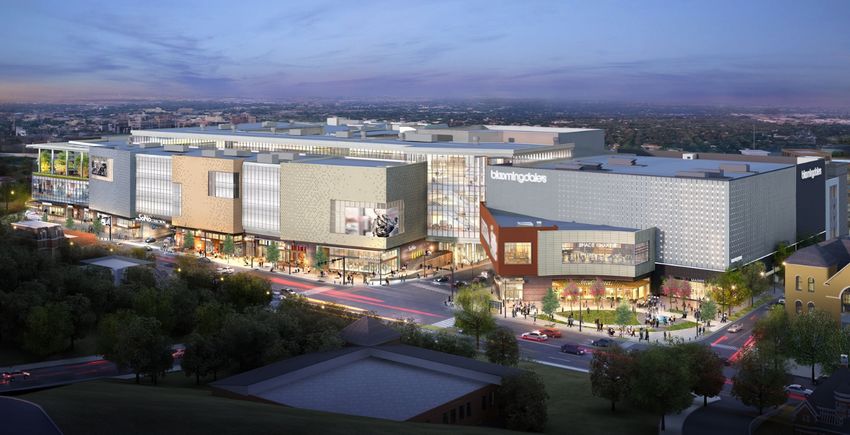
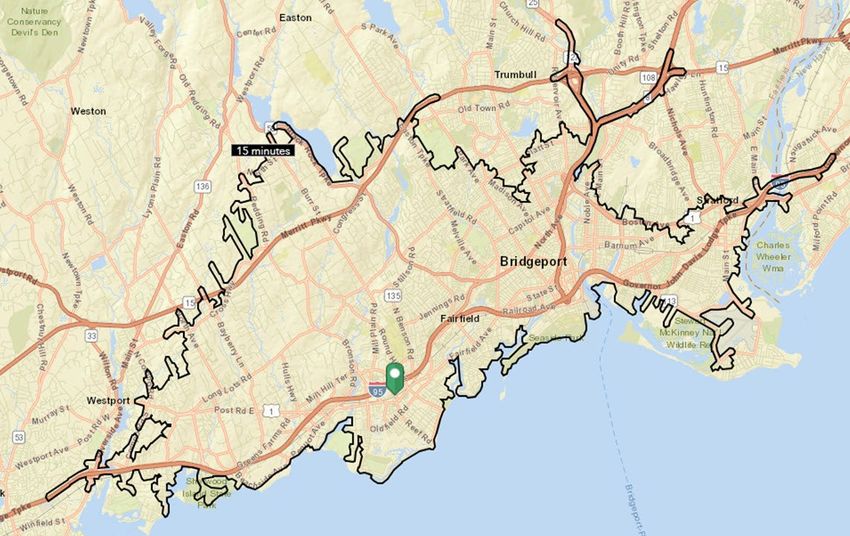
From an office perspective, the Exide site is not transit-oriented. The walk time to and from the station
is long at 12 minutes. This walk time is not convenient to commuting employees. Any office space at
the Exide site would likely be serving the local community (like medical office). Rent at the Exide site
would be lower than in the Core.
The Metro Center is a strong location in the regional market. Rail and the potential for a mixed-use,
walkable environment could make Metro Center a good location for a tenant seeking a western Fairfield
County location. A building(s) of 60,000 square feet or larger (depending on anchor tenant) is
appropriate for this market position. Rent at this location with the rail would likely be $35 per square
foot assuming a mix of uses is present on-site.- 31 -
THE RETAIL MARKET
EXISTING CONDITIONS – THE TOWN OF FAIRFIELD AND THE STATION AREAS
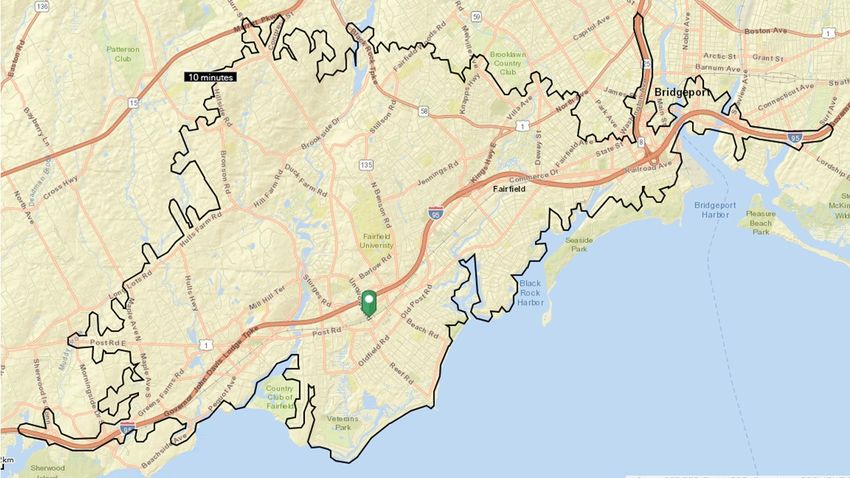
Town of Fairfield
Retail Employment Heat Map
Town of Fairfield
2015
Source: US Census; W-ZHA
In the Town of Fairfield, retail and eating and drinking establishments are concentrated along Route 1,
Black Rock Turnpike and the Tunxis Hill Cut-Off. Easily accessed off of Interstate 95, Route 1/Post Road
accommodates national retailers like Bed Bath and Beyond and Marshall’s as well as independently
operated stores. Fairfield’s Downtown area is a regional dining destination.
There are mostly national credit tenants in the shopping centers along Black Rock Turnpike and the
Tunxis Hill Cut-Off. Fairfield’s retail is mostly community-serving, not super-regional in its market
targeting.
Fairfield’s commercial areas and shopping centers are well-occupied. Field surveys suggest that the
Town’s commercial districts are largely built-out. Except at Metro Center and the Exide site, there are
not many vacant sites available for retail or restaurant development in the Town. Therefore, to develop
retail in Fairfield will, more often than not, require the acquisition of an existing use, building demolition
and development. Property redevelopment is more expensive than greenfield development.- 32 -
Rental Rates
Available Retail Space
Town of Fairfield
Core of Downtown Fairfield /1 $42 - $55
Old Post Road Outside of Core $14 - $25
Metro Center Area na
Black Rock Turnpike Area $35 - $48
1. The "Core" of Downtown is defined as the area south of the
railroad tracks (mostly along Post Road) between Beach Road
and Mill Plain Road.
Source: LoopNet; Town of Fairfield website; W-ZHA
\\WZHASRV\data\8000s, misc\82373 Fairfield\[retail.xlsx]rent
Retail and restaurant rental rates are highest ($42 - $55 per square foot, triple net) in the core of
Fairfield’s Downtown. The Black Rock Turnpike area commands rents of $35 to $48 per square foot,
triple net. High rents reflect both the spending power of the Fairfield market and the scarcity of well-
positioned retail and restaurant space. Post Road outside of the core has a number of small, older
shopping centers and buildings where rent is lower.
Because Town households have high disposable incomes, the Town’s spending indices on apparel and- 33 -
services, entertainment and recreation, and eating and drinking are well above national averages. The
Town of Fairfield is a prime market for specialty retail (one-of-a-kind products) and restaurants.
Retail Sales and Resident Expenditure Potential
Town of Fairfield
2017
Retail Sales
Retail Expenditure Potential
$0 $200 $400 $600 $800 $1,000 $1,200 $1,400 $1,600
Millions $
Source: ESRI; W-ZHA
Expenditure potential is what residents are likely to spend on retail in a given year. Retail sales are the
actual sales that year. Taken as a whole it appears that 2017 retail sales in the Town of Fairfield were
within 2 percent of the Town’s retail spending potential.- 34 -
Retail Expenditure Potential and Sales
Town of Fairfield
2017
Surplus/ (Deficit)
Expenditure % of
Industry Group Potential Sales $ Potential
Motor Vehicle & Parts Dealers $303,241,723 $594,720,729 $291,479,006 96%
Furniture & Home Furnishings Stores $61,893,369 $25,024,764 ($36,868,605) -60%
Electronics & Appliance Stores $57,718,661 $102,398,606 $44,679,945 77%
Bldg Materials, Garden Equip. & Supply Stores $100,616,802 $41,375,089 ($59,241,713) -59%
Food & Beverage Stores $275,242,732 $224,597,979 ($50,644,753) -18%
Health & Personal Care Stores $94,190,143 $60,358,637 ($33,831,506) -36%
Gasoline Stations $123,353,173 $146,832,942 $23,479,769 19%
Clothing & Clothing Accessories Stores $118,795,085 $99,916,951 ($18,878,134) -16%
Sporting Goods, Hobby, Book & Music Stores $55,550,379 $33,621,695 ($21,928,684) -39%
General Merchandise Stores $218,027,041 $94,525,863 ($123,501,178) -57%
Miscellaneous Store Retailers $57,162,433 $35,805,240 ($21,357,193) -37%
Total $1,465,791,541 $1,459,178,495 ($6,613,046) 0%
Total Non-Vehicle Sales and Gas $1,039,196,645 $717,624,824 ($321,571,821) -31%
Source: ESRI; W-ZHA,
\\WZHASRV\data\8000s, misc\82373 Fairfield\[esri retail fairfield 2.xlsx]Sheet5
Looked at by industry, however, it is clear that a lot (41 percent) of the Town’s sales are coming from
vehicle and parts sales. Sales in this industry were almost twice what Town residents would be expected
to spend on vehicles and parts. People in the greater region are coming to the Town of Fairfield to
purchase vehicles. Many of the Town’s vehicle dealerships are on Commerce Drive within three-
quarters of a mile to the Metro Center station.
If gas and vehicle retail sales are removed, Fairfield’s residents had approximately $1 billion of retail
spending potential in 2017. Sales in these retail categories totaled approximately $718 million. Thus,
over 30 percent of residents’ spending either did not happen or occurred outside of the Town of
Fairfield (“sales leakage”).
The greatest amount of sales leakage occurred in general merchandise stores. Examples of these stores
include Costco, Walmart, etc. The highest percent of sales leakage occurred in the furniture and home
furnishing stores category and the building materials category (Home Depot, Ace Hardware, Lowe’s,
etc.).
Large, surface-parked general merchandise stores and building materials stores typically require sites in
excess of 9 acres. There are very few shovel ready sites of this size in the Town of Fairfield. The Metro
Center train Station Area is such a site.You can also read