TOGETHER CREATING THE LEADING EUROPEAN COMMERCIAL REAL ESTATE COMPANY - 18 November 2019 - Aroundtown SA

Page created by Freddie Gallagher
 
CONTINUE READING
TOGETHER CREATING THE LEADING EUROPEAN COMMERCIAL REAL ESTATE COMPANY - 18 November 2019 - Aroundtown SA
TOGETHER CREATING THE LEADING EUROPEAN
   COMMERCIAL REAL ESTATE COMPANY

               18 November 2019
TOGETHER CREATING THE LEADING EUROPEAN COMMERCIAL REAL ESTATE COMPANY - 18 November 2019 - Aroundtown SA
Disclaimer

IMPORTANT:
This presentation has been provided for information purposes only and is being circulated on a confidential basis. This presentation shall be used only in accordance with applicable law, e.g.
regarding national and international insider dealing rules, and must not be distributed, published or reproduced, in whole or in part, nor may its contents be disclosed by the recipient to any other
person. Receipt of this presentation constitutes an express agreement to be bound by such confidentiality and the other terms set out herein. This presentation includes statements, estimates,
opinions and projections with respect to anticipated future performance of the Group and or TLG IMMOBILIEN AG ("forward-looking statements"). All forward-looking statements contained in this
document and all views expressed and all projections, forecasts or statements relating to expectations regarding future events or the possible future performance of Aroundtown SA or any
corporation affiliated with Aroundtown SA (the “Group”) and or TLG IMMOBILIEN AG only represent the own assessments. Any forward looking estimates or opinions as to the Group or TLG
IMMOBILIEN AG as applicable is based on publicly available information as of the date of this document. They have not been independently verified or assessed and may or may not prove to be
correct. Any forward-looking statements may involve significant risks and uncertainties and should not be read as guarantees of future performance or results and will not necessarily be accurate
indications of whether or not such results will be achieved. No representation is made or assurance given that such statements, views, projections or forecasts are correct or that they will be achieved
as described. Tables and diagrams may include rounding effects. This presentation is intended to provide a general overview of the potential synergies from a combination of Aroundtown SA and
TLG IMMOBILIEN AG and does not purport to deal with all aspects and details regarding the Group. Accordingly, neither the Group nor any of its directors, officers, employees or advisers nor any
other person makes any representation or warranty, express or implied, as to, and accordingly no reliance should be placed on, the accuracy or completeness of the information contained in the
presentation or of the views given or implied. Neither the Group nor any of its directors, officers, employees or advisors nor any other person shall have any liability whatsoever for any errors or
omissions or any loss howsoever arising, directly or indirectly, from any use of this information or its contents or otherwise arising in connection therewith. Aroundtown SA does not undertake any
obligation to publicly release any revisions to these forward-looking statements or other information or conclusion contained herein to reflect events or circumstances after the date of this
presentation.

This presentation is neither an offer to purchase nor a solicitation of an offer to sell shares in Aroundtown SA or TLG Immobilien AG. The definite terms and conditions of the takeover offer, as well as
further provisions concerning the takeover offer, will be published in the offer document following permission by the German Federal Financial Supervisory Authority (Bundesanstalt für
Finanzdienstleistungsaufsicht) to publish the offer document. Investors and holders of shares in the TLG Immobilien AG are strongly advised to read the offer document and all other documents
regarding the takeover offer when they become available, as they will contain important information.

The offer will be made exclusively under the laws of the Federal Republic of Germany, especially under the German Securities Acquisition and Takeover Act (Wertpapiererwerbs- und
Übernahmegesetz – WpÜG), and certain provisions of the securities laws of the United States of America applicable to cross-border tender offers. The offer will not be executed according to the
provisions of jurisdictions other than those of the Federal Republic of Germany or the United States of America (to the extent applicable). Thus, no other announcements, registrations, admissions or
approvals of the offer outside of the Federal Republic of Germany have been filed, arranged for or granted. Investors in, and holders of, securities in the Company cannot rely on having recourse to
provisions for the protection of investors in any jurisdiction other than the provisions of the Federal Republic of Germany or the United States of America (to the extent applicable). Subject to the
exceptions described in the offer document as well as any exemptions that may be granted by the relevant regulators, a public takeover offer will not be made, neither directly nor indirectly, in
jurisdictions where to do so would constitute a violation of the laws of such jurisdiction.
Aroundtown SA reserves the right, to the extent legally permitted, to directly or indirectly acquire shares outside the offer on or off the stock exchange. If such acquisitions take place, information
about such acquisitions, stating the number of shares acquired or to be acquired and the consideration paid or agreed on, will be published without undue delay, if and to the extent required by the
laws of the Federal Republic of Germany or any other relevant jurisdiction.

THIS PRESENTATION DOES NOT CONSTITUTE AN OFFER TO SELL OR THE SOLICITATION OF AN OFFER TO BUY ANY SECURITIES.
THE SECURITIES MENTIONED IN THIS ANNOUNCEMENT HAVE NOT BEEN, AND WILL NOT BE, REGISTERED UNDER THE UNITED STATES SECURITIES ACT OF 1933, AS AMENDED
(THE SECURITIES ACT), AND MAY NOT BE OFFERED OR SOLD IN THE UNITED STATES ABSENT REGISTRATION OR AN EXEMPTION FROM REGISTRATION UNDER THE SECURITIES
ACT. THERE WILL BE NO PUBLIC OFFERING OF THE SECURITIES IN THE UNITED STATES.

                                                                                                                                                                                                        1
TOGETHER CREATING THE LEADING EUROPEAN COMMERCIAL REAL ESTATE COMPANY - 18 November 2019 - Aroundtown SA
Key terms of the recommended all-share tender offer

                       ◼ All share voluntary tender offer by Aroundtown for 100% of the share capital of TLG

  Financial terms      ◼ 1 TLG share = 3.6 Aroundtown shares
                         ◼ The implied exchange ratio of 3.6 is determined on the basis of Aroundtown and TLG reported EPRA NAVs for 30 June 2019

 Merger agreement      ◼ Board of Aroundtown and Supervisory Board of TLG signed Business Combination Agreement (BCA) which agrees on the terms of
      signed             merger

                       ◼ Major shareholder support (irrevocable agreement) subject to certain conditions of up to approx. 28% of TLG shares ahead of offer
                         launch
                       ◼ No minimum acceptance threshold currently contemplated
   Transaction
     features          ◼ The offer will include standard conditions to closing

                       ◼ New shares to be issued out of Aroundtown’s existing authorized capital

                       ◼ RETT Blocker and refinancing secured

                       ◼ Commitment from Aroundtown’s Management Board and Board of Directors to continue to drive future strong performance

                       ◼ New improved governance structure for the combined company to be introduced at >50% acceptance rate:

                         ◼ Board of Directors: 7-8 members; chairman with casting vote nominated by TLG (at 40% acceptance rate); 3-4 independent members
   Governance            ◼ Management Body: 5 members (CEO, CFO, CIO, COO, CDO); Aroundtown nominates CEO; TLG nominates CFO and at >66%
                            acceptance rate an additional management board member, one of them will be Co-CEO
                       ◼ Advisory Board with Dr Cromme (chairman) and Mr Gabay (vice chairman) will stay intact with one member to be nominated by TLG

                       ◼ Berlin operational headquarters to be combined and the combined entity will be under a new name in due course

   Aroundtown’s and TLG’s board of directors and executive management teams are supportive of the combination on the basis of
                            accretive long-term value creation potential for both shareholder groups

                                                                                                                                                             2
TOGETHER CREATING THE LEADING EUROPEAN COMMERCIAL REAL ESTATE COMPANY - 18 November 2019 - Aroundtown SA
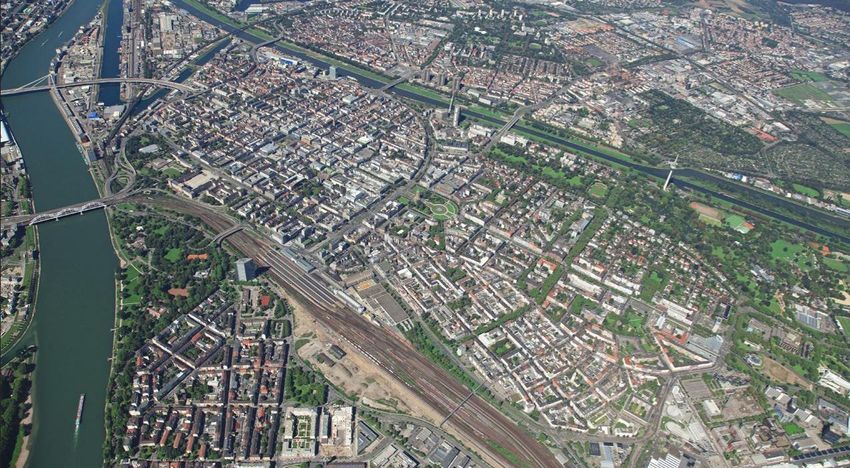
Creating the leading pan-European office/hotel/residential real estate company,
with over €25bn asset base

                            Creating a Pan-European leader in Commercial Real Estate with enhanced free float and liquidity
          Berlin

                                              Well-located & diversified portfolio, top tier cities within Germany & the NL, strongest asset classes
                   Berlin

                                                  Full value chain: Best-in-class capabilities to maximize value-add of combined portfolio
                                  Frankfurt

                                                  Management expertise and scale to accelerate develop-to-core in prime locations of top tier cities
                                Munich

                                              Estimated synergy potential driving FFO & NAV accretion for shareholders
                    Amsterdam

 Berlin                     Further improved governance structure

                                                                                                                                                       3
TOGETHER CREATING THE LEADING EUROPEAN COMMERCIAL REAL ESTATE COMPANY - 18 November 2019 - Aroundtown SA
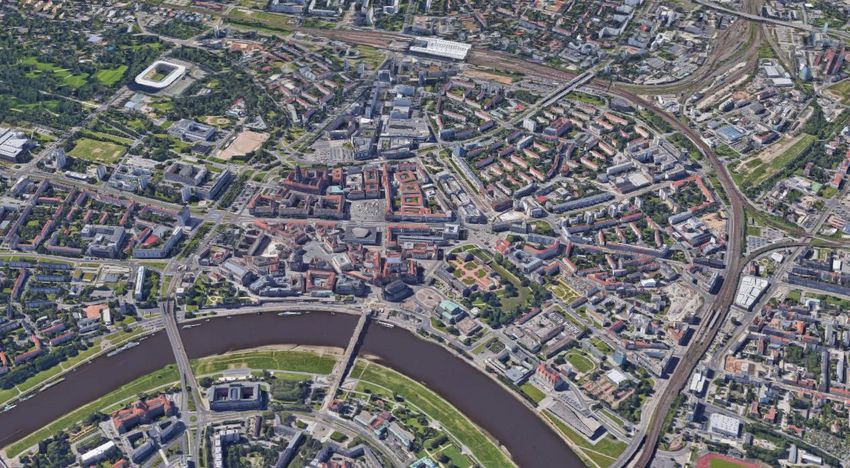
The combined company will be a top 3 real estate player in Europe

Total assets1 (EUR bn)

                                                                           Office and hotel focused real estate companies2                       Selected other real estate companies

    66.1

                 50.9

                             28.1
                                           26.6
                                                              24.7
                                                                               22.7
                                                                                              20.4
                                                                                                        17.4
                                                                                                                    15.5
                                                                                                                                       13.6              12.8                 12.2                     11.8     11.0

                                                                                                                                                                                                                                          4
                                                                                                                                                                                                                                    5.4

                                                                                                                                                                                                        Icade
                                                                                               Gecina
                  Vonovia

                                                                                                         Covivio³

                                                                                                                     Land Securities

                                                                                                                                        British Land

                                                                                                                                                                                                                 Swiss Prime Site
      URW

                              CombinedCo

                                                                                                                                                                               Inmobiliaria Colonial

                                                                                                                                                                                                                                    TLG
                                                               Klepierre

                                                                                 Aroundtown
                                            Deutsche Wohnen

                                                                                                                                                          MERLIN Properties
1 June 2019 total assets (including e.g. cash). Converted to EUR at spot where reporting in non-EUR currency
2 Companies with >40% office and hotel exposure based on portfolio value
3 Refers to group share
4 Excluding 15% stake held in Aroundtown

                                                                                                                                                                                                                                              4
TOGETHER CREATING THE LEADING EUROPEAN COMMERCIAL REAL ESTATE COMPANY - 18 November 2019 - Aroundtown SA
Combined company with over €25bn of assets with focus on the strongest asset
classes and regions

                                                                                    1                                                                                                                               +

                                                                  NRW 13%
                                                                                                                                                                                                             Munich 9%
                                                                                                                   Berlin 43%
                                           Berlin 20%                            Munich 11%                                                                                                 Berlin 24%

                                                                                                                                                                                                                           Frankfurt/Rhine-Main 13%
                                                                                        Frankfurt 10%
       Portfolio by                  Bremen 1%                    Value:                                                             Value:            Dresden/Leipzig/
                                                                                                                                                                                                           Value:             London 4%
                                                                                                                                                       Rostock 19%
          region¹                  Nuremberg 1%                  €19.2bn                                   Others 20%                €4.6bn                                                               €23.8bn             Hamburg 3%
                                       Utrecht 2%                                                                                                                         Dresden/Leipzig/Halle/
        (by value)                                                                 London 5%                                                                                   Rostock 7%                                     Amsterdam 3%
                                        Others 16%
                                                                                                                                                                                                                             Stuttgart/BB 2%
                                                                                  Hamburg 4%                                                                                                                                Rotterdam 2%
                                                                                                                                                                                          NRW 11%
                                                                               Amsterdam 4%                    Stuttgart/BB 50% in Berlin, Frankfurt, Hamburg, Munich, Amsterdam and London.
                        Total €1.9 billion development potential, located predominantly in prime locations of Germany’s top tier cities,
                                              fueling future organic growth, enabling additional value add-creation
Note: as of June 2019
¹ Including 39% stake in Grand City Properties; 2 Commercial portfolio only

                                                                                                                                                                                                                                               5
TOGETHER CREATING THE LEADING EUROPEAN COMMERCIAL REAL ESTATE COMPANY - 18 November 2019 - Aroundtown SA
Top tier cities within asset classes...

                                                                                                                                                                                     +

                                                                                                                                                                                         Frankfurt
                                          Frankfurt 14%                                                       Berlin 37%                                                                   17%
                                                                NRW 9%
                                                                                                                                                                                                     Munich 16%
                        Berlin 16%                                 Amsterdam 7%                                                          Frankfurt 29%        Berlin 20%
                                                                                      Wiesbaden/Mainz/
                                                                    Hamburg 4%         Mannheim 3%

    Office                                                          Rotterdam 4%            Stuttgart 1%                                                      Other 6%
                                                                    Utrecht 3%               Others 2%                                                   Nuremberg 1%                                    NRW 8%
                      Munich 19%                                  Hannover 3%                  Hamburg 3%                                                    London 1%
                                                                Stuttgart 3%                                                                                 Warsaw 2%                               Dresden / Leipzig /
                                                                                                     NRW 6%                                                                                          Halle / Rostock 6%
                                                                Warsaw 3%                                                                                    Stuttgart 3%
                                        Others 7%                                                                                                             Hannover 2%                    Amsterdam 6%
                                                              Wiesbaden/Mainz/Mannheim 3%                     Dresden/Leipzig/Halle/Rostock
                                                           Dresden/Leipzig/Halle 3%                                                                              Utrecht 2%              Hamburg 4%
                                     Nuremberg 1%                                                                         19%
                                                          London 1%                                                                                         Wiesbaden/Mainz/         Rotterdam 3%
                                                                                                                                                               Mannheim 3%
                                                                                                                     Berlin
                                                           London 11%                                                47%
                                                                                                                                                                                          London 10%

                        Berlin 25%                                 NRW 9%
                                                                                                                                                              Berlin 26%                              NRW 8%

                                                                     Munich/BR 8%                                                                                                                       Munich/BR 7%

    Hotel              Others 19%                                   Frankfurt 6%
                                                                                               Rostock
                                                                                                 5%                                                                                                     Frankfurt 6%
                                                                                                                                                                 Others
                                                                  Edinburgh 3%                                                                                    18%                                 Dresden / Leipzig /
                                                                  Dublin 3%                         Leipzig                               Dresden
                                                                                                                                            37%                                                       Halle / Rostock 5%
                                                                Stuttgart/BB 3%                      11%
                            Hamburg 1%                       Brussels 2%                                                                                                                       Edinburgh 3%
                                                                                                                                                                  Hamburg 1%
                     Dresden/Leipzig/Halle 2%                                                                                                                                              Dublin 3%
                                                                                                                                                             Mannheim/Mainz 2%           Stuttgart/BB 3%
                           Mannheim/Mainz 2%              Hannover/ Braunschweig 2%                                                                                     Rome 2%       Brussels 2%
                                        Rome 2%       Stralsund/Rügen/Usedom 2%                                                                          Stralsund/Rügen/Usedom 2%   Hannover/ Braunschweig 2%

     ▪ Over half of the combined office portfolio is in Berlin, Munich and Frankfurt
     ▪ Half of the combined hotel portfolio is in Berlin, London, Munich and Frankfurt
     ▪ Office and hotel portfolio is located in top tier German cities, with also strong footprint in metropolitan cities in Europe

                                                                                                                                                                                                                  6
TOGETHER CREATING THE LEADING EUROPEAN COMMERCIAL REAL ESTATE COMPANY - 18 November 2019 - Aroundtown SA
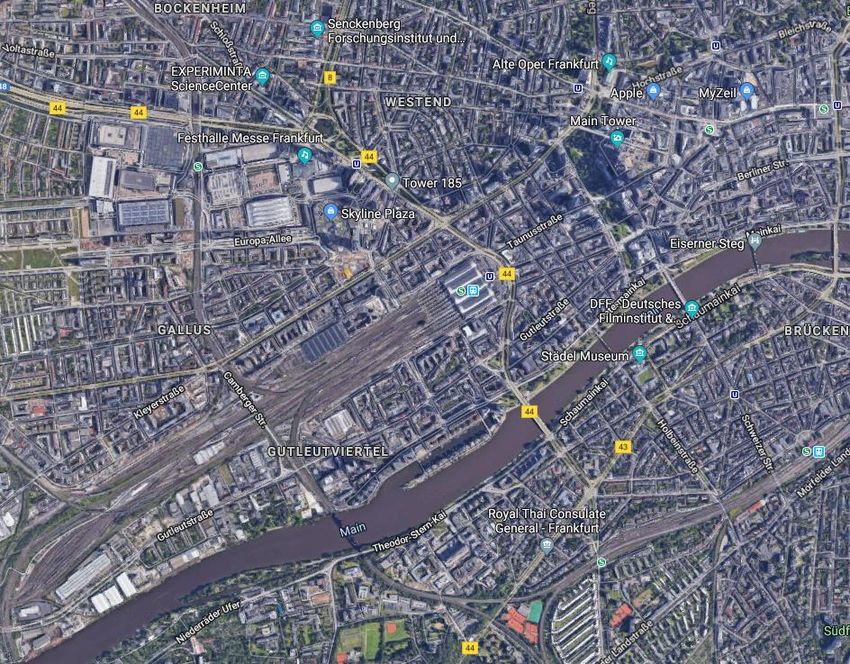
…and enhanced exposure to top cities with strong fundamentals

                                                          Rostock

                                              Hamburg

Amsterdam
                                                             Berlin            Siemens Office Campus,        Central Station Office Campus,     Spreestern, Berlin         Die Welle, Berlin
                                                                                      Munich                            Frankfurt

                                                             Leipzig/Dresden
Rotterdam                         Hannover

                                                                                   Prime Center Office,       Bristol Prime Center, Berlin        Main Triangel,           Erlenhöfe, Berlin
     Utrecht                                                                            Frankfurt                                                   Frankfurt
                                  Frankfurt

               NRW
                                     Wiesbaden/Mainz/Ma
                                           nnheim

                                                                               Steigenberger Prime Center,        Hílton Prime Center,        Forum am Brühl, Leipzig   Alexanderstrasse 1,3,5,
       Aroundtown                                                                       Cologne                           Berlin                                                Berlin

       TLG
                          Stuttgart/BB              Munich

                                                                                Prime Center Office,               City Center Ofice,         Hotel de Saxe, Dresden      Kulturbrauerei, Berlin
                                                                                      Leipzig                         Amsterdam

                     Higher concentration and stronger local presence will drive like-for-like rental growth and operational synergies

                                                                                                                                                                                                   7
TOGETHER CREATING THE LEADING EUROPEAN COMMERCIAL REAL ESTATE COMPANY - 18 November 2019 - Aroundtown SA
Berlin - Potsdamer Platz: The prime commercial and tourist center                                                                                                landmark

                                                                                                                                                               AT -property

Strong overlap in top tier cities, positioning the combined company as a leading landlord                                                                      TLG -property

                                                                                                    Potsdamer Platz                                   Potsdamer Platz
                                                                                                    Office                                            Office
                                               Crowne Plaza Potsdamer Platz
                                               Hotel

                                                Checkpoint Charlie                         Potsdamer Platz
                                                Hotel                                      Office
                                                                                                                         Potsdamer Platz
                          Checkpoint Charlie                                                                             Residential (GCP)
                          Office                                                                                                             Potsdamer Platz
                                                                     Checkpoint Charlie                                                      Office
                                                                     Office

                                                                                          Gendarmenmarkt
                                                                                          Office

                                                                                                                      Gendarmenmarkt
                           Gendarmenmarkt
                                                                                                                      Office
                           Retail

                                                      Hilton Gendarmenmarkt
                                                      Hotel
         Gendarmenmarkt
         Office

                                                                                          Gendarmenmarkt

                                                                                                                                                                              8
TOGETHER CREATING THE LEADING EUROPEAN COMMERCIAL REAL ESTATE COMPANY - 18 November 2019 - Aroundtown SA
Berlin - Alexanderplatz City Center                                                                                                                                             landmark

                                                                                                                                                                              AT -property

Strong overlap in top tier cities, positioning the combined company as a leading landlord                                                                                     TLG -property

                                               Berlin Mitte
          Berlin Mitte                         Residential (GCP)                    Berlin Prime Center Mitte
          Residential (GCP)                                                         Hotel
                                                                                                                  Prenzlauer Berg                         Greifswalder str.
                                                       Berlin Mitte
                                                                                                                  Mixed-use campus                        Retail
                                                       Residential (GCP)
         Berlin Mitte
                                                                                  Alexanderplatz
         Residential (GCP)
                                                           Alexanderplatz         Office
                                  Moxy by Marriott         Mixed-use
      Berlin Mitte                Berlin Mitte Hotel                                                 Alexanderplatz
      Residential (GCP)                                                                              Office & Hotel                     Prenzlauer Berg
                      AC by Marriott
                      Berlin Mitte Hotel                     Alexanderplatz
                                                             Retail                                         Alexanderplatz Ibis Hotel
                              Alexanderplatz
                              Office                                                            Alexanderplatz
                                                                                                Office
                                                                            Alexanderplatz
                                           Alexanderplatz                   Retail
   Berlin Cathedral

                                                                                             Köpenickerstraße
                                                                                             Residential (GCP)

                                     Annenstraße
                                     Retail

                                                                                                                                                                                             9
Berlin – Top tier locations around Kurfürstendamm                                                                                                                                                                landmark

                                                                                                                                                                                                                AT -property

Strong overlap in top tier cities, positioning the combined company as a leading landlord                                                                                                                      TLG -property

       Berlin City Center Mitte              Moxy by Marriot Berlin
       Office                                Mitte Hotel                                         AC by Marriot                                      Potsdamer Platz
                                                                                                 Berlin Mitte Hotel
                                                                                                                                                                  Ku’Damm KaDeWe                 Ku’Damm KaDeWe
                  Berlin City Center Mitte                                                                                                                        Office                         Residential (GCP)
                  Office
                                                                                                                                                                           Ku’damm /Uhlandstr.
                                                                      Berlin City Center Mitte                                 Berlin Tiergarten
                                                                                                                                                                           Office
                                                                      Office Campus                                            Hotel
                                                                                                                                                                                                                 Ku’Damm
                                                                                                           Berlin Tiergarten            Bristol Berlin Ku’Damm        Ku’Damm Mark Apart
                                                                                                                                                                                                                 Office
                                                                                                           Office Campus                Hotel                         Hotel
                              Berlin Center Charlottenburg                                                                                                       Ku’Damm / Lietzenburger Str
 Berlin Center                Residential (GCP)                                                                                                                  Residential (GCP)
 Charlottenburg
 Office                                                                                                                 Kurfürstendamm                                         Ku’Damm/Meineke Str.
                                                                                                                        (Ku’Damm)                                              Residential (GCP)

                                        Ku’Damm – Adenauerplatz                                      Ku’Damm – Adenauerplatz
                                        Residential (GCP)                                            Office

                                                                             Ku’Damm – Adenauerplatz
                                                                             Office

                                                                                                                                                                                                                            10
Highly performing hotel portfolio

                                Combined hotel portfolio with approx. 160 hotels valued at €4.8 bn at long-term and fixed
                                leases to third party hotel operators

                                Largest hotel portfolio among listed European real estate and TLG’s hotel portfolio would
                                benefit from an integration due to the strong market presence and economies of scale

                                                                Aroundtown has a well established network with leading hotel brands

                                                              Hilton Brands              Marriott Brands             Wyndham Brands
                                      7 hotels
                                     mostly 4 star
                                      category

                                                               IHG Brands               Accor Brands
  TLG’s brands can benefit from Aroundtown large
          network and economies of scale

                            Deutsche Hospitality Brands

                                                                                                                                      11
Increasing portfolio quality with strong tenant structure at low dependency

 ◼ Aroundtown has a limited dependency on single
   tenants and industry due to
   ◼ The size of Aroundtown’s portfolio with a large
     tenant base of over 3,000 tenants
   ◼ The strong focus on diversification of the
     tenant base                                       ◼ Benefit from a stronger diversification with top 10 tenants

 ◼ Top 10 tenants represent less than 20% of rent        representing less than 20% of rent on a larger portfolio,
 ◼ Portfolio WALT is 8 years (as of June 19)             while decreasing the dependency

                                                       ◼ Combined portfolio WALT is 7.5

                                                       ◼ Increased negotiation power with tenants that are in both
                                                         portfolios

                                                       ◼ Combination of both rental teams resulting in
 ◼ TLG’s 10 largest tenants represent over 30% of        efficiencies, faster letting and lower vacancies
   their total tenant base
 ◼ The integration into Aroundtown’s portfolio will
   lead to a higher portfolio quality also from a
   lower tenant dependency
 ◼ Portfolio WALT is 5.8 (as of Sep 19)

                                                                                                                       12
Reversionary potential – embedded value-add extraction expertise

Strong track record of like-for-like rental growth       Significant Reversionary potential fueling future internal growth (in € millions)

                                                                                +33%
      Strong track record of continuously                                                    975
              extracting potential
                                                                                                                                     +15%
                                                                  733
                                                                                                                                                  269
                                                                                                                          233

                                                          June 2019 annualized         Annualized market           Jun 2019 annualized      Annualized market
   High like-for-like testifies for this ability to                                        potential                                            potential
   transform high potential into high organic
                       growth
                                                         Strong track record of like-for-like rent increase

                                                                  5.1%                               4.8%
                                                                                4.1%                                                     4.4%
      Utilizing both companies’ expertise to                                                                                                      3.0%
                                                                                                                   2.9%
     unlock the value-add potential in TLG’s
                  portfolio faster

                                                                         2017                               2018                           Jun 2019

     Combination of portfolio and higher local concentration can unlock the reversionary potential faster via tenant active rotation and no
                                                           “internal” competition

                                                                                                                                                            13
Combination will result in acceleration and more profitable development pipeline

                                                                                            Combined development potential with high
    High geographical overlap                                                               geographical overlap in top tier cities1

    ▪ Both companies’ strong development pipeline is focused on top tier cities with
      significant embedded value of building rights                                                                      Berlin
                                                                                                                          63%
    ▪   Stronger overlap supports planning, negotiation and execution processes

    Acceleration and success of development projects
    ▪ Management team’s expertise of the market in executing development projects, will
      accelerate the completion of TLG’s development pipeline                                        Stuttgart &
                                                                                                        other                         Frankfurt
                                                                                                         8%                             11%
    ▪ Combined larger development team of 30 employees will form a rich pool of
                                                                                                                   Hamburg
      expertise with specialized local market knowledge, led by executives with vast                                 11%
                                                                                                                             Munich
                                                                                                                              7%
      development experience
                                                                                             Aroundtown
                                                                                             TLG
    Large yielding asset base with strong balance sheet
    ▪ Enables to accelerate the organic develop-to-core prime assets while still keeping
                                                                                                                    Hamburg
      total development below 15% of the balance sheet                                                                                   Berlin

    Market leader – letting capabilities
                                                                                                                                           Dresden
    ▪ Stronger pre-letting capability can enable accelerated development without the risk
      of a speculative construction                                                                        Frankfurt

    Strong embedded potential                                                                                 Stuttgart
    ▪ Combined development pipeline embeds significant value creation and rent increase                                           Munich

      potential

1   excluding €750 million of TLG’s currently assessed future value creation potential

                                                                                                                                                     14
Strong synergies identified across the entire value chain

1

                            ◼ Efficiency gains through utilization of scalable platform, systems, low cost structure from larger purchasing power

      Operational           ◼ Synergies through cost reduction on corporate level through centralization, joint functions and lower corporate fees

       synergies            ◼ IT synergies expected to generate further cost synergies

                            ◼ Best-in-class management expertise to unlock the high value-add potential embedded in the combined group

2
                            ◼ Stronger business profile through exposure to a larger and more diversified portfolio will accelerate goal of reaching A category rating, with
                              resulting improved financing terms and consistent access to longer maturities
      Financing /
      credit rating         ◼ Reaching A category rating for the combined company is expected to open new capital markets and investors, introducing a much larger
       synergies              international investor base and significantly higher demand coupled with less supply

                            ◼ Significant long-term refinancing synergies expected across combined debt balance of both companies

3
                            ◼ Management know-how and track record in redevelopment of value-add properties contribute to accelerating of extracting the potential in the
                              combined redevelopment portfolio and bring forward cash flows
                            ◼ Further value-add potential within the combined portfolio which will provide additional long-term value creation
     Development
                            ◼ Large yielding asset base with strong balance sheet enables to accelerate the organic develop-to-core prime assets while still keeping
      synergies               development below 15% of the balance sheet
                            ◼ Stronger pre-letting capability can enable accelerated development without the risk of a speculative construction

                            ◼ Acceleration of pipeline and enhancement of future potential to provide FFO and NAV growth

    Synergies to fuel and accelerate organic growth and creating operational profitability as well as increasing the value creation upside.
              The transaction is expected to be FFO and NAV accretive to the shareholders of both companies from year one

                                                                                                                                                                               15
Synergy potential overview - increasing the combined FFO

    Estimated improvements in FFO1                                                 FFO p.a.
                                                                                                            Efficiency gains through joint operations, joint HQ, strong portfolio
    Operational synergies                                                           €24-€34m                overlap, cost optimization on corporate cost level, ancillary cost
                                                                                                            reduction, scale benefits, IT systems etc.
    Acceleration of financial savings2: reaching A-                                 €64-€80m
                                                                                                            Acceleration of reaching long term target of A credit rating
    rating (on AT in-place debt and perpetual notes)

    Synergies of financial savings2: reaching A- rating                             €22-€25m
                                                                                                            A credit rating unlikely to be achieved on current TLG stand alone
    (on TLG in-place debt and perpetual notes)

    Total improvements, pre-tax                                                €110-139m p.a.

                                                                                   (€18-22m)
    Less current tax (16%)

    Total FFO potential improvement after 5-years                             €92-€117m p.a.

      ▪ In addition €23 - €45m p.a. of FFO increase potential on incremental financing for future growth
      ▪ Management team and expertise, and balance sheet capacity to accelerate execution of the redevelopment pipeline and value-add
        process (not included in the above synergies numbers)
      ▪ The above is not including the ordinary course of business growth derived from like-for-like rental growth and further accretive
        acquisitions

1    FFO figures in this presentation are based on 100% combined company, and are not including the anticipated ordinary course of business like-for-like rental growth and further accretive acquisitions
2    Based primarily on the savings in the spread difference

                                                                                                                                                                                                        16
Increasing operational profitability

Synergy potential from savings and efficiency gains in operational and corporate expenses expected to have partial impact from year 1
after the envisioned merger and are expected to be fully captured within 3-4 years

                                                       Increasing profitability margins by 2.5% to 3.5% 1,2

                  Operational improvements on the property level of the combined portfolio through strong overlap of location in same cities,
                  similar asset types, less competition for tenants, joint operational local offices, pooling of networks, management knowhow
                  transfer, centralized lettings etc.

                  Due to the larger size of the combined portfolio further economies of scale are expected to result in higher operational
                  margins, based on procurement savings, maintenance and other scale effect

                  Corporate level expenses are expected to be reduced through cost effects from economies of scale, centralization and
                  combination of corporate functions, joint departments and headquarters, lower relative fees for audit, legal, advisory etc.

                  IT synergies are expected to generate cost savings, combining the best of the two systems and scaling them up on the
                  enlarged portfolio

                                                        Total operational profitability improvement: €24-€34m FFO3 p.a.

1   Based on combined EBITDA margins
2   Estimated one-off expenses of approx €15-20 million in total over 2 years to capture the operational synergies
3   Pre-tax FFO
                                                                                                                                                17
Envisioned merger will be credit rating enhancing...
... and will provide tailwinds to reach rating target of “A-” and “A” in the long-term

Considerations for rating increase to reach the long-term rating target of A category

Increased Size                  Larger Footprint                                                                               Increased Profitability
                                                                Greater Diversification          Lower Vacancy
Combined company to be          Improved geographic                                                                            Economies of scale and
                                                                                                 TLG’s vacancy of 3% will
one of the largest real         diversification with stronger                                                                  synergies, increasing
                                                                Further diversification within   positively impact the total
estate companies in Europe      presence and focus on top                                                                      profitability and supporting
                                                                                                 vacancy of the combined
with more than €25 billion of   tier cities in Germany and      the strongest asset types                                      operational and financial
                                                                while maintaining the focus      company, which is one of
assets, resulting in lower      the Netherlands                                                                                KPIs
                                                                on offices and hotels.           the parameters for a rating
risk assessment by rating
                                                                Further diversified tenant       upgrade
agencies
                                                                structure

             European real estate sector BBB category is crowded with many issuers while investable capital is limited, weighing on
             AT’s cost of debt. Therefore, AT, the largest European real estate issuer in recent years, is currently paying a
             premium at issuance with its BBB+ rating
             The combined company will become the largest office and hotel real estate company in Europe, benefiting from a strong
             brand and best-in-class access to international equity and debt and capital markets. The combined company would be
             the only Pan-European diversified office/hotel/residential real estate company with an A category rating

    The A rating category will deepen significantly the pool of capital, benefiting from a much larger international investor base with
                                                higher demand coupled with less supply

                                                                                                                                                              18
Enhance credit rating which can accelerate refinancing benefits for Aroundtown
in-place debt1

               Current bonds of real estate companies rated at A- are yielding below 0.5%, well below AT’s current average cost of debt of 1.7%

               A potential merger will support reaching faster an A- rating (and A at a later stage), and as a result enable AT to benefit sooner from the current historically attractive financing
               environment. The below savings from reaching an A- rating are expected to be captured within the first 5 years after the envisioned merger

Decreasing financing cost on existing debt of AT2
              AT’s debt balance, including Q3 2019 issuances, amounts to €10.4 billion with an
              average cost of debt of 1.7%                                                                  Sensitivity on incremental interest cost savings p.a. (€m):
                                                                                                            % of debt refinanced (Row) / CoD savings p.a. (Column)
              75% of the debt balance will mature by 2028 and following AT’s strategy to
              proactively manage maturities is expected to be repaid within 5 years after the                                0.50%        0.60%         0.70%        0.80%         0.90%         1.00%
              merger
                                                                                                                  70%            36            44           51            58           66              73
               Management estimates interest margin reduction on AT’s existing debt in the
               range of 0.6%-0.7%, as a result of a rating upgrade to A- and as the only                          75%            39            47           55            62           70              78
               diversified Pan-European office/hotel/residential real estate company in the A
               category rating                                                                                    80%            42            50           58            67           75              83
            Reaching A- credit rating is expected to accelerate financing improvements                            85%            44            53           62            71           80              89
                           of €47- €58m within 5 years after the merger
                                                                                                                 100%            52            62           73            83           94          104
Decreasing coupon payments on existing perpetual notes
              Current perpetual balance, including Q3 2019 issuances, amounts to €2.5bn, at                                                                          Avg. Coup. 2.2% Avg. Coup. 2.0%
              an average coupon rate of 2.9%                                                                                                                          (0.7% coupon     (0.9% coupon
                                                                                                                                                                      cost savings)    cost savings)
              Potential coupon savings on the existing notes to be in the range of 0.7%-0.9%,                Current perpetual balance, including Q3 19 issuances                €2,500m
              reducing the average coupon to 2.0%-2.2%.                                                      Current run rate of coupon payments p.a.                                €72m
              Saving to be captured in full within 5 years after the merger, which will be after             5 years post merger run rate of coupon payments p.a.          €55m                €50m
              the first call date of each perpetual note                                                     Total coupon savings p.a.                                     €17m                €22m

                                      Acceleration of Aroundtown’s financial savings, reaching A- rating: €64-€80m FFO3 p.a.

1   Assuming A- rating will be reached. Currently AT‘s credit rating is BBB+ stable
2   Prepayments fees are estimated to be in the range of €75-€140m one-time fee
3   Pre-tax FFO all else equal
                                                                                                                                                                                                        19
Merger to create financial synergies reducing the cost of TLG’s debt and
perpetual notes1

              TLG’s existing debt and perpetual balance will benefit from the credit rating of the combined entity. For TLG stand alone, reaching an A- rating is highly unlikely without a merger, and
              therefore a potential merger includes significant synergetic effects

Decreasing financing cost on existing debt of TLG2

              TLG’s balance, amounts to €2.7 billion with a shorter maturity schedule than AT.              Sensitivity on incremental interest cost savings p.a. (€m):
              The debt balance will mature by 2028, which is expected to be repaid within 5                 % of debt refinanced (Row) / CoD savings p.a. (Column)
              years after merger
                                                                                                                             0.50%         0.60%         0.70%        0.80%         0.90%         1.00%
              Management estimates interest margin reduction on TLG’s existing debt in the
              range of 0.6%-0.7%, as a result of a rating upgrade to A-                                            80%         11            13            15           17            19            22

                                                                                                                   90%         12            15            17           19            22            24

                                                                                                                 100%          14            16            19           22            24            27

                        Reaching A- credit rating on TLG’s existing debt, is expected to generate synergies of €15- €17 million within 5 years after the merger

Decreasing financing cost on existing perpetual notes
                                                                                                                                                                      Avg. Coup. 2.2% Avg. Coup. 2.0%
                                                                                                                                                                       (1.2% coupon    (1.4% coupon
              TLG’s € 600 million perpetual note issued in September 2019, bears a coupon of                                                                           cost savings)   cost savings)
              3.4%, well above levels of A- rated real estate companies                                       TLG perpetual note                                                   €600m
                                                                                                              Current run rate of coupon payment p.a.                                 €20m
              Potential spread savings on the TLG note of 1.2%-1.4%. First call date in 2024,                 5 years post merger run rate of coupon payments p.a.           €13m               €12m
              therefore savings expected to be captured within 5 years after merger                          Total coupon savings p.a.                                       €7m                €8m

                          Synergies from financial savings on TLG’s debt and perpetual, reaching A- rating: €22-€25m FFO3 p.a.

1   Assuming A- rating will be reached for the combined company. Currently TLG‘s rating is BBB/Baa2 positive
2   Prepayments fees are estimated to be in the range of €10-15m one-time fee
3   Pre-tax FFO all else equal
                                                                                                                                                                                                          20
Combined debt maturity schedule

       Aroundtown Bonds                    Aroundtown Bank Loans                Aroundtown Perpetual Notes                  TLG Bonds                 TLG Bank Loans                 TLG Perpetual Notes

 Total in
   €bn                                     ~75% of total maturing of the combined companies               ~85% of total maturing of the combined companies

                                                                  2.8           2.9

                                                                                               2.1

                                                    1.8

                                                                                                                           1.5
                                                                                                                                          1.3

                                     1.1

                                                                                                             0.8

                                                                                                                                                                       0.4            0.4

         0.2                                                                                                                                                                                        0.2
                       0.1                                                                                                                              0.2

       2020 1         2021          2022            2023         2024           2025          2026          2027           2028          2029           2030          2031           2032         >2033

       Combined maturity schedule with an average term of approx. 7 years, average cost of debt (pre realisation of expected financial
                                          synergies) of 1.7% and interest hedging ratio of 97%
Note: Maturity profile derived through the straight combination of existing maturities for Aroundtown and TLG; Analysis shows maturity of outstanding principal only, Graph includes first call dates of
perpetual notes; Both companies as of September 2019
1 Includes 2019 maturities

                                                                                                                                                                                                           21
Enhanced credit rating decreases financing cost for future growth
The combined company will continue its accretive growth, thus funding through debt and perpetual
issuances
Capital Market Activities of AT and TLG
                                              TLG                                                           AT and TLG issued on average €4.4 billion per annum of debt and
    Aroundtown was the
    largest listed European
                                              AT                                                            equity capital since 2016.
    RE issuer in 2016 - 20192                 Combined new company incremental
                                                                                                            Assuming conservatively annual issue of €1.5bn will result in €7.5bn
                                              growth financing (conservative assumption)
                                                                                                            of new debt in the next five years.
                                             6.4

                  4.6
                                4.2

                                                                                                                                               Lower range         Upper range
      2.6
                                                                                                  Interest/coupon saving p.a.                           0.5%                0.6%
                                                         ~1.5         ~1.5         ~1.5
                                                                                                  Year 1 (on €1.5bn notional)                            €8m                 €9m

                                                                                                  Year 3 (on €4.5bn notional)                           €23m                €27m
     2016        2017           2018     2019YTD       1st year     2nd year     5th year
                                                        after         after        after          Year 5 (on €7.5bn notional)                           €38m                €45m
                                                       merger        merger      merger

              In line with the estimated effect of reaching an A- rating for a combined
              company, significant synergies from interest cost saving are expected,
              for issuances of new debt and perpetual notes.

                                         Total financing savings on new debt and perpetual issuances: €23-€45m FFO1 p.a.

1   Based on a 3-5 year future growth funding; pre-tax FFO; 2 By debt and equity capital issued

                                                                                                                                                                                   22
Sustaining the conservative financial policy

The combined company remains committed to its conservative financial policy

         The LTV will remain below 45% after the merger, following the conservative financial policy. Focus remains on conservative
         financial ratios with a high interest cover ratio

         Proactively optimize debt profile, maintain a diversified long debt maturities profile, keep a larger pool of unencumbered
         assets

         Dividend distribution of 65% - 70% of FFO I per share

         Strive for A rating with the current financial profile

                                                                                                                                      23
Additional benefit from management expertise supporting to accelerate the
redevelopment pipeline

                                                                                          FFO of TLG’s Development projects after completion
     Experience and knowledge of the market, as well as its track record in
                                                                                          (not included in the merger synergies calculations)
     improving development rights, building permits, redevelopment
     construction and value-add will accelerate TLG’s redevelopment
                                                                                           Total value of projects after completion                                    €3,330m
     pipeline
                                                                                           Rent multiple (rent per sqm)                                          27x (27 €/sqm)

     Liquidity and superior access to financing will accelerate the                        Rent of projects after completion                                         €123m p.a.
     development schedule                                                                  Current rent of projects, before development                               -€16m p.a
                                                                                           Additional rent from development                                          €107m p.a.
     Benefit from lower cost of debt for the development, further increasing
     the combined FFO                                                                      Expected NOI margin                                                              88%
                                                                                           NOI on addtional rents from development                                    €94m p.a.
     TLG’s current development ratio is half of its assets, weighing on the                Financing costs on total investments costs
     risk perception and rating. The total volume of the development
                                                                                           (€1,770 million at 0.7% interest p.a)
     projects will be less than 15% of the combined balance sheet,                                                                                                    -€12m p.a.
     accelerating the portfolio redevelopment and not over-weighing with a                 Total FFO (before tax)                                                      €82m p.a.
     large development ratio

     There is potential to extract faster additional benefits from the combined portfolio, which will provide additional value creation, that is currently still under
     assessment. Currently, TLG estimates €750 million additional value creation. This additional value can be extracted as follows:

             Stronger negotiation power with municipalities and long-term relationships and experience will support optimization of building rights and plans

             Expected reduction of construction cost estimates through economies of scale and an established large construction team

             Larger letting team, with direct connection to the largest space seekers in Germany’s large cities, is expected to result in a higher pre-letting ratio and at a
             higher rent per sqm. Stronger pre-letting capability can enable accelerated development without the risk of a speculative development

         Accelerating and executing TLG’s development projects successfully will contribute additional upside potential

                                                                                                                                                                                24
The combined business is built on the value-add model

                                                                                                       ◼ Larger scale in similar locations and
                                                                                                         asset types
 ◼ Portfolio with significant value-add potential      ◼ Significant value-add potential in the        ◼ Management ability to accelerate like-for-
 ◼ Strong capital market access to funding               core portfolio                                  like rental growth
 ◼ Strongest European deal flow and unique             ◼ High quality stable prime portfolio at        ◼ Stronger negotiation position with
   deal sourcing network                                 low vacancy                                     tenants
 ◼ Redevelopment management knowledge                  ◼ Significant redevelopment potential in        ◼ Healthy redevelopment portion on a
   and experience                                        top tier locations                              larger scale
 ◼ European footprint, well diversified portfolio      ◼ Strong Berlin foothold                        ◼ Stronger operational platform with higher
 ◼ Diversified and strong tenant structure             ◼ Optimised IT-based processes                    profitability
 ◼ Large market cap and share liquidity                ◼ 25 years of track record                      ◼ Integrated IT workflow system

 ◼ Proven track record in asset sales, large sales                                                     ◼ Stronger ESG and more diverse
   team                                                                                                  shareholder structure
                                                                                                       ◼ Accelerated sales of non-core assets
                                                                                                       ◼ Higher rating with lower cost of debt and
                                                                                                         perpetual notes
                                                                                                       ◼ Potential Dax inclusion
                                                                                                       ◼ Strongest European deal flow

 ▪ Positioned as a market leader in the European real estate market, resulting in a lower cost of equity contributing to value creation potential
   and potential FFO yield compression. This synergy upside is currently not factored in
 ▪ The synergies, in combination with the large size of free float, will support a potential DAX inclusion, opening the investor base for new
   markets with increased visibility and liquidity

                                                                                                                                                      25
Revised and stronger governance

                                                                        CHAIRMAN

                                                                       Chairman
                                                                  with a casting vote
                                                              to be nominated by TLG              7-8 members in total,
                                                             (if acceptance rate >40% )       out of which 3-4 independent

                                                                               CEO
                                                                                            To be nominated by Aroundtown

                                                                               CFO          To be nominated by TLG
                                                                                            (if acceptance >50%)

                                                                                              Co-      One of TLG’s nominees
                                                                                              CEO      will be Co-CEO

                                                                 CIO        COO       CDO

                                                                                                  1 of 3 to be nominated by TLG
                                                                                                  (if acceptance rate >66%)

   Advisory Board of Aroundtown will stay intact with the leadership of Dr Gerhard Cromme(chairman) and Mr Gabay (vice chairman)

                                                                                                                                   26
The transaction is accretive to both shareholder groups

                                                  1
FFO Accretion on a per share basis

                                                                                                        ~                            ~                          ◼ The deal would
                                                                                                                                                                   be FFO accretive
                                              ~                            ~                                                                                       for shareholders
                                                                                                                                                                   in year one and
      (€ / share)
    FFO

                                                                                                                                                                   increasing with
                                                                                                                                                                   synergies and
                                                                                                                                                                   acceleration of
                             2                              3                                                        4
                                                                                                                                                                   over €100m4:
                                                                                                                                                                ◼ ~25% accretive

     ▪ Transaction is accretive to both shareholder groups
     ▪ Analysis excludes long-term synergies from acceleration of development & value-add upside as well as
       potential DAX inclusion
     ▪ FFO accretion calculation is based only on the combined merger effects, and does not include any internal and
       external growth
     ▪ Assuming current dividend policy transaction would also be accretive on DPS and also shareholder value
       accretive per share including synergies

1Based on 100% acceptance rate and a 3.6x exchange rate; 2 Based on Aroundtown FFO per share 2019E guidance, taken as mid-point of range; 3 Based on TLG FFO per share 2019E guidance,
excluding AT shares held by TLG (1,443m shares outstanding), 4 Mid-point synergies captured with 5-years post merger

                                                                                                                                                                                         27
Timeline / next steps

                                                                 ✓
              Nov 18, 2019: Signing of Business Combination
                             Agreement (BCA)
              and publication of the decision to make an offer
                        (Section 10 announcement)                                                                                       Q1 2020: Expected closing

                                                                               4 weeks offer period   2 weeks additional offer period

 Timeline                       Nov-19                           Dec-19                Jan-20                     Feb-20

              Oct 27, 2019:
            Announcement of
            non-binding terms   ✓                      Before year-end 2019: Expected launch
                                                                of tender offer period

                                                                                                                                                                    28
APPENDIX

           29
Combined portfolio overview (June 2019)

Breakdown by asset type

                                                    Investment           Lettable area                         Annualized net
                                                   property (€m)           (m sqm)       EPRA Vacancy   WALT     rent (€m)    Value/sqm (€)   Rental Yield

 Office                                                 10,458                   4,084       9.3%        4.8        486           2,561          4.6%

 Hotels                                                 4,755                    1,475       5.1%       15.1        230           3,224          4.8%

 Logistics / Wholesale / Other                          1,667                    1,722       4.5%        6.3        101            968           6.1%

 Retail                                                 2,066                    1,119       5.3%        5.7        133           1,846          6.5%

 Land for development & other rights                    1,860

 Total Commercial                                       20,806                   8,400       7.2%        7.5       9671           2,255          5.0%

 Residential2                                           2,961                    2,005       7.3%                   139           1,359          5.1%

 Total Group                                            23,767               10,405          7.2%                  1,106          2,083          5.0%

                 Diversified mix of high quality commercial and residential real estate, with scale across all strategic asset classes

Note: As of June 2019
1 Including annualized rent from TLG’s invest portfolio (€16m as of June 2019)
2 Reflected by holding of 39% in GCP

                                                                                                                                                         30
Quality Frankfurt assets in central locations                                                                                     landmark

                                                                                                                                AT -property

Strong overlap in top tier cities, positioning the combined company as a leading landlord                                       TLG -property

                                                                Frankfurt Stadtmitte
                                                                Office

 InterContinental Frankfurt
 Hotel

                 Frankfurt HBF        Frankfurt Office Campus
                 Offices              Offices

                                   Frankfurt
                                 Hauptbahnhof
                                 (Central Train                         Frankfurt Deutsche Bahn
                                   Station)                             Office

                                                                                Frankfurt HBF
                                                                                Office
                                                                                                  Frankfurt
                                                                                                  Frankfurt Büro Center (FBC)
                                                                                                  Office

                                                                                                             Frankfurt HBF
                                                                                                             Office

                                                                                                                                             31
Frankfurt Overview – Eschborn & Niederrad                                                                                                                                          landmark

                                                                                                                                                                                 AT -property

Centrally located office and hotel assets in key business districts                                                                                                              TLG -property

Frankfurt-Eschborn business district is an important FFM business district and easily accessible

                                                                                 Eschborn
                                                                                 Office                                Strong overlap in top tier cities, positioning the
                         “Bürostadt Eschborn”
                         Main business district                                             Frankfurt Office Complex
                                                                                                                       combined company as a leading landlord
                                                                                            Office

         Eschborn Office Center
         Office

                                                                                                                                                        “Bürostadt Eschborn”
                                          The Cube – Deutsche Börse                          Eschborn Office Complex                                    Main business district
                                          Frankfurt Stock Exchange                           Office

                         Eschborn
                         Office

 Frankfurt-Niederrad business district is well located
                                                                                                                                          Frankfurt
 between the airport and the main train station                                                                                           main central train station

                       Frankfurt Office West
                       Office                        Frankfurt Office District     University Hospital
                                                     Office                        Frankfurt
  Frankfurt Office District
  Office
                                                                                                                               “Bürostadt Niederrad”
                                                           “Bürostadt Niederrad”                                               office district
                                                           office district

              Frankfurt Office District                         Frankfurt Office District
              Office                                            Office

                                                                                                                                Frankfurt International Airport
                                                         Frankfurt Crowne Plaza Congress Hotel
                                                         Hotel

                                                                                                                                                                                              32
Leipzig - Centrally located top tier assets at Leipzig Hauptbahnhof                                                                                           landmark

                                                                                                                                                             AT -property

Strong overlap in top tier cities, positioning the combined company as a leading landlord                                                                   TLG -property

                                                                                                              Main central train station
                                                                                                              Office
                       Leipzig main central train
                       station

                                                                                 Main central train station
                                                                                 Office                                               Main central train station
                                                                                                                                      Office
                                               Main central train station
                                               Office & Hotel

        City Center Promenade Nikolaikirche
        Office/Retail

                                                         University of Leipzig

                                                                                                                                                                         33
Dresden - Prime assets in Dresden’s historic city center                                                                                            landmark

                                                                                                                                                  AT -property

Strong overlap in top tier cities, positioning the combined company as a leading landlord                                                         TLG -property

                                                                         Main Central Train Station

                                      Main Central Train Station Hotel

                                      City Center                                                        Main Central Train Station
                                      Retail                                                             Office

                                    City Center                                           City Center
         City Center
                                    Office                                                Office
         Office

                                                                                                        Motel One Zwinger
                                                                     Zwinger                            Hotel
                                                                     Office

        Hotel de Saxe City Center                                                                          Zwinger
        Hotel                                                                                              Development

                                                                                                                         Zwinger
                                                                                                                         Office

                               Frauenkirche

                                                                                                                Holiday Inn Dresden City Center
                                                                                                                Hotel
                                                                               Parliament of Saxony

                                                                                                                                                               34
Mannheim - Well positioned office and hotels in central Mannheim                                                        landmark

                                                                                                                      AT -property

Strong overlap in top tier cities, positioning the combined company as a leading landlord                             TLG -property

                                           City Center
                                           Hotel

                                                                                                         Luisenpark
                University of Mannheim /                 Mannheim main central              Luisenpark
                Mannheim Palace                          train station                      Office

                                                                                  Mercure Friedenspark
                                                                                  Hotel

                                                                                 Mannheim
                                                                                 Offices

                                                                                                                                   35
Stuttgart - Well connected quality assets in Stuttgart’s office district                      landmark

                                                                                            AT -property

Strong overlap in top tier cities, positioning the combined company as a leading landlord   TLG -property

                                     Stuttgart government seat

                                                                     Stuttgart Center
                                                                     Office

                                                                  Stuttgart Center
                                                                  Office
                       Stuttgart Center
                       Office

                                                                                                         36
Hamburg                                                                                                                 landmark

                                                                                                                      AT -property

Strong overlap in top tier cities, positioning the combined company as a leading landlord                             TLG -property

         Hamburg Business District                                       Hamburg Business District
         Office                                                          Office

   Hamburg Business District                                                                         Science Campus
   Office
                                                                         Hamburg Business District
                                                                         Office

                                     Mercure Hamburg Business District
                                     Hotel

                                                                                                                                   37
Regional Market overview

             NRW                                                   Bremen                                           Hamburg
             ◼ GDP share 2017 : 21% of total national              ◼ GDP growth1 : 3.3%                             ◼ GDP growth1: 2.4%
             ◼ GDP growth1: 1.7%                                   ◼ Migration balance2: 1.1%                       ◼ Migration balance2: 0.9%
             ◼ Migration balance2: 0.7%                            ◼ Population density3: 1,734 per km2             ◼ Population density3: 2,397 per km2           1. GDP Growth:
             ◼ Population density3: 524 per km2
                                                                                                                                                                   2017. Data from the
Amsterdam                                                                                                                  Hannover
                                                                                                                           ◼ GDP growth (NI) 1: 2.5%
                                                                                                                                                                   respective federal
◼ GDP growth: 3.8%
◼ Migration balance2: 6.9%                                                                                                 ◼ Migration balance2: 1.3%              state is used in case
◼ Population density2: 5,111 per km2                                                                                       ◼ Population density3: 2,608 per km2    city data is not
                                                                                                                                                                   available – NL
Utrecht                                                                                                                     Berlin                                 provisional figures
◼ GDP growth: 3.2%                                                                                                          ◼ GDP growth1: 3.1%
◼ Migration balance2: 2.6%                                                                                                  ◼ Migration balance2: 1.2%             2. Migration
◼ Population density2: 3,644per km2                                                                                         ◼ Population density3: 4,012 per km2      balance:
    Rotterdam                                                                                                                                                      Average annual
    ◼ GDP growth: 3.3%
                                                                                                                                                                   migration balance
    ◼ Migration balance2: 1.8%
                                                                                                                     Dresden/Leipzig/Halle                         2013-2016, domestic
    ◼ Population density3: 2,943 per km2
                                                                                                                     ◼ GDP growth (SN) 1 : 1.4%
                                                                                                                     ◼ Migration balance2: 0.4%-1.4%
                                                                                                                                                                   & foreign migration
                               Frankfurt                                                                             ◼ Population density3: 1,666-1918 per km2
                               ◼ GDP growth (HE) 1 : 2.2%
                                                                                                                                                                   3. Population
inhabitants per                ◼ Migration balance3: 1.2%                                                                                                             density:
sqkm (2013)                    ◼ Population density4: 2,966 per km2                                            Nuremberg/Fuerth
                                                                                                               ◼ GDP growth (BA)1: 2.2%                            Residents per Sqk
                                                                                                               ◼ Migration balance2: 1.2%
                                       Mannheim                                                                                                                    (2016/NL 2017)
                                       ◼ GDP growth (BW) 1 : 2.3%                                              ◼ Population density(N)3: 2,966 per km2

                                       ◼ Migration balance2: 0.9%
                                       ◼ Population density3: 2,102 per km2
                                                                                                               Munich
                                                                        Stuttgart                              ◼ GDP growth (BA) 1 :2.8%
                                                                        ◼ GDP growth (BW) 1 : 2.3%             ◼ Migration balance2: 1.2%
                                                                        ◼ Migration balance2: 1.0%             ◼ Population density3: 4,713 per km2
                                                                        ◼ Population density3: 3,029 per km2

                                                                                                                                                                                           38
Germany/NL – growing and top tier economies

GDP per capita in 2009 – 2018 (in €)                                                                          GDP per capita in 2009 – 2018 (in €)
             EU (28)                    Czechia                   Germany                     Spain                131.1
             France                     Italy                     Hungary                     Netherlands
             Poland                     Slovakia                  UK
€45,000                                                                                Netherlands, €41,600
                                                                                       Germany, €35,900

€35,000                                                                                France, €32,800
                                                                                       UK, €32,400
                                                                                       EU (28), €28,200
                                                                                                                                    30.7                29.7
                                                                                       Italy, €26,700
€25,000
                                                                                       Spain, €25,000
                                                                                       Czechia, €17,600
                                                                                       Slovakia, €15,600
€15,000
                                                                                       Hungary, €12,500
                                                                                       Poland, €12,400                                                                   (17.2)           (28.7)      (31.5)
 €5,000                                                                                                           Germany        Netherlands            Italy            Spain             UK        France
          2009   2010     2011   2012    2013      2014   2015   2016    2017   2018

Source: Eurostat, unadjusted                                                                                  Source: Tradingeconomics.com, data for Jan-Jul 2019

  Aroundtown’s competitive advantage starts with the regional focus. Aroundtown focuses on Germany and Netherlands, the strongest
                                                and most stable economies in Europe

Debt/GDP 2019 Q1                                                                                              Budget Surplus (Deficit) as % of GDP – 2019 Q1 LTM

                                                                                               134.0%              1.8%          1.7%

                                                                 98.7%          99.7%

                                  80.7%             85.3%
                                                                                                                                               (0.7)%
                       61.0%                                                                                                                                    (1.2)%
     50.9%
                                                                                                                                                                             (2.1)%         (2.4)%
                                                                                                                                                                                                     (3.2)%
  Netherlands      Germany          EU               UK          Spain          France           Italy           Germany    Netherlands         EU               UK               Italy      Spain   France

Source: Eurostat                                                                                              Source: Eurostat

                                                                                                                                                                                                               39
Germany/NL – strong labor market

Development of gross monthly wages Germany (in €)                                                                                                           Unemployment rate Aug 2019

                                                                                                                                                    3,880
                                                                                                                                        3,771                                                                                                       13.8%
                                                                                                                          3,703
                                                                                                           3,612
                                                                                            3,527
                                                                             3,449
                                                               3,391                                                                                                                                                                       9.4%
                                                3,311                                                                                                                                                                        8.5%
                                  3,227
                3,141

                                                                                                                                                                                                3.5%          3.8%
                                                                                                                                                                                     3.1%

                  2009            2010          2011           2012           2013           2014           2015          2016              2017    2018                            Germany   Netherlands      UK           France          Italy   Spain

Source: destatis, industry and service sector, fulltime employment excluding bonuses                                                                        Source: Tradingeconomics.com

                                                                                    …which is further supported by a strong labor market with increasing wages

Unemployment rate Germany 2003 – Aug 2019                                                                                                                   Unemployment rate Netherlands 2003 – Aug 2019
                                                                                                                                                                                                        Seasonally adjusted Employed labour force
                                                       Persons in employment                                Unemployment rate
                                                                                                                                                                                                        Seasonally adjusted unemployment rate
                      43                                                                                                                            12.0%                           9Mn                                                                12.%

                                                                                                                                                            Persons in Employment

                                                                                                                                                                                                                                                             Unemployment rate
                      42
 People in Millions

                                                                                                                                                    10.0%                                                                                              10.%
                      41
                      40                                                                                                                                                            9Mn
                                                                                                                                                    8.0%                                                                                               8.%
                      39
                      38                                                                                                                            6.0%                                                                                               6.%
                                                                                                                                                                                    8Mn
                      37                                                                                                                            4.0%                                                                                               4.%
                      36
                      35                                                                                                                            2.0%                            8Mn                                                                2.%

                                                                                                                                                                                          2010

                                                                                                                                                                                          2016
                           2003
                                  2004
                                         2005
                                                2006
                                                        2007
                                                               2008
                                                                      2009
                                                                             2010
                                                                                    2011
                                                                                           2012
                                                                                                  2013
                                                                                                         2014
                                                                                                                2015
                                                                                                                       2016
                                                                                                                              2017
                                                                                                                                     2018
                                                                                                                                             2019

                                                                                                                                                                                          2003
                                                                                                                                                                                          2003
                                                                                                                                                                                          2004
                                                                                                                                                                                          2004
                                                                                                                                                                                          2005
                                                                                                                                                                                          2005
                                                                                                                                                                                          2006
                                                                                                                                                                                          2006
                                                                                                                                                                                          2007
                                                                                                                                                                                          2007
                                                                                                                                                                                          2008
                                                                                                                                                                                          2008
                                                                                                                                                                                          2009
                                                                                                                                                                                          2009
                                                                                                                                                                                          2010
                                                                                                                                                                                          2011
                                                                                                                                                                                          2011
                                                                                                                                                                                          2012
                                                                                                                                                                                          2012
                                                                                                                                                                                          2013
                                                                                                                                                                                          2013
                                                                                                                                                                                          2014
                                                                                                                                                                                          2014
                                                                                                                                                                                          2015
                                                                                                                                                                                          2015
                                                                                                                                                                                          2016
                                                                                                                                                                                          2017
                                                                                                                                                                                          2017
                                                                                                                                                                                          2018
                                                                                                                                                                                          2018
                                                                                                                                                                                          2019
                                                                                                                                                                                          2019
Source: destatis, monthly                                                                                                                                   Source: CBS, national statistics office, monthly

                                                                                                                                                                                                                                                            40
German office market low supply and strong demand…
Low supply and strong demand…

Office employment growth remains strong                                                               Continuously strong demand at low supply

                  Office workers in million persons           Office space in million sqm                               Office space from 2008-2018 in %     Office workers from 2008-2018 in %
 2.6                                                                                        85          35

 2.4                                                                                        80          30

                                                                                            75          25
 2.2
                                                                                                        20
                                                                                            70
 2.0                                                                                                    15
                                                                                            65
                                                                                                        10
 1.8                                                                                        60           5
 1.6                                                                                        55           0
       1992 1994 1996 1998 2000 2002 2004 2006 2008 2010 2012 2014 2016 2018                                  Berlin    Dusseldorf Frankfurt Hamburg       Cologne     Munich        Stuttgart    Top-7

Source: DZ HYP German Real Estate Market report – 2019/2020 - BulwienGesa, Scope, DZ                  Source: DZ HYP German Real Estate Market report – 2019/2020 - BulwienGesa, Scope
BANK AG

Leading to increased office take-up
                                                                                                      Take-up in per cent of the office space inventory
                     Office space take-up of all 19 locations in million sqm
                     Top-7: office space take-up in % of the total office space
                                                                                                                       2019 H1
   7                 Regional-12: office space take-up in % of the total office space       5.0          7
   6                                                                                        4.5          6
                                                                                                             2010
   5                                                                                        4.0          5
   4                                                                                        3.5          4
   3                                                                                        3.0          3
   2                                                                                        2.5          2
   1                                                                                        2.0          1
   0                                                                                        1.5          0
       1992 1994 1996 1998 2000 2002 2004 2006 2008 2010 2012 2014 2016 2018                                  Berlin    Dusseldorf Frankfurt Hamburg       Cologne     Munich        Stuttgart    Top-7

Source: DZ HYP Main Regional Real Estate Markets in Germany 2019 - BulwienGesa                        Source: DZ HYP German Real Estate Market report – 2019/2020 - BulwienGesa

Note: Top 7 locations according to DZ HYP: Berlin, Munich, Frankfurt, Cologne, Hamburg, Düsseldorf, Stuttgart; Regional 12 according to DZ HYP: Hannover, Nuremberg, Essen, Leipzig, Dresden,
Bremen, Karlsruhe, Münster, Mannheim, Darmstadt, Mainz and Augsburg

                                                                                                                                                                                                      41
German Office market
…lead to increasing rents and lower vacancies

                  Strong economic fundamentals and high office employment drive up demand, whilst supply is lacking, reducing vacancies

Putting upward pressure on rents                                                                                                                             Strong reductions in vacancy in top locations
Prime rent yoy in %                                                           Prime rents yoy in %                                                           Vacancy rate in %
                                                                                          Berlin                Dusseldorf         Frankfurt
  8                            Regional-12                 Top-7                                                                                              20
                                                                                          Hamburg               Cologne            Munich
  6                                                                                       Stuttgart                                                           18
  4                                                                               16                                                                          16
                                                                                  14                                                                          14          2010
  2                                                                               12
                                                                                                                                                              12
  0                                                                               10
                                                                                   8                                                                          10
 -2                                                                                                                                                                         2020e
                                                                                   6                                                                           8
 -4                                                                                4
                                                                                                                                                               6
                                                                                   2
 -6                                                                                0                                                                           4
 -8                                                                               -2                                                                           2
                                                                                  -4
      2019e
       2010
       2004
       2005
       2006
       2007
       2008
       2009

       2011
       2012
       2013
       2014
       2015
       2016
       2017
       2018

                                                                                                                                                               0
                                                                                  -6
                                                                                                                                                                           Berlin          Dusseldorf Frankfurt           Hamburg     Cologne   Munich    Stuttgart        Top-7
                                                                                       2011 2012 2013 2014 2015 2016 2017 2018 2019

                                                                                                                                                             Source: DZ HYP German Real Estate Market report – 2019/2020 – BulwienGesa,, DZ
                                                                                                                                                             BANK AG
                                                                                                                                                                                                                 52.3
                                                                                       prime rent 2018 in EUR per sqm              42.9                      prime rent 2008 to 2018 in %

                                   30.0                                                29.1                                                                   26.6                             29.4
                                                             25.0                                   23.4                                         22.4                                                                                 22.7
      18.2                                                               20.9                                  20.8       20.0                                                                                                                            20.0
                                                                                                                                                                                                                           14.6                                       12.9
                                              10.0                                                                                                                                                          8.1
                     4.0                                                                                                                                                         4.8

                                                                                                                                                                                                                                                          37.2        39.5
                                                                                                                                                                                                                                      30.9      33.5
                                                                                                                                                                                                            25.5           27.5
                                                                                                                                                                              22.0             22.0
      13.0           13.0          13.0       13.2           13.5        13.9          14.2         14.3       14.5       15.0     15.0          15.3         16.2
                                                                          Mainz

                                                                                                      Reg-12

                                                                                                                Münster

                                                                                                                                                                                                Stuttgart
                                                                                                                                    Numermberg

                                                                                                                                                               Mannheim

                                                                                                                                                                                                                                                           Munich
                                    Dresden

                                                                                                                                                                                                                                                                       Franfurt
                                                                                                                                                                                                                            Hamburg

                                                                                                                                                                                                                                        Top-7
                                               Darmstadt

                                                               Leipzig

                                                                                        Karlsruhe

                                                                                                                                                  Hannover
       Augsburg

                      Bremen

                                                                                                                           Essen

                                                                                                                                                                                 Cologne

                                                                                                                                                                                                                                                 Berlin
                                                                                                                                                                                                             Düsseldorf
Note: Top 7 locations according to DZ HYP: Berlin, Munich, Frankfurt, Cologne, Hamburg, Düsseldorf, Stuttgart; Regional 12 according to DZ HYP: Hannover, Nuremberg, Essen, Leipzig, Dresden,
Bremen, Karlsruhe, Münster, Mannheim, Darmstadt, Mainz and Augsburg

                                                                                                                                                                                                                                                                                  42
German Office market
meanwhile investor appetite reduces yields

Low treasury yields and continued high demand, especially in office…
Bund yields fall to historic lows                                                                                                    Investment volume in property market                                                                                            Market share
                                                                                                                                     could also reach a high level in 2019

                              5 years                      10 years                                       30 years                           Residential portfolios                               Commercial real estate                                                        Office                  Retail                  Logistics                     Hotel                   Other
  5
                                                                                                                                                                                                                                                                      50
  4
                                                                                                                                                                                                                                                                      40
  3
                                                                                                                                                                                                                        55.5                                          30
  2                                                                                                                                                                                                                                      57.2 60.6
                                                                                                                                         53.3                                                                                   52.5
                                                                                                                                                                                                                                                                      20
  1                                                                                                                                                                                                     30.5 39.9
                                                                                                                                                                                                25.0
  0                                                                                                                                          21.1                           19.1 23.0
                                                                                                                                                                              23.5
                                                                                                                                                                                                                                                                      10
                                                                                                                                         12.0 4.8 10.1
                                                                                                                                                   3.3 3.8 6.0 11.0
                                                                                                                                                                    13.7 12.8      13.2 15.6 15.1
                                                                                                                                                                                                                                                                            0
 -1

                                                                                                                                                                                                                                                                                                                  2011
                                                                                                                                           2007

                                                                                                                                                    2008

                                                                                                                                                                  2009

                                                                                                                                                                                2010

                                                                                                                                                                                         2011

                                                                                                                                                                                                 2012

                                                                                                                                                                                                         2013

                                                                                                                                                                                                                 2014

                                                                                                                                                                                                                         2015

                                                                                                                                                                                                                                  2016

                                                                                                                                                                                                                                          2017

                                                                                                                                                                                                                                                   2018

                                                                                                                                                                                                                                                                                2007

                                                                                                                                                                                                                                                                                        2008

                                                                                                                                                                                                                                                                                                 2009

                                                                                                                                                                                                                                                                                                         2010

                                                                                                                                                                                                                                                                                                                         2012

                                                                                                                                                                                                                                                                                                                                  2013

                                                                                                                                                                                                                                                                                                                                                2014

                                                                                                                                                                                                                                                                                                                                                       2015

                                                                                                                                                                                                                                                                                                                                                              2016

                                                                                                                                                                                                                                                                                                                                                                        2017

                                                                                                                                                                                                                                                                                                                                                                               2018
                                                                                                                                                                                                                                                             2019e

                                                                                                                                                                                                                                                                                                                                                                                        19H1
                       2009
        2007

                2008

                                2010

                                        2011

                                                 2012

                                                           2013

                                                                         2014

                                                                                       2015

                                                                                                 2016

                                                                                                           2017

                                                                                                                   2018

                                                                                                                           2019

Source: DZ HYP German Real Estate Market report –                                                                                        Source: DZ HYP German Real Estate Market report –                                                                           Source: DZ HYP German Real Estate Market report –
2019/2020 – Datastream                                                                                                                   2019/2020 – Ernst & Young, DZ BANK AG                                                                                       2019/2020 – BNP Paribas Real Estate, CBRE

…put considerable pressure on office yields, especially in central Top 7 Locations
Net initial yield in central office locations in %                                                                                                                                                              Net initial yield in central office locations in %

                                                        Top locations                                                      Regional centres                                                                                      Berlin                                     Dusseldorf                              Frankfurt                                        Hamburg
  7.0
                                                                                                                                                                                                                                 Cologne                                    Munich                                  Stuttgart
  6.5                                                                                                                                                                                                              6.0
  6.0
                                                                                                                                                                                                                   5.5
  5.5
                                                                                                                                                                                                                   5.0
  5.0
                                                                                                                                                                                                                   4.5
  4.5
  4.0                                                                                                                                                                                                              4.0
  3.5                                                                                                                                                                                                              3.5
  3.0                                                                                                                                                                                                              3.0
  2.5                                                                                                                                                                                                              2.5
                                                        2004

                                                                                                                    2010
         1998

                1999

                       2000

                               2001

                                       2002

                                               2003

                                                                  2005

                                                                                2006

                                                                                          2007

                                                                                                   2008

                                                                                                            2009

                                                                                                                           2011

                                                                                                                                  2012

                                                                                                                                          2013

                                                                                                                                                  2014

                                                                                                                                                           2015

                                                                                                                                                                         2016

                                                                                                                                                                                  2017

                                                                                                                                                                                         2018

                                                                                                                                                                                                                                2008

                                                                                                                                                                                                                                            2009

                                                                                                                                                                                                                                                          2010

                                                                                                                                                                                                                                                                     2011

                                                                                                                                                                                                                                                                                 2012

                                                                                                                                                                                                                                                                                               2013

                                                                                                                                                                                                                                                                                                           2014

                                                                                                                                                                                                                                                                                                                         2015

                                                                                                                                                                                                                                                                                                                                         2016

                                                                                                                                                                                                                                                                                                                                                       2017

                                                                                                                                                                                                                                                                                                                                                                     2018

                                                                                                                                                                                                                                                                                                                                                                                 2019
Note: Top 7 locations according to DZ HYP: Berlin, Munich, Frankfurt, Cologne, Hamburg, Düsseldorf, Stuttgart; Regional 12 according to DZ HYP: Hannover, Nuremberg, Essen, Leipzig, Dresden,
Bremen, Karlsruhe, Münster, Mannheim, Darmstadt, Mainz and Augsburg
Source: DZ HYP German Real Estate Market report – 2019/2020 - BulwienGesa

                                                                                                                                                                                                                                                                                                                                                                                        43
Netherlands office market
…resulting from favorable developments

Current trends show very favorable market developments…

                                                                                                                                                              Asking rents
                                                                                                                                                              2015 –> 2018
                                                                                                                   Vacancy     reduction1) 2)   -580bps                               +9%
                                                                                                                   2015 –> 2018
                                                                              Available Supply       -42%
                                                                              2015 –> 2018
                                        Office take-up
                                        2015 -> 2018            +42%
   Office Employment1)
   2015 -> 2017        +7.5%

…especially in Amsterdam

                                                                                                                                                              Asking rents
                                                                                                                                                              2015 –> 2018           +11%
                                                                                                                   Vacancy reduction3) -850bps
                                                                                                                   2015 –> 2018
                                                                              Available Supply       -68%                                                    Office Prime Yield3) -230bps
                                                                              2015 –> 2018                                                                   2015 –> 2018
                                        Office take-up
                                        2015 -> 2018           +73%
   Office Employment1)                                                        Prime office yield and investment volumes
   2015 -> 2017        +15.2%                                                                                Dutch investors                      Cross-border investors
                                                                                Millions                     Prime yield
                                                                                €5,000                                                                                     83%               8%
                                                                                €4,000                                                                        75%                            6%
                                                                                €3,000                                                 70%         68%
                                                                                                                          88%                                                                4%
                                                                                €2,000               62%        72%                                                                 53%
                                                                                           69%                                                                                               2%
                                                                                €1,000
                                                                                     €0                                                                                                      0%
                                                                                           2010      2011       2012      2013         2014        2015       2016         2017   2018 YTD

Source: Dynamis - Sprekende Cijfers, Kantorenmarkten - 2019
Sources for the missing data:
1 DTZ Zadelhof/Cushman & Wakefield- Nederland Compleet - issues from January 2015-August 2018; 2 Cushman & Wakefield- Netherlands Office Market Snapshot Q4 2018; 3 Colliers, EMEA Office

Market Snapshots – issues from Q4 2016 to H1 2019

                                                                                                                                                                                             44
German hotel market overview
       Continued strong demand growth

           Overnight stays across all hotel
           accommodation types in Germany                                                          RevPar development                                                          Rated hotels by category
           Millions                                                                                (€)                                                                                              5-star 1-star
                               Domestic demand           International demand
           300                                                                                                                                            72      74                       2-star    123     78
                                                                                                                                           70      70
Millions

                                                                                                                                    65                                                      413
                                                                          69    71                                   62    63
           250                                            65      66                                     58    59
                                     56     58    61
                      48      51
           200                                                                                                                                                                   4-star                               3-star
           150                                                                                                                                                                   2,639                                4,830
           100                                            207   214      220    226
                      180   189      195    196   202

            50

              0
                 2010 2011 2012 2013 2014 2015 2016 2017 2018                                         2010 2011 2012 2013 2014            2015     2016   2017   2018
           Source: destatis 45412-0012 – extracted May 2019                                        Source: Smith Travel Research (STR)                                         Source: hotelstars.eu – January 2019

                  Tourism in Germany has been continuously growing over the recent years, driving up main KPIs. According to data from STR this
                                growth is set to continue in 2018, with 2018 occupancy up 0.7%, ADR up 1.8% and RevPAR up 2.4%
       Source: STR – December 2018 data, compared to the same period in 2017

           Continued high investor demand                                                                                       Especially in major German cities
           Hotel investments in Germany H1                                                                                      Hotel investments in Germany H1

           (in €m)                            Single investments                      Portfolios                                (in €m)                                 2018          2019
           2,250                                                                                                                 400
           2,000                                                                                                                 350
           1,750                                                                                                                 300
           1,500                                                                                                                 250
           1,250
                                                                                                                                 200
           1,000
             750                                                                                                                 150
             500                                                                                                                 100
             250                                                                                                                  50
               0                                                                                                                   0
                       2010        2011    2012   2013     2014        2015    2016      2017       2018      2019                        Berlin     Cologne     Düsseldorf    Frankfurt     Hamburg      Munich      Stuttgart

           Source: BNP Paribas – Hotel Investment Market Germany at a Glance Q2 2019                                            Source: BNP Paribas – Hotel Investment Market Germany at a Glance Q2 2019

                                                                                                                                                                                                                            45
UK/London hotel market
Positive developments and forecasts

Continued growth in main KPIs, forecasted to grow further                                                                                                                                                                                           Strong investor appetite for hotel assets
                                                                                                                                                             London
                                                                                                                                                                                                                                                                                               Loans                            Portfolio       Single                               Forecast                                          RevPAR growth (%)
A: Actual F: Forecast                                                                                                                    2018A                2019F                          2020F

                                                                                                                                                                                                                                                                                                                                                                                                                                                                                                       RevPAR growth p.a. (%)
                                                                                                                                                                                                                                                                        10                                                                                                                                                                            12%
Occupancy %                                                                                                                              83.3%                83.3%                          83.3%                                                                                                                                                                                                                                                                                 8%

                                                                                                                                                                                                                                                    Deal volume (£bn)
                                                                                                                                                                                                                                                                         8
ADR (£)                                                                                                                                  £148.8              £150.9                        £152.9
                                                                                                                                                                                                                                                                                                                                                                                                                                                                                   4%
RevPAR (£)                                                                                                                               £124.0              £126.1                        £128.0                                                                        6
                                                                                                                                                                                                                                                                                                                                                                                                                                                                                   0%
% growth on previous year                                                                                                                                                                                                                                                4
Occupancy                                                                                                                                                                                                                                                                                                                                                                                                                                                                          -4%
                                                                                                                                            1.9%               0.3%                                 0.1%
                                                                                                                                                                                                                                                                         2                                                                                                                                                                                                         -8%
ADR                                                                                                                                         1.0%               1.4%                                 1.4%
RevPAR                                                                                                                                      2.9%               1.7%                                 1.4%                                                                 0                                                                                                                                                                                                         -12%
                                                                                                                                                                                                                                                                                      2007 2008 2009 2010 2011 2012 2013 2014 2015 2016 2017 2018 2019 2020
Source: Econometric forecasts; PwC February 2019; Benchmarking data; STR January 2019                                                                                                                                                               Source: PwC UK hotels forecast update for 2019 and 2020 report – STR, RCA, Dealogic,
                                                                                                                                                                                                                                                    Mergermarket, Pwc Analysis

Positive developments in main KPIs across major UK cities from 2017 to 2018
Occupancy in Key UK cities (in %)                                                                                                                            ADR in Key UK cities (in USD)                                                                                                                                             RevPar in Key UK cities (in GBP)
                                                                                                          2017              2018                                                                                                                                         2017                      2018                                                                                                                                           2017                2018
 90                                                                                                                                                          250                                                                                                                                                                        150
 80                                                                                                                                                                                                                                                                                                                                     130
 70                                                                                                                                                          200
 60                                                                                                                                                                                                                                                                                                                                     110
 50                                                                                                                                                          150                                                                                                                                                                         90
 40                                                                                                                                                                                                                                                                                                                                      70
 30                                                                                                                                                          100                                                                                                                                                                         50
 20
 10                                                                                                                                                           50                                                                                                                                                                         30
  0                                                                                                                                                                                                                                                                                                                                      10
                                                                                  Southampton
                           Liverpool
               Edinburgh

                                                                                                                                         Derby*
                                       Cambridge*

                                                              Cardiff
                                                    Glasgow

                                                                                                Oxford*

                                                                                                                       UK
                                                                                                                            Birmingham
      London

                                                                                                          Manchester

                                                                                                                                                  Aberdeen
                                                                        Bristol

                                                                                                                                                               0                                                                                                                                                                        -10

                                                                                                                                                                                                                                                                         Birmingham

                                                                                                                                                                                                                                                                                                                                                                                                                                                                      Birmingham
                                                                                                                                                                                                                                                                                                             Derby
                                                                                                                                                                                                                                              UK*
                                                                                                                                                                                                                                                       Southampton

                                                                                                                                                                                                                                                                                                                                                                                                            Southampton
                                                                                                                                                                                                                                                                                                                                                                                                                          Cambridge*
                                                                                                                                                                                                                                                                                       Liverpool
                                                                                                                                                                                                                                                                                                   Cardiff

                                                                                                                                                                                                                                                                                                                                                       Edinburgh
                                                                                                                                                                                                                                                                                                                                                                   UK

                                                                                                                                                                                                                                                                                                                                                                                      Liverpool

                                                                                                                                                                                                                                                                                                                                                                                                                                                                                   Derby*
                                                                                                                                                                            Cambridge
                                                                                                                                                                                        Edinburgh
                                                                                                                                                                                                    Oxford

                                                                                                                                                                                                                                    Glasgow

                                                                                                                                                                                                                                                                                                                     Aberdeen

                                                                                                                                                                                                                                                                                                                                                                                                  Glasgow

                                                                                                                                                                                                                                                                                                                                                                                                                                                  Oxford*
                                                                                                                                                                                                                                                                                                                                                                                                                                                            Cardiff

                                                                                                                                                                                                                                                                                                                                                                                                                                                                                            Aberdeen
                                                                                                                                                                                                                       Manchester

                                                                                                                                                                                                                                                                                                                                                                        Manchester
                                                                                                                                                                   London

                                                                                                                                                                                                                                                                                                                                              London
                                                                                                                                                                                                             Bristol

                                                                                                                                                                                                                                                                                                                                                                                                                                        Bristol
Source: STR UK Hotel Review - December 2018                                                                                                                  Source: The Advantage Travel Partnership Hotels Quarterly                                                                                                                  Source: STR UK Hotel Review - December 2018
*Missing data is from BDO Hotel Britain Report 2019                                                                                                          Market Report - Jan to Dec 2018, TravelClick, WIN                                                                                                                          *Missing data is from BDO Hotel Britain Report 2019 – Room
                                                                                                                                                             *Missing data is from STR UK Hotel Review - December 2018,                                                                                                                 yield
                                                                                                                                                             converted to USD

                                                                                                                                                                                                                                                                                                                                                                                                                                                                                              46
You can also read