Auto Insurance Regulation What Works 2019 - Consumer ...
←
→
Page content transcription
If your browser does not render page correctly, please read the page content below
Auto Insurance Regulation
              What Works 2019
            How States Could Save Consumers
                    $60 Billion a Year

J Robert Hunter
Director of Insurance

Douglas Heller
Insurance Expert

February 11, 2019

Abstract
Updating decades of research, the Consumer Federation of America reveals what data shows about
the many different approaches to auto insurance market oversight and consumer protection in the
United States and how some states have saved drivers billions, while others have allowed
significantly increased costs for drivers.

1620 Eye Street, NW, Suite 200 | Washington, DC 20006 | (202) 387-6121 | ConsumerFed.org
Table of Contents

I.        Introduction ........................................................................................................................... 4
II.       Analysis of Auto Insurance Results from Every State ...................................................... 5
     A. Overview ............................................................................................................................... 5
     B. Data ....................................................................................................................................... 5
     C. Analysis................................................................................................................................. 6
        1. Auto Insurance Expenditures ......................................................................................... 6
        2. Auto Insurance Liability-Only Expenditures .................................................................. 9
        3. Differences By Regulatory System ............................................................................... 11
           a) Stronger Regulation Yields Better Results for Consumers Over Time....................12
           b) Regulatory Oversight Does Not Inhibit Profitability...............................................14
        4. Competition In The States ............................................................................................ 15
           a) A Formal Measure of Market Concentration..........................................................16
           b) Competition Enhancing Practices among the States...............................................17
III. Findings ............................................................................................................................... 18
     A. Stronger Regulation Leads To Lower Rates For Automobile Insurance Consumers ......... 18
     B. The Effectiveness of Prior Approval Regulation In California and Hawaii Have Saved
        Drivers Billions ................................................................................................................... 20
        1. $154 Billion Saved In California and Other Benefits .................................................. 20
        2. Hawaiian Drivers Have Benefited From a Strong Prior Approval System ................. 23
     C. Americans Have Overpaid For Auto Insurance By $1 Trillion Since 1989. With Better
        Regulation They Could Be Saving $60 Billion Per Year. .................................................. 24
IV. Recommendations and Conclusion ................................................................................... 25
Appendix ...................................................................................................................................... 27
     1.     Average Expenditure and Liability Average Premium (1989, 2015) ................................. 27
     2.     Average Return On Net Worth (1989-2016) ...................................................................... 28
     3.     Herfindahl-Hirschman Index (HHI) By State ..................................................................... 29
     4.     Other Data Reviewed (Table 1) .......................................................................................... 29
     5.     Other Data Reviewed (Table 2) .......................................................................................... 31

Auto Insurance Regulation - What Works 2019 | Consumer Federation of America                                                                     2
Table of Figures Figure 1. Smallest and Largest Percentage Increases in Auto Insurance Expenditure (1989-2015) ......................................................................................................................................................... 7 Figure 2. Percentage Increase of Auto Insurance Expenditures (1989-2015) ................................ 7 Figure 3. Dollar Increase in Auto Insurance Expenditures (1989-2015) ........................................ 8 Figure 4. Smallest and Largest Dollar Increases in Auto Insurance Expenditure (1989-2015) ..... 9 Figure 5. Change in Liability Average Premium (1989-2015) ..................................................... 10 Figure 6. States With More Than 100% Increase in Liability Average Premium (1989-2015) ... 11 Figure 7. Regulatory System by State.......................................................................................... 12 Figure 8. Regulatory Systems of States with Lowest and Highest Rate Changes (1989-2015) .. 13 Figure 9. Auto Insurance Expenditure Change by Regulatory Rating System (1989-2015)........ 13 Figure 10. Auto Insurance Liability Average Premium Change by Regulatory Rating System (1989-2015)................................................................................................................................... 14 Figure 11. Profitability by Regulatory System, Weighted by Market Size ................................. 14 Figure 12. Most and Least Profitable States (Average Annual Profitability) (1989-2016) .......... 15 Figure 13. Least Concentrated Auto Insurance Markets .............................................................. 16 Figure 14. Average HHI by State Regulatory System .................................................................. 17 Figure 16. Percentage Change in Average Insurance Costs (1989-2015) .................................... 21 Figure 17. Auto Insurance Expenditure Increases in Hawaii at Various Intervals Compared With 1989 Expenditures ........................................................................................................................ 23 Figure 18. Theoretical Annual Consumer Savings (In Millions) if State Adopted California-Style Oversight ....................................................................................................................................... 24 Auto Insurance Regulation - What Works 2019 | Consumer Federation of America 3
I.     Introduction
        When Americans shop for auto insurance, as required by law in every state but New
Hampshire, the premiums they find in the market depend upon a combination of insurance losses
and expenses, driving and non-driving related characteristics of the individual driver, and a
variety of management-level decisions reflecting the company’s market objectives. However,
there is also a macro-level influence on auto insurance premiums stemming from the regulatory
framework in place in each state-based market. As insurance products are overseen exclusively
by the states, each state market is different, and those differences can be assessed in terms of
consumer outcomes.

         In this report updating research conducted in 2008 and 2013 to now cover 30 years of
results, Consumer Federation of America (CFA) looks at state consumers’ auto insurance
expenditures and other data in each state to determine what types of rules best serve American
auto insurance policyholders. There are a variety of actuarial reasons why one state might expect
higher auto insurance expenditures than another – including different coverage limits, different
levels of traffic density, different mix of vehicle types – and these reasons are generally
consistent over time. Those statewide characteristics are baked in to the differences in premiums
between states, and we would expect drivers in a state with high traffic density and high
coverage limits to pay more for auto insurance than those in a state with low traffic density and
low coverage requirements. But, as this report illustrates, the trajectory of rates over time in
different states are wildly different, and we have concluded that the level of consumer protection
and regulatory oversight in the states plays an important role in determining that trajectory.

       Since 1989, the average expenditure on auto insurance by Californians has increased by
12.5%, while the average increase across the country has been 61.1%, nearly five times that
faced by California drivers. When it comes to the cost of liability insurance, the state-mandated
portion of coverage, Californians paid 5.7% less in 2015 than they paid in 1989 (without any
adjustment for inflation), while the nationwide average increased by 58.5%.

       In addition to the savings achieved under California’s consumer protection system, it is
notable that the system of strong regulation of insurance companies has fostered a robust and
extremely competitive market, helping California to become the second least concentrated auto
insurance market in the nation.

         The data show, and this is consistent with prior CFA analyses over the past decade, that
strong “prior approval” oversight of auto insurance markets, in which insurance companies have
to justify rate changes before imposing them on policyholders, leads to the best outcomes for
consumers. Over the past 30 years, no set of state rules has been as beneficial to its resident
drivers as the consumer protections put in place by California voters in November 1988 through

Auto Insurance Regulation - What Works 2019 | Consumer Federation of America                    4
Proposition 103. We calculate that California drivers have saved $154 billion in auto insurance
premiums as a result of voters’ decision to adopt the 1988 ballot initiative. Our research
indicates that if every state market in the nation had been strengthened by California-style
consumer protection, American drivers would have saved $60 billion in 2015 and nearly a
trillion dollars over the past 30 years.
In the following pages we first summarize the research and our findings with respect to
the experience in all 50 states and Washington, DC. Thereafter we provide a detailed look into
the experience in California, including why we believe that state has succeeded in protecting
drivers better than any other.
II. Analysis of Auto Insurance Results from Every State
A. Overview
A primary purpose of this report is to assess the effectiveness of the various regulatory
approaches to auto insurance across the country. Through our research we have identified the
best practices that can serve as models for regulators and policymakers seeking to ensure a
competitive and fair market that is first and foremost protective of consumers. In order to
develop our findings, we have looked at data from 1989-2015 (the last year for which complete
data were available when the research was conducted, except where noted)1 and considered a
variety of questions about state markets and the regulatory systems in each state. Among those
questions are:
• How have auto insurance expenditures changed over time?
• How have liability-only expenditures changed over time?
• How have expenditure changes varied under different regulatory systems?
• How competitive is the auto insurance market in each state?
• How profitable has the industry been in each state?
B. Data
The data in this report are public data published by the National Association of Insurance
Commissioners (NAIC) over the past 30 years. Each year the NAIC publishes an “Auto
Insurance Database Report” that is “compiled to make information about cost factors in each
state readily available to insurance regulators monitoring the market, and to the public.”2 These
1
The sources of premium and expenditure data contained in this report, unless otherwise described, are the National
Association of Insurance Commissioners Auto Insurance Database Reports (1990-2015), NAIC Report
on Profitability by Line by State (1999-2016) and Best’s Aggregates and Averages, various editions.
2
NAIC, December 2017. Auto Insurance Database Report 2014/15. p.1.
Auto Insurance Regulation - What Works 2019 | Consumer Federation of America 5reports break out data on premiums, expenditures, and exposures by coverage and, critically for
this study, by state.
This report focuses primarily on the Average Expenditure in each state, which “is the
total written premium for liability, collision, and comprehensive coverages divided by the
liability written car-years (exposures). This assumes that all insured vehicles carry liability
coverage but do not necessarily carry the physical damage coverages (i.e., collision and/or
comprehensive). The average expenditure is an estimate of what consumers in the state spent, on
average, for auto insurance.” [Emphasis added.]
Where we have used other data in the report, we have cited it and described our
calculations. The data in the report are all publicly available and the calculations easily
reproduced.
C. Analysis
1. Auto Insurance Expenditures
Average auto insurance expenditures grew by 61.1% countrywide between 1989 and
2015 (the last year for which data were available during the course of research). The average
annual expenditure countrywide in 1989, in unadjusted dollars, was $552; in 2015 it was $889,
or $337 more spent on auto insurance. Among the states, California drivers faced the smallest
increase, 12.5%, while Nebraskans encountered the sharpest increase, 139.3%, during this
period.
During this time period the average state increase was 75.1% and the median increase
was 71.5%. These average and median increases are significantly higher than the rate of
expenditure growth calculated on a countrywide basis (61.1%) largely because California’s
disproportionate share of the national market (about 1 of every 8 insured vehicles is in the state)
has an outsized impact when quantifying change for the nation as a whole.
Other than California, only Hawaii (+13.6%) experienced a rate increase less than 25%
during the period, while 12 states experienced increases topping 100% since 1989. Figure 1
presents the states with the smallest and largest increases by percentage over the time period, and
Figure 2 provides the increases for all states.
Auto Insurance Regulation - What Works 2019 | Consumer Federation of America 6Figure 1. Smallest and Largest Percentage Increases in Auto Insurance Expenditure
(1989-2015)
Smallest Increases Largest Increases
California 12.5% Nebraska 139.3%
Hawaii 13.6% North Dakota 125.2%
New Hampshire 27.2% South Dakota 125.1%
New Jersey 28.8% Michigan 123.5%
Pennsylvania 35.9% Louisiana 115.4%
Connecticut 41.7% Kentucky 113.5%
Maine 42.1% Wyoming 106.3%
Arizona 45.1% Oklahoma 106.3%
Massachusetts 45.3% Montana 106.1%
District of Columbia 49.4% Kansas 105.0%
Figure 2. Percentage Increase of Auto Insurance Expenditures (1989-2015)
Auto Insurance Regulation - What Works 2019 | Consumer Federation of America 7During the period reviewed, the actual, unadjusted dollar impact of these changes on state
consumers averaged $348, and only Hawaii and California saw increases that were less than
$100 total. Hawaii, which had a lower average expenditure in 1989 than California, counted a
$91 increase during the period, while California experienced a $93 increase. On the other end of
the spectrum, Louisiana and Michigan expenditures rose the most, by $660 and $681,
respectively. Florida, Delaware, and New York also faced steep increases, each with average
expenditures rising by more than $550. Figure 3 illustrates the dollar impact of increasing auto
insurance expenditures over the 27-year period.
Figure 3. Dollar Increase in Auto Insurance Expenditures (1989-2015)
Auto Insurance Regulation - What Works 2019 | Consumer Federation of America 8Figure 4 presents the smallest and largest dollar increases during the time period
reviewed.
Figure 4. Smallest and Largest Dollar Increases in Auto Insurance Expenditure (1989-
2015)
Smallest Increases Largest Increases
Hawaii $91.36 Michigan $680.55
California $93.48 Louisiana $659.81
New Hampshire $165.90 Florida $575.04
Maine $182.89 Delaware $571.62
Idaho $225.52 New York $569.77
Pennsylvania $232.15 Texas $436.87
Indiana $239.95 Kentucky $426.26
Ohio $254.86 Oklahoma $424.32
Vermont $256.75 Rhode Island $422.13
Arizona $262.50 West Virginia $418.16
As is obvious from these tables, and as will be discussed in the analysis section below,
California and Hawaii stand out among the states.
2. Auto Insurance Liability-Only Expenditures
In every state but New Hampshire, drivers are required to purchase a basic liability policy
as a condition for driving. This mandate includes Personal Injury Protection (no-fault) coverage
in some states, while in many states it is limited to third-party liability (injuries and damage to
others), and in some states Uninsured Motorist coverage is also required. In its Auto Insurance
Database Report, NAIC combines these coverages, along with Medical Payments coverage, to
form the data series “Liability Average Premium,” which we assess below.
By excluding the amount spent on comprehensive and collision coverage, Liability
Average Premium offers a closer approximation of the cost of coverage that is required of
drivers. These data, when considered in light of the whole report, help assess how states have
done in protecting lower-income drivers and others who purchase a state’s minimum-limits
policy in order to comply with the state mandate.
Since 1989, the countrywide liability average premium has increased by 58.5%. Only two
states have seen reductions in the premium paid for liability coverage. In California and Hawaii,
premiums for liability insurance dropped by 5.7% and 2.0%, respectively. Figure 5 below shows
the change in liability average premium, ranked from smallest to largest change.
Auto Insurance Regulation - What Works 2019 | Consumer Federation of America 9Figure 5. Change in Liability Average Premium (1989-2015)
While it costs drivers in California and Hawaii less to buy liability coverage in 2015 than
it did three decades ago, eleven states faced premiums that had doubled or, in the case of
Michigan, tripled between 1989 and 2015, as shown in Figure 6. For lower-income drivers who
do not lease or make payments on their vehicle (and, thereby, may forego comprehensive and
collision coverages), these significant price hikes on a product they are required to purchase has
led to considerable discussion among policymakers, regulators, and consumer advocates about
the affordability of state mandated auto insurance policies.
Auto Insurance Regulation - What Works 2019 | Consumer Federation of America 10Figure 6. States with More Than 100% Increase in Liability Average Premium (1989-
2015)
State Increase
Michigan 215.9%
Nebraska 144.1%
Kentucky 141.0%
Utah 128.3%
South Dakota 113.3%
Oklahoma 111.4%
Delaware 111.1%
Wyoming 110.0%
New York 107.7%
Louisiana 106.8%
Florida 103.9%
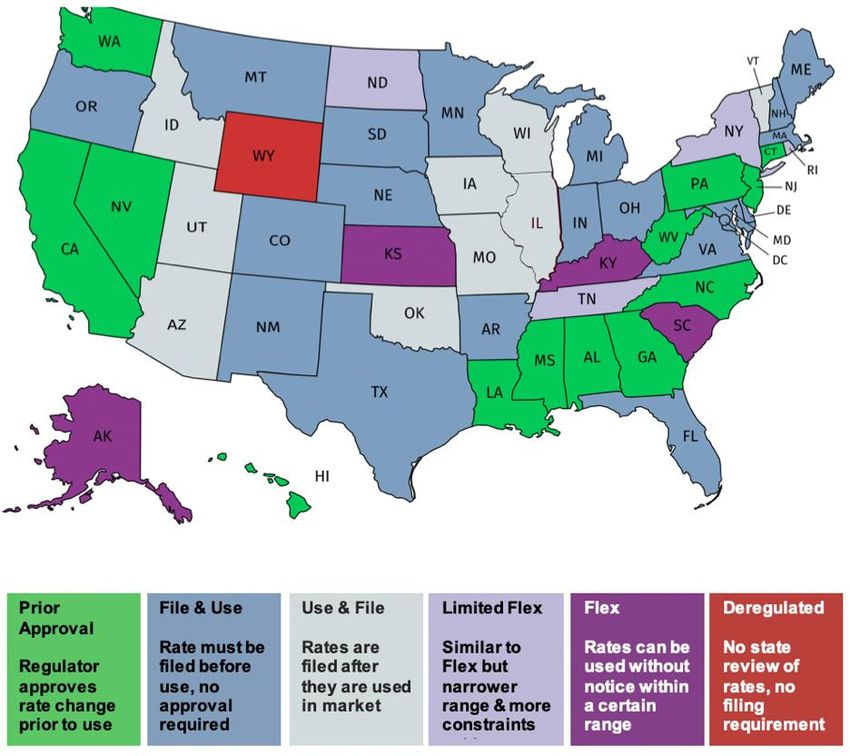
3. Differences by Regulatory System
In the United States, auto insurance is regulated at the state level. Each state has its own
unique set of laws and no two states' insurance regulation regimes are precisely the
same. However, the states can be grouped, generally, among six different regulatory structures,
ranging from the more vigorous “prior approval” approach to rates in California to the virtual
deregulation of rates in Wyoming. The six structures, as illustrated in Figure 7, are:
• Prior Approval
• File and Use
• Use and File
• Limited Flex
• Flex
• Deregulated
For this report, we have generally followed the National Association of Insurance
Commissioners (NAIC) report on state rate filing laws3 except as follows:
a) We have added a category – Limited Flex – that reflects four states’ laws that allow
insurers to make (largely) unregulated changes to rates in certain instances, but under
constraints that are more limiting than the states identified by the NAIC as Flex
Rating states. The eight states that are identified as Flex or Limited Flex might
reasonably be treated as Flex Rating systems, but we have decided to distinguish
between those named as Flex by NAIC and those identified otherwise but having a
significant Flex component.
3
NAIC, December 2017. Auto Insurance Database Report 2014/15. p.234 .
Auto Insurance Regulation - What Works 2019 | Consumer Federation of America 11b) NAIC lists Florida as a Prior Approval state with the following caveat: “Companies
may Use and File at the risk of having to refund any excessive charge. Actual text of
the Law says ‘File and Use.’” Because companies are not required to seek prior
approval, we treat it as a File and Use state per the text of state law.
Countrywide, there are 13 prior approval states, 20 file and use states, nine use and file
states, eight flex- or limited flex-rating states, and one deregulated state.
Figure 7. Regulatory System by State
a) Stronger Regulation Yields Better Results for Consumers Over Time
Auto Insurance Regulation - What Works 2019 | Consumer Federation of America 12Our findings show that states with stronger regulatory systems - that is, states that require
prior approval of rates before they can take effect - have had the most success in slowing the rate
of increases over time. Figure 8 shows the regulatory system of the five states with the smallest
auto insurance expenditure changes and the five states with the largest increases.
Figure 8. Regulatory Systems of States with Lowest and Highest Rate Changes (1989-
2015)
Lowest Rate Changes Highest Rate Changes
Regulatory Regulatory
State Change State Change
Structure Structure
California Prior Approval 12.5% Nebraska File and Use 139.3%
Hawaii Prior Approval 13.6% North Dakota Limited Flex 125.2%
New Hampshire File and Use 27.2% South Dakota File and Use 125.1%
New Jersey Prior Approval 28.8% Michigan File and Use 123.5%
Pennsylvania Prior Approval 35.9% Louisiana Prior Approval 115.4%
Although each state’s application of their regulatory system is different – particularly
among the group of prior approval states – the data show that prior approval states taken as a
group provide significantly better results for consumers than other regulatory approaches. This
is the case whether we evaluate the systems using a simple or weighted average, as is detailed in
Figure 9. The simple average demonstrates the systemic pull of the regulatory approach rather
than the particular rate trajectory of a single large state like California or Texas. The weighted
average allows us to adjust our assessment of the rating system’s efficacy to account for some
small state outliers on either end of the data set, such as Hawaii and the Dakotas.
Figure 9. Auto Insurance Expenditure Change by Regulatory Rating System (1989-2015)
Rating System Percent Change
Simple Average Weighted Average
Prior Approval 63.2% 45.0%
Use and File 74.7% 70.0%
File and Use 78.5% 82.3%
Limited Flex 85.8% 82.9%
Flex Rating 86.7% 91.7%
Deregulation 106.3% 106.3%
It is not surprising that Prior Approval states, in which insurance companies are subject to
up-front scrutiny of their rate hikes, have yielded the best results for consumers over time.
Similarly, it is not surprising that the deregulation approach in Wyoming and the partial
deregulation of the flex states have offered the least protection. In those states, insurers have the
ability (in varying degrees) to raise rates without any scrutiny whatsoever. Clearly, they have
taken advantage of that. The fact that the use and file states have seen more constrained premium
Auto Insurance Regulation - What Works 2019 | Consumer Federation of America 13increases than file and use states suggests that it is not the timing of the paperwork, but scrutiny
by the regulator that makes a difference. In both cases the likelihood of regulatory review and
rejection of rate increases is low but not quite as low as the statutory lack of accountability given
insurers in the flex-rating and deregulated states.
Similar, though more pronounced, results are apparent when assessing the change in
liability premiums among the different regulatory systems. As Figure 10 illustrates, drivers in
prior approval states faced the least severe premium increases on the coverages that are required
by state law. Less regulated systems provided significantly less protection from rate increases for
the mandatory coverage during this period.
Figure 10. Auto Insurance Liability Average Premium Change by Regulatory Rating
System (1989-2015)
Weighted
Rating System
Average Change
Prior Approval 36.1%
Use and File 67.9%
File and Use 89.5%
Flex Rating 98.5%
Limited Flex 103.0%
Deregulation 110.05%
b) Regulatory Oversight Does Not Inhibit Profitability
We considered the question of whether the regulatory system in a state tends to support
more or less profitability for the industry. Presumably, insurers would prefer a system that
supports higher profits. As Figure 11 indicates, however, profits are relatively unaffected by
regulatory systems, except that Flex Rating systems seem to trend toward lower profitability.
Figure 11. Profitability by Regulatory System, Weighted by Market Size
Regulatory Total Premium Average Annual
System (in billions) Profitability
Prior Approval $72.8 7.99%
File and Use $85.4 7.24%
Use and File $24.5 8.87%
Limited Flex $17.4 8.33%
Flex $8.3 4.79%
Deregulated $0.4 9.60%
Total $209.0 7.69%
Auto Insurance Regulation - What Works 2019 | Consumer Federation of America 14Perhaps most notable is the clear evidence that the stronger regulatory oversight
associated with Prior Approval systems does not inhibit insurer profitability as some opponents
of regulation might suggest. Figure 12 illustrates the five most profitable states since 1989 and
the five least profitable states. This, along with the full list of states, reveals that, for this period,
those with prior approval systems are distributed throughout the profitability range, with Hawaii
as the most profitable, and Nevada and Louisiana as the least profitable. Another prior approval
state, Alabama, had an 8.4% average annual profit, the median figure for the dataset. See
Appendix 1-D.
Figure 12. Most and Least Profitable States (Average Annual Profitability) (1989-2016)
Most Profitable Least Profitable
Regulatory Regulatory
State Profitability State Profitability
Structure Structure
Hawaii Prior Approval 16.6% Louisiana Prior Approval 2.6%
Maine File and Use 13.0% Nevada Prior Approval 3.1%
District of File and Use 12.8% South
Flex 3.1%
Columbia Carolina
New Hampshire File and Use 12.5% Michigan File and Use 3.5%
Vermont Use and File 12.1% Kentucky Flex 4.5%
It is common to assume that regulation limits profitability, but that is a
mischaracterization of both the public policy goal underlying regulation and, as shown in this
data, not borne out by the facts. The public policy orientation of insurance regulation, and price
regulation generally, is to eliminate excessive profits from overcharging customers and to
prevent insolvency from underpricing the product. There is no reason to believe that a rigorous
prior approval system, when built on that public policy rationale, should make it more unlikely
for a law-abiding insurer to earn a reasonable profit. Indeed, virtually every state requires
insurers to price insurance within the parameters of the inadequate–excessive construct, so prior
approval of rates is a law enforcement tool, not an additional standard. That prior approval states
do not clump together in one area of the profitability range affirms this point and should be
recognized as a key finding that dispels some of the anti-regulation rhetoric that is used to
challenge prior approval systems.
4. Competition in the States
In many markets, competition can be a force for lower prices. In the auto insurance
market, where prices are meant to hew closely to the risk of loss, competition can help improve
efficiency, incentivize safety and loss mitigation efforts, and improve service quality. But,
because the insurance market is different than most markets, special attention is needed to foster
competition.
Auto Insurance Regulation - What Works 2019 | Consumer Federation of America 15Unlike most products and services sold in the American marketplace, auto insurance is a
government-mandated purchase for motorists in all states, save New Hampshire. This removes
the demand-side power of consumers to say “no” to the market as a whole if it is overpriced or
non-competitive. Additionally, insurance is a complex financial instrument that, for most people,
is purchased but rarely used, and studies show that consumers do not shop for coverage
frequently. Finally, the insurance industry has a rare exemption from federal antitrust laws, and
around the country, where state authority over collusive behavior exists, it is rarely enforced. The
interaction of these unique qualities makes the role and relevance of a competitive marketplace a
complicated concern.
We consider two indicators of competitiveness, a standard measure and an analysis of
state policy regarding market participation.
a) A Formal Measure of Market Concentration
To identify the level of competition in the auto insurance market, we used the test
commonly employed by the United States Department of Justice (DOJ) to measure market
concentration, the Herfindahl-Hirschman Index (HHI).4 The closer a market is to being a
monopoly, the higher the HHI index. The DOJ considers a market with a score of less than
1,000 to be a competitive marketplace, a score of 1,000-1,800 to be a moderately concentrated
marketplace and 1,800 or greater to indicate a highly concentrated marketplace. Figure 13
provides the list of the ten states with the lowest HHI.
Figure 13. Least Concentrated Auto Insurance Markets
State HHI
Maine 703
California 723
North Dakota 741
Vermont 760
Connecticut 770
New Hampshire 786
Utah 786
South Dakota 819
Idaho 822
Washington 825
4
The HHI is calculated by squaring the market share of each firm competing in a market and totaling the resulting
figures.
Auto Insurance Regulation - What Works 2019 | Consumer Federation of America 16As Figure 14 illustrates, when market concentration is reviewed in the context of state
regulatory systems, we find that the deregulated and flex-rating states have higher levels of
market concentration. Measured on a premium volume-weighted basis, prior approval states are
the most competitive but using a simple average the use and file states are more
competitive. Taken together, the data show that the nexus between regulatory oversight and the
robustness of the auto insurance market does not support a conclusion that regulation limits
competition and deregulation encourages it. Just the opposite appears to be the case, with states
that allow greater amounts of unregulated activity in the auto insurance market finding their
markets most likely to be dominated by a small number of insurers.
Figure 14. Average HHI by State Regulatory System
b) Competition Enhancing Practices among the States
Given the unique market power held by insurance companies vis à vis consumers – who
have to purchase their product – states can play an important role in ensuring that motorists can
access a competitive market for auto insurance. Below we describe several competition
enhancing rules and practices we found amongst the states:
1. Take All Good Drivers. Four states – California, Massachusetts, New Hampshire,
and North Carolina – require insurers to take all good drivers who apply for
insurance. In these states, a good driving record gives a consumer the right to obtain
insurance from any licensed insurance company. This is a pro-competitive
requirement, since all states but New Hampshire require that consumers purchase
Auto Insurance Regulation - What Works 2019 | Consumer Federation of America 17auto insurance as a condition of driving their own car. Because of these mandatory
insurance laws, auto insurance demand is inelastic. A mandate on insurers requiring
that coverage be made available to good drivers balances this supply-demand
situation.
2. Prohibit Shifting Good Drivers to Non-Preferred, Higher Rate Subsidiaries.
California is also the only state to require that an insurer group place good drivers
into the lowest priced policy available from any of its affiliated companies when an
insurance applicant asks for a quote. This blocks insurance companies from shifting
drivers with good records into the expensive insurance policies written by an insurer’s
non-preferred subsidiary, which has been one of several techniques that insurers use
to avoid selling policies to good drivers who do not fit into a company’s target
demographic.
3. Enact and Enforce Antitrust Laws. The insurance industry has historically engaged
in extensive price fixing, relying in many instances on shared pricing tools developed
by industry-controlled rating and advisory organizations. Collusive data sharing tends
to result in inflated prices and unfair rating practices, which antitrust enforcement
would tend to diminish. However, all states, except Illinois and California, which
have exercised some antitrust authority, continue to authorize insurers to engage in
conduct that application of antitrust laws would otherwise prohibit.
III. Findings
A. Stronger Regulation Leads to Lower Rates for Automobile Insurance
Consumers
In order to assess the efficacy of the regulatory regimes in place around the country, we
evaluated four significant factors in each state and for each of the six regulatory systems in use
across the nation. By evaluating data related to changes in consumers’ cost of insurance,
profitability of companies, and overall competitiveness of the state insurance markets, we are
able to draw conclusions about the various state markets and the systems that govern them.
The first two tests examined the ability of a state and rating system to hold down rate
increases. The first of these tests considered the change in Average Expenditures over time – that
is how much more or less people pay for all their auto insurance coverage – and the second test
examined how much more or less people pay for the portion of auto insurance – liability
coverage – that is typically required under state laws. It is very clear in the results that lower
price increases were associated with more stringent regulatory regimes, while less oversight led
to higher price increases over time. This fact is brought into stark relief when reviewing the
Auto Insurance Regulation - What Works 2019 | Consumer Federation of America 18liability premiums only, where the nation’s most rigorous regulatory system – in California –
saw premiums that are lower than they were in 1989, even as the nation’s premiums rose by
nearly 60 percent. In both tests of rates, Prior Approval states taken together saw the smallest
increases and while the more weakly overseen flex and deregulated states allowed for the largest
rate increase during the nearly three decades reviewed.
Next, we examined insurer profitability as a function of regulatory system. Although
premium increases were significantly below average in prior approval states, profits were not.
The experience of insurers across the country suggests that the role of consumer protection rules
was to improve efficiency rather than draw down company profits. Prior approval regulation, it
appears, serves as a stabilizing force that allows companies to succeed even as it protects
consumers from excessive pricing. At the very least, the profitability results demonstrate that
prior approval oversight of insurance companies cannot be seen as an inhibitor of insurance
company success. Further, it is evident that in all cases and under any regulatory system, insurers
have generally thrived over the decades, enjoying reasonable profitability in virtually every state.
Finally, we tested the competitiveness of markets under each system of regulation and
found that prior approval regulation yielded, on a weighted average, the most competitive
insurance markets. The less regulated states, including the various flex systems and deregulated
Wyoming, exhibited much weaker levels of competition. There is some irony that deregulated
insurance markets are sometimes described as “Competitive States,” when, in fact, weak
regulation more closely correlates with highly concentrated markets than with competition.
Overall, the Prior Approval system of regulation works best for consumers. This system
is superior at holding prices down while allowing reasonable insurer profits and maintaining a
competitive market. It is also clear that the worst regulatory regimes for consumers are the
Deregulated and Flexible Rating systems, which do not hold down prices, foster less competitive
markets and often allow higher than average profits to insurers.
We also analyzed data on several other key factors that could affect insurance rates,
including seatbelt laws, bad faith claims settlement laws, uninsured motorist population, size of
the residual market, the legal regime in use for auto claims, thefts, traffic density, disposable
income, repair costs and other factors, as shown in the appendices. These data do not appear to
be confounding variables and instead help us affirm the first general finding that Prior Approval
regulation is the best system for consumers. Additionally, as discussed below, the data shed light
on the second significant finding of this analysis, that California’s active prior approval system
has consistently proven itself the strongest in the nation in ensuring access to reasonably priced
auto insurance rates.
Auto Insurance Regulation - What Works 2019 | Consumer Federation of America 19B. The Effectiveness of Prior Approval Regulation in California and
Hawaii Have Saved Drivers Billions
The degree to which California and, in recent years, Hawaii have set themselves apart
from the rest of the country is astounding and reflects the efficacy of prior approval regulation in
conjunction with a strong consumer orientation in its implementation. The data reviewed in this
study begin in 1989, immediately after California voters enacted Proposition 103, which
converted California from a deregulated state to a strongly regulated state incorporating several
consumer protection rules, and marked the beginning of the transformation from one of the most
expensive places in America to insure a vehicle to a state in which premiums are below the
national average.
1. $154 Billion Saved in California and Other Benefits
By comparing California premiums in 2015, after 27 years of Prop 103, to what they
would have been if, instead, these premiums simply followed the national average growth, CFA
calculates that Californians have saved $154 billion on their auto insurance premiums, or an
average savings of nearly $6 billion each year. Put differently, using an estimate of 22 million
insured vehicles in California, there is an annual $275 Prop 103 auto insurance savings for every
insured car on the road.
In order to reach this figure, we calculated the change in auto insurance expenditures
between 1989 and 2015 for the country as a whole and for California only. We then calculated
the savings California enjoyed compared to the savings if California had prices change at the
national averages, a conservative choice since prior to the passage of Proposition 103, the price
increases in California greatly exceeded the national price changes. Because the countrywide
data include California data, this trajectory is also conservative in that the national price changes
were restrained by the savings actually experienced in California.
A review of California’s auto insurance consumer protections illustrates that the savings
California drivers have accrued over the years are not the only benefit of having the nation’s
strongest auto insurance protections in the nation. California passed virtually every test for good
performance, with the exception of a high-uninsured motorist population (which we expect is
changing as discussed below) and profit levels for insurers that are higher than necessary. We
found the following results for California:
Auto Insurance Regulation - What Works 2019 | Consumer Federation of America 20• Ranked first among all states Figure 16. Percentage Change in Average Insurance Costs
in holding down overall rate 1989-2015
increase;
• Ranked first among all
states in holding down the
cost of mandatory liability
coverage;
• Ranked second in market
competitiveness as
measured by the HHI;
• Has totally repealed its
antitrust exemption for
automobile insurers;
• Has a low residual market
population (i.e., low level
of participation in higher
cost assigned risk plans);
• One of only four states to guarantee insurance to a good driver from any insurer the driver
chooses;
• The only state to require that a person’s driving record be the most important factor in
determining insurance rates;
• One of only three states to ban the use of credit scoring;
• The only state that funds consumer participation in the ratemaking process when consumers
or consumer organizations make a substantial contribution to the process;
• The state with the most regulatory transparency, with all rate and rule filing data and
information supplied by insurance companies made available to the public;
• The only state that bars insurance companies from considering whether a motorist was
previously insured, or had a gap in coverage (such as a short drop of insurance during a time
with no car) when pricing applicants for auto insurance; and
• One of only two states (along with New Jersey) with a special low-cost auto insurance policy
for low-income drivers.
• The only state with a suite of ratemaking innovations to keep rates down including the
removal from rates of the cost of fines and bad faith judgments the insurer received for bad
behavior, removal of political contributions and lobbying expenditures, limits on the amount
of executive compensation that can be included in the rates, and exclusion of certain types of
advertising costs from rates.
On the negative side, California has the twelfth highest uninsured motorist population in
the nation according to the industry organization, the Insurance Research Council (IRC). While
still too high, the population has decreased sharply from the 1980s when California had one of
Auto Insurance Regulation - What Works 2019 | Consumer Federation of America 21the highest rates of uninsured motorists. As of 2015, California has an uninsured motorist rate of
15 percent, according to the IRC study, compared to a 13 percent rate nationally. 5 California’s
unique situation as home to the most undocumented residents in the nation may explain some of
the uninsured population. However, we expect that estimates of uninsured motorists in California
will be lower in coming years when the data catch up to the growing population of
undocumented immigrants who have obtained driver’s licenses under a law that took effect in
2015, making it easier for those drivers to purchase insurance. According to the California
Department of Motor Vehicles, as of April 2018 more than one million licenses have been issued
to previously undocumented immigrants since 2015,6 which is also the last year for which
uninsured motorist estimates are available. Indeed, researchers at Stanford University found that
hit and run accidents decreased by 7 - 10% after undocumented drivers were allowed to get a
driver’s license even though overall accident rates did not change, strongly suggesting a
significant increase in insured drivers.7 If the implication of this finding bears out, California’s
uninsured motorist population might already be significantly lower than the national average.
A second area where California’s results are on the wrong side of the national average is
in auto insurance company profitability. While effective regulation will allow for reasonable
profits, insurers in California have enjoyed an average annual Return on Net Worth of 10.5
percent compared with an 8.5 percent annual average nationally. This raises the question as to
whether insurers should be required to further reduce their rates in California. The fact that
California has seen both below average rate changes and above average profits also suggests that
the nation’s less well-regulated markets are much less efficient than they could be, which, as
discussed below, is likely costing consumers around the country billions of dollars annually.
A third area in which California could improve the auto insurance market for consumers
has to do with a loophole that insurers have exploited in recent years at the expense of California
drivers. Under California’s auto insurance rules, consumers are allowed to buy auto insurance,
usually at discounted rates, as part of a group plan. Historically, this has provided benefits to
members of groups such as teacher organizations and senior citizen associations. Over the last
several years, however, insurers have expanded the use of this group insurance provision to
group drivers by occupation – irrespective of their membership in any particular association –
and differentiate premiums based on drivers’ job titles. This “group pricing” has unfairly harmed
people with lower wage occupations as well as the unemployed in California. Consumer
advocates have sought clarifications of the rules to prohibit this expansive and discriminatory
interpretation of state law, but consideration of this problem has languished under the
administrations of the prior two Insurance Commissioners.
5
Uninsured Motorists, 2017 Edition, Insurance Research Council.
6
https://www.dmv.ca.gov/portal/dmv/detail/pubs/newsrel/2018/2018_30
7
Lueders, H., Hainmueller, J., & Lawrence, D. (2017). Providing driver’s licenses to unauthorized immigrants in
California improves traffic safety. Proceedings of the National Academy of Sciences, 201618991.
Auto Insurance Regulation - What Works 2019 | Consumer Federation of America 22These few weaknesses do not, however, alter the very clear finding of our research that
California’s strong prior approval system of auto insurance regulation has been the best in the
nation for consumers. In prior studies, CFA has provided significant detail about the laws and
regulations that have guided California to such extraordinary success.
A complete review of the history and structure of California’s auto insurance regulatory
system is available in Part 2 of CFA’s 2013 “What Works” report on auto insurance, which is
available at https://consumerfed.org/pdfs/whatworks-report_nov2013_hunter-feltner-heller.pdf.
2. Hawaiian Drivers Have Benefited From a Strong Prior Approval System
While California has consistently stood out from the rest of the nation in CFA’s rate
change analyses over the past 20 years, Hawaii has produced significant savings for consumers
relative to the nation in recent years. Since 2010, Hawaii has seen average auto insurance
expenditures decline, joined only by Alaska as states to see costs drop during the post-financial
crisis period, when higher premiums were predicted as high rates of joblessness began their
return toward historical norms. Though not as strikingly as in the past few years, as Figure 17
shows, Hawaiian auto insurance premiums have grown much less than the national average for a
long time.
Figure 17. Auto Insurance Expenditure Increases in Hawaii at Various Intervals
Compared With 1989 Expenditures
1989-1998 1989-2005 1989-2010 1989-2015
Percentage
18.4% 25.2% 13.7% 13.6%
Change
Rank 8th 3rd 2nd 2nd
Least Change -4.0% 12.9% -0.3% 12.5%
During Interval (California) (California) (California) (California)
Hawaii, which uses a prior approval system, has overseen its auto insurance market with
a consumer protection orientation for many years. We believe that the consistent implementation
of the state’s rate regulation rules has contributed to this success. We will further investigate
Hawaii’s effective consumer protection in future research.
Auto Insurance Regulation - What Works 2019 | Consumer Federation of America 23C. Americans Have Overpaid for Auto Insurance by $1 Trillion Since
1989. With Better Regulation They Could be Saving $60 Billion per
Year.
In this report we calculate the amount of money that Californians have saved since 1989
when voters imposed a prior approval regulation system on its auto insurance market. To do that,
we calculate how much more drivers would pay for coverage had California voters not veered
off the highway to high prices that California and the nation was on. If California premiums
simply followed the rate increases endured by the country as a whole since 1989, that would
have cost Californians $154 billion more. But what if we invert that calculation and imagine how
much would be saved by drivers if all other states had also adopted the California approach back
in 1989?
As Figure 18 shows, we calculate that in 2015 premiums across the country would have
been $59.8 billion lower had other states employed a regulatory system that provides results that
followed California’s consumer protection trajectory.
Figure 18. Theoretical Annual Consumer Savings (in Millions) if State Adopted
California-Style Oversight
States Savings State Savings State Savings
Alabama $909 Kentucky $1,230 North Dakota $200
Alaska $139 Louisiana $1,768 Ohio $1,670
Arizona $876 Maine $125 Oklahoma $1,091
Arkansas $753 Maryland $1,198 Oregon $880
California N/A Massachusetts $1,038 Pennsylvania $1,326
Colorado $1,134 Michigan $3,973 Rhode Island $231
Connecticut $536 Minnesota $1,096 South Carolina $1,115
Delaware $349 Mississippi $641 South Dakota $250
Dist. Of Columbia $74 Missouri $1,157 Tennessee $1,241
Florida $6,437 Montana $272 Texas $6,856
Georgia $2,235 Nebraska $583 Utah $670
Hawaii $7 Nevada $628 Vermont $90
Idaho $254 New Hampshire $92 Virginia $1,651
Illinois $1,901 New Jersey $886 Washington $1,617
Indiana $897 New Mexico $414 West Virginia $510
Iowa $613 New York $4,651 Wisconsin $907
Kansas $722 North Carolina $1,755 Wyoming $182
Auto Insurance Regulation - What Works 2019 | Consumer Federation of America 24When we extend that hypothetical further and capture the total savings that would have
accrued over the 27-year period since 1989, we reach a total of $940 billion in savings across the
country. Put differently, American drivers have overpaid for auto insurance for the past three
decades to the tune of nearly one trillion dollars simply because their state has not been
regulating in a strong and effective manner.
IV. Recommendations and Conclusion
Americans spend nearly two hundred billion dollars on auto insurance each year, a
significant portion of which is spent on liability coverage that state laws require drivers to
purchase. Given the size of this market, and the unique circumstances stemming from the
government mandate to buy insurance, policymakers and regulators should carefully and
regularly assess the efficacy of the laws and regulations that govern auto insurance.
In this report, as we have in prior reports, we track the changes in auto insurance rates,
competitiveness, and profits in each state in order to evaluate approaches to regulation and
identify best practices. The data show that states requiring insurance companies to receive
approval for rate changes prior to implementing them get better results for consumers – a slower
pace of increases – than states with looser rules regarding hiking rates on customers. Further,
prior approval states rank, on average, as generally more competitive than states operating under
less regulatory scrutiny. Insurance company profits in prior approval states are marginally higher
than the national average, which makes it difficult for insurers to argue that regulation is bad for
business.
In particular, California’s robust consumer protection rules, which are built on a rigorous
prior approval system, has consistently yielded the best results for consumers. Complementing
California’s prior approval rate structure are a series of laws and regulations that incentivize safe
driving and reduce discrimination. We note, as well, that California’s Department of Insurance
has generally taken a pro-active approach to its responsibilities under the law, which sets
California apart from many other states, including many with prior approval systems but less
consumer-friendly results.
As policymakers and regulators look for ways to ensure the most protection for their own
constituents, the California experience offers significant support for adopting a strong consumer
protection approach to the insurance market. This approach includes,
• a prior approval approach to rate setting;
• incentivizing safe driving and loss reduction by requiring that customer premiums rely
primarily on driving-related factors such as driving record and miles driven annually;
• preventing the pass through to consumers of inefficient company costs, such as bloated
executive salaries, fines and penalties, and lobbying expenses;
Auto Insurance Regulation - What Works 2019 | Consumer Federation of America 25• support for consumer involvement in the rate setting process; and
• full transparency in the ratemaking process.
As states around the country have long-maintained the policy of mandating the purchase
of auto insurance, it is incumbent upon states to adopt best practices to ensure that coverage is
priced in a fair and reasonable manner. This and prior research confirm that the question of how
to best keep auto insurance rates down has been answered, and it is up to policymakers and
regulators to implement these lessons.
Auto Insurance Regulation - What Works 2019 | Consumer Federation of America 26APPENDIX
1. Average Expenditure and Liability Average Premium (1989, 2015)
Liability Average
Average Expenditure
State Premium
1989 2015 1989 2015
Alabama $426.30 $722.89 $203.37 $394.21
Alaska $560.27 $872.39 $330.64 $539.68
Arizona $581.42 $843.92 $393.06 $508.76
Arkansas $364.68 $736.43 $203.53 $394.13
California $747.97 $841.45 $519.39 $489.86
Colorado $515.31 $857.44 $317.43 $520.04
Connecticut $740.02 $1,048.56 $473.31 $650.94
Delaware $574.04 $1,145.66 $378.71 $799.30
Dist. Of Columbia $796.72 $1,190.39 $465.93 $626.82
Florida $610.21 $1,185.25 $420.61 $857.64
Georgia $531.01 $896.50 $324.93 $557.38
Hawaii $673.36 $764.72 $467.87 $458.54
Idaho $348.31 $573.83 $203.02 $344.29
Illinois $505.32 $803.64 $272.18 $446.72
Indiana $426.29 $666.24 $236.17 $382.68
Iowa $315.02 $599.03 $167.39 $229.18
Kansas $340.76 $698.45 $179.90 $358.24
Kentucky $375.71 $801.97 $219.63 $529.21
Louisiana $571.96 $1,231.77 $375.19 $775.83
Maine $434.84 $617.73 $237.00 $338.87
Maryland $646.18 $1,016.81 $429.18 $609.74
Massachusetts $728.39 $1,058.50 $426.77 $606.04
Michigan $550.84 $1,231.39 $251.73 $795.32
Minnesota $460.41 $787.74 $294.95 $456.82
Mississippi $440.80 $827.31 $237.92 $460.50
Missouri $430.05 $745.04 $233.33 $415.88
Montana $336.04 $692.50 $198.36 $386.29
Nebraska $284.86 $681.54 $148.96 $363.63
Nevada $586.60 $985.39 $393.56 $681.56
New Hampshire $609.13 $775.03 $320.65 $400.56
New Jersey $982.93 $1,265.69 $649.73 $869.57
New Mexico $443.76 $762.56 $266.51 $488.03
New York $665.07 $1,234.84 $387.42 $804.51
Auto Insurance Regulation - What Works 2019 | Consumer Federation of America 27North Carolina $388.00 $665.37 $248.85 $359.42
North Dakota $283.11 $637.54 $150.45 $298.18
Ohio $447.73 $702.59 $255.37 $397.11
Oklahoma $399.19 $823.51 $218.04 $461.01
Oregon $466.29 $828.03 $295.33 $584.13
Pennsylvania $646.03 $878.18 $438.89 $499.06
Rhode Island $725.82 $1,147.95 $407.83 $759.80
South Carolina $494.25 $853.53 $311.49 $527.09
South Dakota $273.51 $615.78 $140.77 $300.22
Tennessee $423.26 $737.59 $215.93 $413.91
Texas $497.35 $934.22 $292.92 $528.53
Utah $385.44 $784.10 $217.89 $497.53
Vermont $423.43 $680.18 $212.99 $343.12
Virginia $437.87 $750.85 $276.57 $425.61
Washington $490.50 $884.24 $316.86 $596.67
West Virginia $437.09 $855.25 $253.49 $491.83
Wisconsin $392.46 $664.81 $225.83 $374.37
Wyoming $318.28 $656.64 $152.84 $321.04
Countrywide $551.95 $889.01 $339.82 $538.73
2. Average Return on Net Worth (1989-2016)
State RONW State RONW State RONW
Alabama 8.39% Kentucky 4.52% North Dakota 9.21%
Alaska 9.80% Louisiana 2.63% Ohio 10.83%
Arizona 8.86% Maine 13.04% Oklahoma 6.24%
Arkansas 6.25% Maryland 9.61% Oregon 10.83%
California 10.46% Massachusetts 7.50% Pennsylvania 7.89%
Colorado 6.29% Michigan 3.45% Rhode Island 10.44%
Connecticut 10.86% Minnesota 9.88% South Carolina 3.11%
Delaware 6.29% Mississippi 5.06% South Dakota 6.67%
Dist. Of Columbia 12.79% Missouri 8.04% Tennessee 7.46%
Florida 5.47% Montana 6.82% Texas 6.26%
Georgia 5.25% Nebraska 7.10% Utah 10.11%
Hawaii 16.63% Nevada 3.09% Vermont 12.13%
Idaho 11.74% New Hampshire 12.54% Virginia 10.11%
Illinois 8.97% New Jersey 6.71% Washington 7.98%
Indiana 8.93% New Mexico 9.80% West Virginia 6.75%
Iowa 9.62% New York 8.40% Wisconsin 9.48%
Kansas 7.42% North Carolina 6.46% Wyoming 9.58%
Auto Insurance Regulation - What Works 2019 | Consumer Federation of America 28You can also read