(DHDP) District Human Development Plan
←
→
Page content transcription
If your browser does not render page correctly, please read the page content below
District Human Development Plan
                   (DHDP)
 [Moving from DHDR to DHDP]
                Porbandar
                  (2016-17)

         District Planning Office
                Porbandar

  Gujarat Social Infrastructure Development Society
  (GSIDS),General Administration Department (Planning),
  Government of Gujarat.
  Gandhinagar.

                         1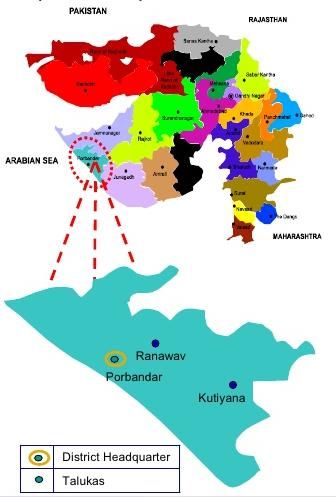
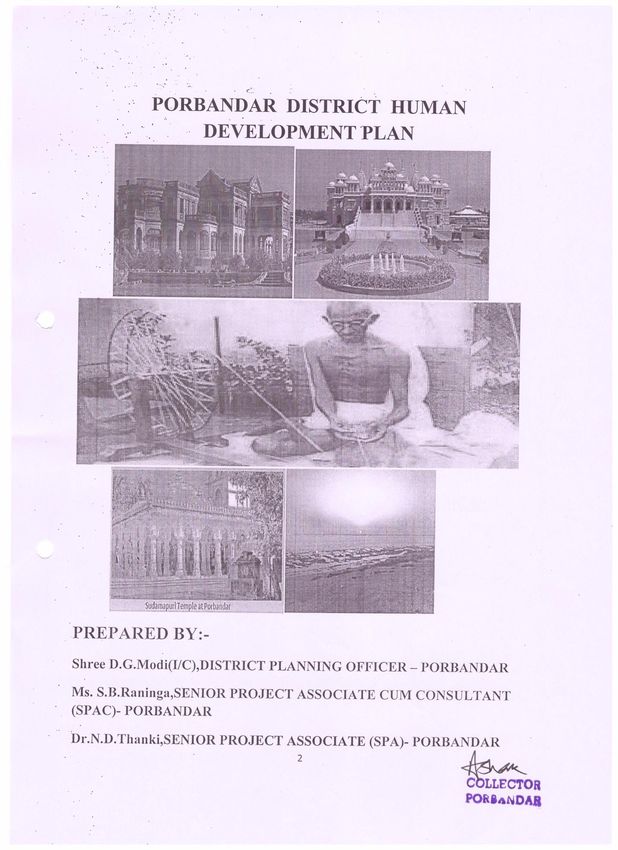
PORBANDAR DISTRICT HUMAN
             DEVELOPMENT PLAN

PREPARED BY:-
Shree D.G.Modi(I/C),DISTRICT PLANNING OFFICER – PORBANDAR

Ms. S.B.Raninga,SENIOR PROJECT ASSOCIATE CUM CONSULTANT
(SPAC)- PORBANDAR

Dr.N.D.Thanki,SENIOR PROJECT ASSOCIATE (SPA)- PORBANDAR
                             2
3
4
PREFACE

          DHDR moving into DHDP, this is specify that DHDR

prepared and with that reference DHDP highly made from it. From

DHDR areas can be identified where more concern is require. In

Short, focus area needs to be identified and highlight those areas

in DHDP. A District Human Development Plan has to basically

address the issue of formulation of a strategy, which will

accelerate the pace of Human Development. The Porbandar

DHDP aims to assist process ofdistrict level planning through the

Human Development Prism. It coversthree aspects related to

Human Development – Education, Health &Standard of Living.

This plan incorporates latest information as far aspossible in

every dimension. The recommendations of the plan areindicative

and point towards planning for further development of state and

also Porbandar district have different issues/problem which are

directly/indirectly effected that’s points are mention in DHDP. So

Department can attention throughout this project.
                                5
6
INDEX

Sr.No.             Details            Page No.
  1.           District Profile          5
  2.           Sector Profile           30
  3.       District Specific Issues     46
  4.        Sector wise Planning        49
  5.        Financial Planning          58
  6.     Recommendations of DHDR        69

                          7
Chapter-1 District profile
Introduction:-
Porbandar, the birthplace of Mahatma Gandhi is
situated at the end of Saurashtra (Gujarat State) and is a
picturesque seaport on the Arabian Sea. To commemorate the
birth of Gandhiji a 79 ft high imposing building has been built in
the lane where Bapu (as Gandhiji is known) was born in 1869.
The prime attraction is the KirtiMandir. It is a three storied
ancestral house of Gandhiji where in the exact place where
Putlibai, Gandhiji’s mother, had given birth to Gandhi, is
marked with a ‘swastik’. A narrow wooden staircase leads the
visitor to the upper story, in particular Gandhiji’s reading room.
Behind KirtiMandir is NaviKhadi, where
Kasturba,Gandhiji’swife was born.The new building adjoining
KirtiMandir, houses a Gandhian Library, a prayer hall, a nursery
and a steeple decorated with episodes from Gandhiji’s life.
The name Porbandar itself conjures a picture of
massive port, a city connected with the two names – Sudama,
the childhood friend of Lord Krishna and Mahatma Gandhi,
8the father of Nation. This impressive city was first called as
Sudamapuri with Sanskrit name of PAURVELAKUL.
The Port City dates back to AD 1045 and records state that the
cith was founded on Shravan Poornima (RakshaBandhan). Till
to date the Kharvas (Fishermen Community) first offer their
prayers to their reigning deity, Paurva Mataji (The Port
Goddess) before beginning their fishing in New Year from
RakshaBandhan day. The present port of Porbandar which is
more than thousand years old is one of the oldest ports in
Western India, The actual habited area was called Sudamapuri,
while PAURVELAKUL was the port established by for trading
with South Africa, Middle East and other places. The name of
Sudamapuri was used along with Porbandar by the Indian
Railways for the Railways Station of Porbandar till as late as
1960.
Sudamapuri, as most of the Rajasthanis call this City,
is very important in the life of the Kshatriyas of Rajasthan who
believe that Sudama and Mirabai were of the same clan and so
even today most Rajasthanis come to take the blessing of
Sudama after their marriage.
9Sudamapuri or porbandar is situated at a distance of
105 km. from Junagadh. “Pare” means small population. The
population settled on Oceanside is also known as pare Porbandar
is famous as birth place of Gandhiji and Sudama. He was special
friend of lord Krishna. They both stayed together at sandipni
ashram. Sudama had taken “Ayachalavarat” under which he will
not ask for anything from anybody. So he has never asked for
anything from lord Krishna.
Location:-
Porbandar from a part of the erstwhile Kathiawar
peninsula located in the western part of Gujarat.The district
headduarter is Porbandar.ThePorbandar district is situated
betweenthe parallels of latitude 21o 20' and 22o 10' and the
meridians of longitude 69o 40' and 70o 10'.The length from
north to south of this territory is about 83.6 km and from east o
west about 80.2 km.It is bounded in the north and west by
Jamnagar district and in east by Junagadh district and in south
by the Arabian Sea.For administrative convenience,the district
has been divided into 3 taluks,with total 179 villages and 6
towns.The area covered by this district is 2,316.00 sq km and
10density is 253 population per sq.km against the density of the
Gujarat is 308 and ranks 23rdin comparison to other districts of
the state.Porbandar district is situated in Saurashtra region.
The terrain of the district is flat level plain except for a
small hilly tract in the north-eastern part covering Ranavav and
Kutiyanatalukas.The slope gradient of the district is from north -
west to south - west in which direction all rivers flow.The
elevation varies between 5 meters and 630 meters from mean
sea level.Among the hill ranges,Barda hill is a prominent one
and attains the maximum altitude of 630 meters.Barda ranges
dominate the landscape for miles around in the north-eastern
part of district.The principal peaks are the Malik 438.30 meters
(1438 feet),the kalo 349.91 meter (1148 feet) and the Bagadi
328.27 meters (1077 feet) and Ghalansar 319.43 meters (1048
feet) the rest of the hills have a thin forest cover.
1112
A. Demographic Details of Porbandar District

Sr.
                   Indicator                Year    District   Porbandar    Ranavav   Kutiyana   Source
No.

                                                                                                 Village
1     Total Talukas                         2015       3             1         1         1
                                                                                                 Profile

                                                                                                 Village
2     Total Villages                        2015      181            75       61        45
                                                                                                 Profile

                                                                                                 Village
3     Total Nagarpalikas                    2015       4             2         1         1
                                                                                                 Profile

                                                                                                 Village
4     Total Village Panchayat               2015      148            73       30        45
                                                                                                 Profile

                                                                                                 Village
5     Total Geographical Area (heq.)        2015   2316(sq)     115045       36842     54808
                                                                                                 Profile

                                                                                                 Village
6     Total Forest Area (heq.)              2015    10492           1614     4038      4840
                                                                                                 Profile

                               Normal

      Total
7                          Institutional    2011    124769          81832    24584     18353     Census
      Households

                            Houseless

                               Total                585449      384660      114568     86221

8     Population               Male         2011    300209      197622       58475     44112     Census

                               Female               285240      187038       56093     42109

                               Total                285674      217203                 16581
                                                                             51890
      Urban
9                              Male         2011    146989      111934                 8451      Census
      Population                                                             26564

                               Female               138725      105269       25326     8130

                               Total                299775      167457       62678     69640

      Rural
10                             Male         2011    153260          85688    31911     35661     Census
      Population

                               Female               146515          81769    30767     33979

11    Urbanization               %          2011     48.80          56.47    45.29     19.23     Census

                                                               13
Total 950 946 959 955
12 Sex Ratio Rural 2011 956 954 964 953 Census
Urban 944 940 953 962
2001-
13 Decadal Growth Rate (%) 9.06 9.8 10.41 4.2 Census
11
Population Density (persons
14 2011 253 336 195 152 Census
per Sq. Km)
Total 65926 41916 14288 9722
Child
15 Male 2011 34648 22090 7505 5053 Census
Population (0-6)
Female 31278 19826 6783 4669
Total 903 915 898 920
Child Sex Ratio
16 (girls per Rural 2011 909 910 894 920 Census
1000 boys)
Urban 896 957 945 NA
17 % of SC Population 2011 8.85 7.93 9.43 12.34 Census
18 SC Sex Ratio 2011 948 952 935 951 Census
19 % ST Population 2011 2.23 1.69 5.34 0.51 Census
20 ST Sex Ratio 2011 937 924 953 913 Census
Basic Demography:-
TALUKA WISE NUMBER OF TOWNS AND VILLAGES
Sl.No. Name of No.of No.of villages
Taluka Towns Total Inhabied
1 Porbandar 3 74 74
2 Ranavav 2 61 59
3 Kutiyana 1 47 46
Total 6 182 179
14The civic status of the six towns is as under:-
Municipality :4
Census :2
Total :6
Demographics focus on the total population, SC
population, ST population, child population. All theses 4
parameters are seen from decadal change as per 2011 census and
sex ratio.
Table 1.3 various demographic factors with district ranking
Demographic Porbandar Rank Porbandar Rank 2011
Features 2001 2001 2011
Population 234 16 255 17
density per sq
km
Percent to total 1.06 24 0.97 25
population of
state
Over all 68.62 12 76.63 15
Literacy Rate
Male Literacy 78.36 ---- 84.56 16
15Female 58.42 ---- 68.32 13
Literacy
Sex Ratio 946 09 947 09
Child Sex Ratio 898 13 984 13
Source - Census Gujarat, Salient features of census 2011
Above table tries to show the ranking of Porbandar
district in various demographic factors compared to other district
in 2001 and in 2011 census. The rank of Porbandar district in the
year 2001 for population density per sq km was 16 which
reduced to 17 in the year 2011. The rank of the district regarding
overall literacy was 12 in the year 2001 which reduced to 15 in
the year 2011. The literacy rate has increased from 68.62% to
76.63% from year 2001 to 2011 respectively. Though the
literacy rate has increased but the rank for overall literacy rate
has also reduced. Regarding the sex ratio and child sex ratio in
both the years Porbandar district was able to maintain a
consistent rank of 9 and 13 respectively with the minor changes
in both the parameters
1.6.1 Total Population
The total population of the state, district and taluka has been shown in
the table below.
16Table 1.4 Total Population by Residence and Gender
State/ Total Population
District/ Total Rural Urban Sex Ratio
Taluka P/M/F 2001 2011 2001 2011 2001 2011 2001 2011
P 50671017 60439692 31740767 34694609 18930250 25745083
State M 26385577 31491260 16317771 17799159 10067806 13692101
F 24285140 28948432 15422996 16895450 8862444 12052982 920 919
P 536835 585449 275460 299775 261375 285674
District M 275821 300209 141068 153260 134753 146989
F 261014 285240 134392 146515 126622 138725 946 947
P 350322 384660 152940 167457 197382 217203
Porbandar M 179973 197622 78149 85688 101824 111934
F 170349 187038 74791 81769 95558 105269 947 943
P 103770 114568 56887 62678 46883 51890
Ranavav M 53346 58475 29192 31911 24154 26564
F 50424 56093 27695 30767 22729 25326 945 957
P 82743 86221 65633 69640 17110 16581
Kutiyana M 42502 44112 33727 35661 8775 8451
F 40241 42109 31906 33979 8335 8130 947 953
Sources - Registrar General of India
Porbandar district was ranked at 25th state according to
percent to total population of the state in the year 2011 (0.97%).
In the previous census i.e. in 2001 the district was at 24 th
position with 1.06 % of the total population of the state. The
change in total population in terms of CAGR is highest in
Gujarat state. It is at 1.78 CAGR and on the second position it is
the population of Ranavav at 0.99% CAGR. For the district of
17Porbandar it is 0.87% CAGR.The decadal change of the
population from 2001 to 2011 census has been reflected in the
chart below. It tries to compare the decadal change in Gujarat
with that of Porbandar District.
The below table shows the sex ratio of state,
district and 3 talukas of porbandar district.
Table 1.5 Sex Ratio of State/District/Taluka
Sr State/District/Taluka Sex Ratio
No
2001 2011
1 Gujarat 920 919
2 Porbandar District 946 947
3 PorbandarTaluka 947 943
4 RanavavTaluka 945 957
5 KutiyanaTaluka 947 953
Sources - Registrar General of India
District sex ratio is on the higher side when compared to
the state. There is an increase in the sex ratio of 2011 when compared to
2001 in Ranavav and Kutiyanatalukas by 1.27% and 0.63% respectively.
There is a marginal decrease in the sex ratio of Porbandartaluka.
Porbandar district has a very minor change in the sex ratio over the
decade. Porbandar district has been ranked 9 th in 2001 and in 2011 when
18compared with other district of the states under the parameter of sex
ratio.
The below table shows the urbanization (number of
people staying in urban areas) in terms of percentage.
Table 1.6 Urbanization in Percentage of the total population
Sr State/District/Taluka Urbanization
No in % of total
population
2001 2011
1 Gujarat 37.36 42.6
2 Porbandar District 48.69 48.8
3 PorbandarTaluka 56.34 56.47
4 RanavavTaluka 45.18 45.29
5 KutiyanaTaluka 20.68 19.23
Sources - Registrar General of India
There is a marginal increase in the urban population of
porbandar district. Porbandar district has higher rate of urbanization as
compared to Gujarat state. In Kutiyanataluka there is a marginal
decrease of urban population. In Porbandar and Ranavavtaluka there is a
marginal increase in urbanization over the decade
191.6.2 Child Population
Table 1.7 Child Population (0-6 years) by Residence and Gender
Child Population (0-6 years)
State/District/ Total Rural Urban
Taluka P/M/F 2001 2011 2001 2011 2001 2011
P 7532404 7777262 5085941 4824903 2446463 2952359
State M 4000148 4115384 2668527 2521455 1331621 1593929
F 3532256 3661878 2417414 2303448 1114842 1358430
P 76099 65926 41886 35786 34213 30140
District M 40102 34648 21992 18750 18110 15898
F 35997 31278 19894 17036 16103 14242
P 48105 41916 23499 19952 24606 21964
Porbandar M 25299 22090 12202 10445 13097 11645
F 22806 19826 11297 9507 11509 10139
P 16204 14288 8915 7935 7289 6353
Ranavav M 8573 7505 4744 4190 3829 3315
F 7631 6783 4171 3745 3460 3038
P 11790 9722 9472 7899 2318 1823
Kutiyana M 6230 5053 5046 4115 1184 938
F 5560 4669 4426 3784 1134 885
Sources - Registrar General of India
The growth of the population in the age of 0-6 year is
positive in Gujarat state. The total population of Porbandar District and
its talukas is reducing in the age of 0-6 years. The male and female
population of child is also reducing in all the 3 talukas of the district.
The reducing trend is seen in the urban and rural areas. Male and Female
20population in the rural area of the state is reducing and in the urban area
it is increasing.
Child population between the ages of 0-6 years is
considered by census. Below mentioned chart mentions of the
percentage of decadal change in child population in Gujarat state and in
Porbandar district.
Below table show a change in the sex ratio in the state, district
and in various talukas.
Table 1.8 Sex ratio of child population (0-6 years)
Sr State/District/Taluka Sex Ratio
No
2001 2011
1 Gujarat 883 890
2 Porbandar District 898 894
3 PorbandarTaluka 901 898
4 RanavavTaluka 890 904
5 KutiyanaTaluka 892 924
Sources - Registrar General of India
The change in the sex ratio from 2001 to 2011 census in the
Gujarat state has been positive. There is a marginal decrease in the sex
ratio in the district. The rank of the district was 13 in 2011 when
compared with other districts on the factor of the sex ratio of 0-6 years.
In the year 2001 the district was at the same rank. It has not seen any
change in the ranking over the decade. There is a marginal decrease in
21the sex ratio in Porbandartaluka and a phenomenal increase in the sex
ratio in Kutiyanataluka from 892 to 924.
1.6.3 SC population:-
Fig 1.9 SC population by Residence and Gender
State/
District/ P/ Scheduled Caste Population
Taluka M/ Total Rural Urban
F 2001 2011 2001 2011 2001 2011
P 3592715 4074447 2180441 2281573 1412274 1792874
State M 1866283 2110331 1127423 1176107 738860 924224
F 1726432 1964116 1053018 1105466 673414 858650
P 48233 51830 26673 29068 21560 22762
District M 24825 26607 13731 14955 11094 11652
F 23408 25223 12942 14113 10466 11110
P 27863 30492 14094 15533 13769 14959
Porbanda
M 14236 15623 7222 8029 7014 7594
r
F 13627 14869 6872 7504 6755 7365
P 10233 10696 4041 4639 6192 6057
Ranavav M 5346 5529 2102 2367 3244 3162
F 4887 5167 1939 2272 2948 2895
P 10137 10642 8538 8896 1599 1746
Kutiyana M 5243 5455 4407 4559 836 896
F 4894 5187 4131 4337 763 850
Sourcecs - Registrar General of India
22The below table shows the % of decadal change and % of SC
population to total population. The information is for state, district and
talukas.
Table 1.10 SC population in Percentage of decadal change and Percentage of
SC population in Total Population
Sr State/District/Taluka % of decadal change % of SC pop to total
No pop
Total Rural Urban Total Rural Urban
1 Gujarat 13.41 4.60 26.90 6.74 6.58 6.96
2 Porbandar District 7.46 8.98 5.58 8.85 9.70 7.97
3 PorbandarTaluka 9.44 10.21 8.64 7.93 9.28 6.89
4 RanavavTaluka 4.52 14.80 -2.18 9.43 7.40 11.67
5 KutiyanaTaluka 4.98 4.19 9.19 12.34 12.77 10.53
Sourcecs - Registrar General of India
The percentage of SC population in the district is higher than
the percentage in Gujarat state. The decadal change in SC population is
higher in the Gujarat state when compared to porbandar district but the
percentage of SC population in porbandar district (8.85 %) is higher than
the Gujarat State (6.74 %)
The below mentioned table shows sex ratio of SC population.
23Table 1.11 Sex ratio of SC population
Sr. State/District/Taluka Sex
No Ratio
1 Gujarat 931
2 Porbandar District 948
3 PorbandarTaluka 952
4 RanavavTaluka 935
5 KutiyanaTaluka 951
Sourcecs - Registrar General of India
The sex ratio of porbandar district and its talukas is higher
than the sex ratio of Gujarat as per the census 2011
1.6.4 ST Population
Fig 1.12 ST Population by Residence and Gender
State/
District/ Scheduled Tribe Population
Taluka Total Rural Urban
P/M/F 2001 2011 2001 2011 2001 2011
P 7481160 8917174 6866637 8021848 614523 895326
State M 3790117 4501389 3471002 4042691 319115 458698
F 3691043 4415785 3395635 3979157 295408 436628
P 6456 13039 5133 9945 1323 3094
District M 3380 6730 2684 5146 696 1584
F 3076 6309 2449 4799 627 1510
Porbandar P 2040 6483 862 4405 1178 2078
24M 1069 3369 464 2310 605 1059
F 971 3114 398 2095 573 1019
P 4303 6118 4186 5132 117 986
Ranavav M 2253 3132 2176 2625 77 507
F 2050 2986 2010 2507 40 479
P 113 438 85 408 28 30
Kutiyana M 58 229 44 211 14 18
F 55 209 41 197 14 12
Sourcecs - Registrar General of India
Below mentioned table shows the percentage of decadal
change and % of ST population to Total population. The said
information is for state, district and various talukas of porbandar district.
Table 1.13 ST population in decadal change and % of ST population to total
Population
Sr State/District/Taluka % of decadal change % of ST pop to total
No pop
Total Rural Urban Total Rural Urban
1 Gujarat 19.2 16.8 45.70 14.75 23.12 3.48
2 Porbandar District 101.97 93.75 133.90 2.23 3.32 1.08
3 PorbandarTaluka 217.79 411.00 76.40 1.69 2.63 0.96
4 RanavavTaluka 42.18 22.6 665.80 5.34 8.19 1.90
5 KutiyanaTaluka 287.61 380.00 7.14 0.51 0.59 0.18
Sourcecs - District Statistical Report. 2011-2012
The decadal change in the ST population of Gujarat state is
comparatively low with that of porbandar district but the percentage of
ST population to total population is low in the district when compared to
25Gujarat state. The percentage of ST population with respect to total
population in the porbandar district is between 1-3 %
The table shows the sex ratio of Gujarat state, porbandar district and 3
talukas
Table 1.14 Sex ratio of ST population
Sr. State/District/Taluka Sex
No Ratio
1 Gujarat 981
2 Porbandar District 937
3 PorbandarTaluka 924
4 RanavavTaluka 953
5 KutiyanaTaluka 913
Sourcecs - Registrar General of India
The sex ratio of ST population is less in the porbandar district
and in its talukas when compared to Gujarat state. The sex ratio of the
district is at 937 and of the state is 981 and in the taluka the least is in
Kutiyana followed by Porbandar and Ranavav has the highest sex ratio
with 953.
Climate and Physical Characteristics :-
The geology of Porbandar district is mainly composed
of alluvium, brown sand etc, deccan traps, Inter-trappean beds. The
alluvium soil found in the plain areas of the district is known as ‘Ghed’
and these are fertile soil which supports good crops of the district. The
26black soil is also found in Kutiyana and Ranavavtalukas. The district has
good deposits of limestone and chalk clay. Some patches of forests are
found in the district.
The district has a total of 9.68% of total wetland areas.
Total 226 wetlands are mapped including 95 small wetlands (< 2.25 ha)
with 22199 ha area. Inland wetlands contribute 27.3% of the total
wetland area and coastal wetlands contribute 72.7% of the total wetland
area. Major wetland categories of the district are Lagoons, Rivers/
streams, Reservoirs and Sand/beach
Economic Activity:-
1.The economy of the district is basically dependent on agricultural
activities as 49.60% workers are engaged in agricultural work.
2.50.40% of workers are engaged in other works.
3.Kandla port is the major port of wesern region so a big junction for
import-export industries.
4.Non metallic mineral products,Chemical products and food products
are the othe import activities workers engaged in.
27Physical Infrastructure in District:-
1.6.5 Electrification of Households
Table 1.15 Various Lighting Facilities (Percentage of HH)
Sr. Source of Porband Gujarat Porbandar Gujarat
No Lighting ar (2001) (2011) (2011)
(2001)
1 Electricity 92.81 80.41 93.81 90.41
2 Kerosen 6.43 18.10 5.18 8.08
3 Solar 0.34 0.24 0.34 0.13
4 Other Oil 0.06 0.15 0.13 0.21
5 Any Other 0.04 0.25 0.17 0.21
Source
6 No Lighting 0.32 0.86 0.38 0.96
Source- Registrar General of India
The above table shows various sources of lighting. It is in
percentage of HH. The percentage of HH without lighting is less (0.06)
in the district when compared to Gujarat State (0.10)
The below mentioned graph shows the percentage of electrification of
households in 2001 and in 2011. The said data is of Gujarat state and of
porbandar district.
1.6.6 Sources of Drinking water
The major sources of drinking water are Tapwater, Well,
Handpump and Tubewell. The below mentioned graphs shows the
28percentage of HH with these facilities in Gujarat state and Porbandar
district.
Table 1.16 Percentage of HH with various sources of Drinking water
Sr Source of Gujarat Porbandar Porbandar
# Drinking Water (2001) (2001) Gujarat (2011)
(2011)
1 Tap water 62.31 52.15 69.03 62.11
2 Well 11.70 26.37 7.09 18.66
3 Handpump 16.65 13.68 11.62 7.45
4 Tubewell/Borewe 5.13 2.58 9.60 5.56
ll
5 Spring 0.18 0.02 0.09 0.02
6 River/Cannal 0.43 0.03 0.34 0.10
7 Tank/Pond/Lake 0.35 2.01 0.22 1.89
8 Other Sources 3.25 3.15 2.00 4.20
Source- Registrar General of India
The above table shows a positive trend in the major sources
of Drinking water. There is an increase in the tapwater and decrease in
other sources of drinking water which shows a positive effect of the
government activities.
1.6.7 Availability of bathroom and latrine within the house
Below mentioned table shows percentage of households
having latrine facility in 2011
29Table 1.17 Percentage of Households having latrine facilities in the house
Area Flush/pour latrine Service Num of
Name % of Pit Latrine connected to Latrine Night HH
HH soil not
having disposed having
facility With Without Piped Septic Other into latrine
in the Slab slab Sewer tank system open within
house drain Premises
Gujarat Total 57.35 4.18 0.29 28.98 22.80 0.82 0.06 0.21 42.65
Rural 33.04 5.92 0.40 3.85 21.65 1.05 0.06 0.11 66.96
Urban 87.70 2.00 0.14 60.38 24.25 0.54 0.06 0.33 12.30
Porbandar Total 57.94 14.27 0.24 5.85 36.56 0.68 0.04 0.30 42.06
Rural 39.15 20.24 0.39 1.18 16.48 0.79 0.03 0.04 60.85
Urban 77.44 8.07 0.08 10.70 57.41 0.58 0.05 0.57 22.56
Source – Registrar General of India
In the above table the percentage of HH having latrine
facility in the house in the district and the state is the same. 57% of the
total population in the state and district has latrine facility within the
house. In the district pit latrine with slab are 14% where as in the state it
is only 4.18%. In Gujarat state piped sewer system is 28.98% of HH and
in the district it is only 5.85%.
The below mentioned chart shows the percentage of HH
having the bathroom and latrine facility within the premises for the
Gujarat and porbandar district. It tries to explain the increase over the
decade.
1.1 Administrative Set up
Gujarat panchayat act is in force in Gujarat subject to 73 rd amendment in
the constitution of India, under which management and control of
panchyati raj is done.
30District Panchayat
Control over activities of district panchayats, talukapanchayats and
gram panchats, to provide assistance. Management and control on
activities transferred from revenue, education co-operation Irrigation,
Cattle breeding, agriculture by State Govt. work of activities of
Panchayats Department at district level.
Porbandar district is divided into 3 talukas viz.
Porbandar, Ranavav and Kutiyana. Table 1.1 and table 1.2 shows the
basic units of administration and number of villages in each taluka
respectively.
Table 1.1 Units of Administration
Sr.
No. Heads Nos.
1 Area (Sq. Kms.) 2316
2 No. of Talukas 3
3 Prants 2
Municipal
4 Corporations -
5 Municipal Towns 6
6 Panchayats 153
6.1 TalukaPanchayats 3
316.2 Gram Panchayats 150
7 Villages 182
7.1 Inhabited 182
7.2 Unhabited -
Source – Registrar general of India
The district of Porbandar is divided into 3 talukas namely
Porbandar, Ranavav and Kutiyana. The district has 6 Municipal towns
and total villages under 3 talukas is 182. These villages has 150 Gram
Panchayats.
Table 1.2 Number of Villages in each taluka
Table 1.2 Number of villages in each taluka
Taluka Villages Village panchayat
Porbandar 79 73
Ranavav 64 30
Kutiyana 49 46
Source - District Statistical Report 2011-2012, IG Directory
These 3 talukas consist of 182 villages and 150 Gram
panchayats and 6 municipal towns. Porbandartaluka has the highest
number of villages compared to other two talukas.
32Chapter: 2 Sector Profile
There are Three Sectors are covered under this chapter
which are as follows :-
1. Education
2. Health
3. Livelihood
1. Education :-
It is necessary to lay emphasis on education for
improving standard of living of the people of any nation. Due to
education, other sectors like health, employment, child development,
women’s development etc are also developed. In view of multiple
benefits of the education, the investment made in this sector, are
having capacity of giving manifold compensation. Education not only
improves the standard of living of people but also provides
opportunities of progress. Individual opportunities of individual
development and progress are not available to illiterate persons, as
being available to literate persons.
Status of Literacy
The below mentioned table shows the status of literacy in
percentage in Porbandar district.
33Table 2.1 Status of Literacy (Percentage) in Porbandar District
2001 2011
Regional Regional
Total Rural Urban Gap Total Rural Urban Gap
Person 68.62 60.11 77.38 17.27 75.78 69.39 82.37 12.98
Male 78.36 71.31 85.56 14.25 83.45 78.61 88.43 9.82
Female 58.42 48.45 68.74 20.29 67.75 59.82 76 16.18
Gender
Gap 19.94 22.86 16.82 16.24 19.33 12.94
Source – Registrar General of India
The overall literacy in Porbandar was 68.62 in 2001 which rose to 75.78 in
the year 2011.
The regional gap in the year 2001 was 17.27 which reduced to 12.98 in the
year 2011.
The gender gap was 19.94 in the year 2001 which reduced to 16.24 in the
year 2011.
Schemes and Programs for Education
Gujarat government has started with various schemes to
improve literacy rates, enrollment rate, and retention rate in the primary
and upper primary categories.
Below mentioned table shows various schemes adopted by
Porbandar district
34Various Schemes and their brief details
No Scheme Name Brief Detail of Scheme
1 SarvaShikshaAbhiyan SarvaShikshaAbhiyan is a nation-wide movement
to ensure primary education in conformity with
the Clause 86 of Constitution of India that makes
it compulsorily available to all children between 6
and 14 years free of cost.
2 Mid Day Meal Scheme To improve the nutritional/ health standard of
growing children.
To reduce drop-out rate and to increase attendance
and to attract poorer children to come to the
school.
3 Vidyalakshmi Bond Vidyalakshmi Bond Yojana is implemented
Yojana with a view to encouraging education
among girls in rural areas.
Villages with less than 35% literacy among
females are covered under Vidyalakshmi
Bond Yojana.
Under Vidyalakshmi Bond Yojana, on
admission in class I, a girl child is given
Narmada Shrinidhi Bonds of Rs.2000 and
on her passing out the Class VIII, the
amount together with interest is paid.
In urban areas also a girl child in a BPL
family, when admitted to Class I in school,
is given Narmada Shrinidhi Bonds of
Rs.2000 under Vidyalakshmi Bond Yojana.
4 Vidya Deep The State Govt. implements this Yojana in
memory of the children died in Earthquake
on 26 Jan 2001.
Per student assistance is raised to Rs.50000
from 2008 – 9 from Rs.25000.
The objective is to help the parents of
children who died.
A 24 hour Insurance cover is provided to all
students reading in primary schools,
Ashramshala, secondary and higher
35secondary schools in Govt. sector or with
Govt. aid.
The insurance premium is paid by Govt.
If the child dies, the following sum are paid
to parents
Rs.50000 if child was in
primary school
Rs.50000 if the child was
student of secondary or higher secondary
school
5 PathyaPustakYojana Course material is provided free of cost to all
students reading in Govt. primary schools.
6 SadaPraveshUtsav A welcome festival is organized to celebrate entry
in Class I of primary schools every year.
7 KanyaKelavaniRathYatra KanyaKelavaniRathYatra is organized to promote
girl education.
8 Educational Scholarships Students who are socially and educationally
backward are given various scholarships from
Rs.150 to Rs4250 from standard 1 to collage
9 SarkariChatralay The scheme has been started since December
2007 for the students who are not able to support
financially their college education. One school is
prepared for the girls and one for the boys and
students need not to pay any amount for the stay
and food.
10 AdarshNiwasSada This scheme is for the students of standard 8 to
10. Students with good academic track record are
given the opportunity to study, stay without any
fees. There is 1 AdarshNiwasShada in Porbandar
district.
11 Grant-In-Aid Chatralay Schools which are run by NGO are given grant to
provide the students with free hostel
accommodation. In Porbandar district there are 6
such schools. These are given to students of 8 to
10 standards
12 Grant-In-Aid Schools which are run by NGO are given grant to
Ashramsada provide the students with free hostel
accommodation. In Porbandar district there are 1
36such schools. These are given to students of 1 to 7
standards
13 SarswatiSadhanaYogna This scheme is for the girl students of standard 8.
The girls who go to school by commuting from
their home are paid the amount of Rs.2000 so that
a cycle can be purchased. The girl student who
commute of more than 2.5 Km in the village and
3.5 Km in the city are given the benefit under this
scheme
Source – District Education office
Porbandar district tries to implement the state and the
national level educational schemes to provide a better learning
environment for the students.
C. Education Details of Porbandar District
Sr.
Indicator Year District Porbandar Ranavav Kutiyana Source
No.
Total 75.78 77.9 71.5 71.8
Male 83.45 85 79.8 81.3
1 Literacy rate Female 2011 67.75 70.5 62.9 61.8 Census
Rural 69.39 69.1 69.16 70.3
Urban 82.37 84.6 74.27 77.83
Total 73.01 69.79 73.45 71.65
2 SC Literacy Rate Male 2011 83.43 81.19 84.85 83.29 Census
Female 62.01 57.67 61.45 59.31
Total 56.36 57.45 48.10 51.76
3 ST Literacy Rate Male 2011 65.72 66.95 57.09 58.76 Census
Female 46.39 46.82 39.03 44.17
Total 15.70 14.50 16.9 19.5
Gender Gap in
4 Rural 2011 18.79 18.86 16.84 20.35 Census
Literacy Rate
Urban 12.43 11.08 16.87 16.10
Gross enrolment ratio
5 2014-15 118.65 119.68 118.09 115.07 SSA
(Class I-VIII)
Net Enrolment Ratio
6 2014-15 99.00 98.82 99.51 98.98 SSA
(Class I-VIII)
Total 1.18 1.65 0.49 3.78
Dropout Rate (I-
7 Boys 2014-15 1.05 2.07 0.62 3.79 SSA
V)
Girls 1.33 1.26 0.50 4.14
378 Transition Rate 2014-15 96.31 97.23 96.04 92.52 SSA
9 Gender Parity Index (GPI) 2014-15 0.897 0.908 0.856 0.912 SSA
10 Student Teacher Ratio 2014-15 20.98 21.08 21.77 19.41 SSA
% of Female Teachers
11 2014-15 47.95 53.62 47.90 32.78 SSA
(P + UP)
12 Student Classroom Ratio (SCR) 2014-15 19.65 19.43 21.08 18.58 SSA
Number of Villages not having
13 2014-15 0 0 0 0 SSA
a single primary School
14 % schools Electrified 2014-15 96.95 100.00 89.02 98.61 SSA
% schools with Drinking water
15 2014-15 100% 100% 100% 100% SSA
facility
% of schools with sanitation
16 2014-15 95.12 98.28 84.15 100.00 SSA
facility
% schools with sanitation
17 2014-15 90.24 94.83 78.05 93.06 SSA
facility exclusively for girls
% schools not having computer
18 2014-15 26.22 23.56 43.90 12.50 SSA
lab
% schools not having
19 2014-15 25.61 22.99 36.59 19.44 SSA
playground
% schools not having compound
20 2014-15 4.57 2.30 13.41 0.00 SSA
wall
No. of ITIs/Vocational Dist. Labor &
21 2014-15 3 1 1 1
Training Centre Emp. Office
382.Health
Porbandar is known for its closed network of hospitals and
medical centers that include Specialty Clinics, Acupressure Centers,
Yoga Centers and others. Through such an extensive medical support the
city guarantees health for every citizen. Porbandar city is supported by
excellent coverage of hospitals and nursing homes for better healthcare.
The renowned hospitals include Shri MurarjiKhairajThakarar Hospital,
Bhavsinhji Civil Hospital, Shivam Eye Hospital, Shri
JivandasDhamecha Eye Hospital and Aastha Hospital where all sorts of
problems related to different body organs are treated with intensive care.
Clinics are considered as added medical facility apart from hospitals.
There are umpteen clinics in Porbandar (Healthcare in Porbandar, n.d.).
Porbandar district has many allopathic, ayurvedic and
homeopathic medical institutions. In rural and urban areas the allopathic
medical institutions consists of hospitals, PHCs, CHCs, dispensaries and
others. Ayurvedic and Homeopathic medical institutions are often
managed by state government and local bodies.
39B. Health & Nutrition details of Porbandar District
Sr.
Indicator Year District Porbandar Ranavav Kutiyana Source
No.
Birth Rate (per 1000
1 2015 19.2 25.1 8.3 7.1 CRS
population)
Death Rate ( per 1000
2 2015 6.5 7 5.7 5.2 CRS
population)
Infant Mortality Rate
3 (IMR) (per 1000 live 2015 3 3.00 0 3.00 CRS
births)
Health
Children fully immunized 2014-
4 84.92 86.14 90.85 71.59 Statistics
% 15
(MIS)
Children Who received at
Health
least one 2014-
5 84.92 86.14 90.85 71.59 Statistics
Vitamin A dose(12-35 15
(MIS)
months) %
Mothers who had at least Health
2014-
6 three antenatal care visits 92.39 93.56 89.64 90.45 Statistics
15
for their last birth (%) (MIS)
Health
2014-
7 Institutional Delivery 99.70 99.85 99.39 99.41 Statistics
15
(MIS)
Proportion of Women
receiving Postnatal Health
2014-
8 Checkup within 48 hours 99.70 99.85 99.39 99.41 Statistics
15
after Delivery to total (MIS)
reported deliveries
Health
9 Total number of PHCs 2016 11 6 3 2
Statistics
Average population 2014- Health
10 27252 27909 20892 34820
served at PHC 15 Statistics
40Health
11 Total number of CHCs 2016 4 2 1 1
Statistics
Average population Health
12 2016 74943 83728 69640 62678
served at CHC Statistics
Total Number of Sub Health
13 2016 84 42 20 22
Centers Statistics
Average population Health
14 2016 10318 3987 3482 2849
served at Sub Centers Statistics
Number of District Health
15 2016 1 1 0 0
Hospital Statistics
Number of Ayurvedic Health
16 2016 6 2 2 2
Dispensary Statistics
Number of Homeopathy Health
17 2016 2 1 0 1
Dispensary Statistics
Number of Operational Village
18 2016 489 275 105 109
Anganvadis Profile
Number of Anganvadis
Village
19 having its own 2016 368 183 83 102
Profile
Building
Number of children
Village
20 registered in 2016 36200 22774 6926 6500
Profile
Anganvadis
Number of Malnourished
Children among Village
21 2016 1008 764 121 123
registered children in Profile
Anganvadis
Children breastfed within 2014-
22 83.8 97.3 82.9 103.4 HMIS
one hour of birth (%) 15
41Children under 5 years Dec- MPR-
23 2.78% 3.35% 1.75% 1.89%
who are underweight (%) 15 WCD,Go G
% of Normal underweight Dec- MPR-
24 94.21% 92.18% 97.81% 97.49%
children 15 WCD,Go G
% of moderately Dec- MPR-
25 5.08% 6.91% 1.88% 2.08%
underweight children 15 WCD,Go G
% of severely Dec- MPR-
26 0.71% 0.91% 0.32% 0.43%
underweight children 15 WCD,Go G
Health Care Infrastructure Accessibility :-
Hospitals are basic health care infrastructure through which
the medical services and treatment is provided to the people. The public
health system comprises of a set of state-owned health care facilities
funded and controlled by the government of India. Some of these are
controlled by agencies of the central government while some are
controlled by the State Government (Public Health System, n.d.).
District hospitals, sub-divisional hospital and Primary Health Center
(PHCs) and Community Health Centers (CHCs) have a crucial role to
play. The health system consists of three-tiered structure, which is
described in Figure 3.4.
42Figure 0:1 Three-Tiered Health Structure
HealthCare Infrastructure in Porbandar District
Health Infrastructure In Nos. Health Infrastructure In Nos.
Sub Centers 85 District Hospitals 1
Primary Health Centers (Rural) 11 Beds Available in CHC 120
Community Health Centers (Rural) 4 Beds in Rural Areas 170
Urban Health Centers (Urban) 3 Beds in Urban Areas 421
Ayurvedic Institutions 6 First Referral Units 1
Homeopathic Institutions 2 Mobile Medical Units 1
Beds Available in Hospitals 361 AYUSH 6
Beds Available in PHC 110 Ambulance (Govt.) 19
(Source: Chief District Health Office, Porbandar)
Talukawise Details of Hospitals and Beds
Taluka Government Hospital Specialty Beds
Porbandar 2 9 321
Ranavav 1 3 30
Kutiyana 1 2 30
District Total 4 14 381
(Source: Chief District Health Office, Porbandar)
Schemes And ProgrammesFor Health Care:-
In Porbandar District Multiple programmes and schemes for
healthcare and children care are being implemented for specific target
group beneficiaries.
ChiranjeeviYojana
BalSakhaYojana
Kasturba PoshanSahayYojana (Nourishment Assistance Scheme)
Baal Sanjeevani Center (Malnutrition) Yojana
JananiSurakshaYojana (Mother Security Scheme)
ShalaArogyaTapasaniKaryakram (Program to Inspect Health in Schools)
RashtriyaSvasthyaVeemaYojana (National Health Insurance Scheme)
43 DeekariYojana (Scheme for daughter)
KshayNiyantranYojana (T.B. Control Program)
Leprosy Yojana
Free Medical Aid
National Health Insurance Scheme (NID) Yojana
National Programme for Control of Blindness and Cataract Performance
National Programme for Control of Blindness- School Eye Screening and
Eye Donation
MukhyaMantri (Chief Minister’s)AmrutumYojana
3.Livelihood:-
Livelihood refers to the earning the money for sustaining life.
In rural areas the major livelihood sources are agriculture and animal
husbandry and other elements like industries, fisheries etc. These all
sectors also effect to the development of district to see the situation of
Porbandar district it’s depend on agriculture, animal husbandry and
fisheries.Porbandar’stalukas have depend on mostly agriculture, animal
husbandry and in district level mostly in fisheries and commercial
organizations.
Forest can act as a provider of rich source of natural resources.
There exists high commericial demand for various primary forest
products and value added forest products. The total geographical area of
Gujarat and Porbandar is 1,96,024 (Sq.Kms) and 2,298 (Sq.Kms)
respectively.
44Porbandar has a rich coastline. It is blessed with the huge belt
of saline water, which is a potential source of fish breeding and
development of ancillary fishing industry. Fish catching and units
associated with fishery have a huge scope of development in Porbandar.
Major occupation of the ‘Kharva’ community in Porbandar district is
sea-farming. ‘Vichuda, Halwa, Boomla, Dara, Dhol, Palla, Tanti, Madra,
Khaga, Gandiya, Vam, Sag, Surmai, Chappari, Ravas, Baga, Dai, Perch,
Dhoma, Shrimp-Prawns, Bolster, Crab, Squid, Katal, Tuna, Mackrelli,
Ranidish, Sol fish’ etc, are different types of fishes found in the sea.
Livelihood By Tourism Activity Porbandar attractions include
the famous KirtiMandir, Rokhadia Hanuman temple, Sudama Mandir,
Sandipani Vidyaniketan, Tara Mandir, Bharat Mandir. Kirti Mandir, the
birthplace of Mahatma Gandhi holds great historical importance. The
place has emerged as one of the major tourist attractions of Porbandar.
The Kirti Mandir is situated close to the ancient Haveli belonging to the
Gandhi family. Also known as the "Temple of Peace", the Kirti Mandir
is counted amongst the popular monuments of the nation. Tara Mandir is
one of the popular tourist destinations of Porbandar. There is an
overhead round screen inside the Tara Mandir planetarium with celestial
bodies depicted on it. The scientific projection of these stars and planets,
with the help of special effects, adds to the interest of the viewers.
The Sudama Mandir is a beautiful shrine dedicated to Sudama, the best
friend and devotee of Lord Krishna. The temple, located in the center of
the Porbandar city, is said to be the only temple in India dedicated to this
45ardent devotee of Lord Krishna. The Sudama Mandir at Porbandar,
constructed between 1902 and 1907, holds a great historic and religious
significance. Chowpaty is the famous beach of Porbandar. It is located at
a kilometer's distance, from the city. This beautiful beach has various
hotels resorts and villas lined up along the water front. The rooms here
provide a splendid view of the seafront along with a number of
facilities.
The famous HuzoorMahal is also located along the beach.
Chowpaty, the prominent attraction of the Porbandar city, is of great
interest to both locals and tourists. Porbandar Bird Sanctuary is situated
in the heart of the Porbandar city and spread over an area of about 1
square kilometers. Porbandar Bird Sanctuary of Gujarat is the only bird
sanctuary of the state that provides all the legal protection to varied
species of birds of those who nests here. You will find a large lake inside
the Porbandar Bird Sanctuary of Gujarat that attracts a large number of
migratory birds every year. Barda Wildlife Sanctuary lies 15 kilometers
away from the Porbandar city and faces the great Arabian Sea.
Previously, the forests of Barda Wildlife Sanctuary, Porbandar belonged
to the ex-princely state of Ranavav or Porbandar and Jamnagar. Thus it
is still known as RanaBarda and Jam Barda.It occupies an area of 192.31
square kilometers area.
46D. Livelihood Details of Porbandar District
Sr.
Indicator Year District Porbandar Ranavav Kutiyana Source
No.
Dir. Of
68 Total Irrigated Area (Ha.) 2013-14 22300 7600 3800 10900
Agricultur e, GoG
Dir. Of
69 Gross Cropped Area (Ha.) 2013-14 252077 144157 41815 66105
Agricultur e, GoG
Dir. Of
70 Net Sown Area (Ha.) 2013-14 119373 58321 22875 38177
Agricultur e, GoG
Area Sown More than once Dir. Of
71 2013-14 14632 7258 4291 3083
(Ha.) Agricultur e, GoG
Dir. Of
72 Area under Horticulture (Ha.) 2013-14 2256 752 752 752
Agricultur e, GoG
Total 39.50 39.30 39.30 40.50
Work
73 Participation Male 2011 58.00 57.80 57.00 60.10 Census
Rate
Female 20.00 19.70 20.90 20.10
Total 42.14 40.23 41.94 40.52
74 SC WPR Male 2011 58.80 57.56 58.67 60.21 Census
Female 24.55 22.13 23.90 19.79
Total 37.76 51.90 22.67 45.30
75 ST WPR Male 2011 51.90 50.07 52.65 54.25 Census
Female 22.67 15.99 24.53 35.29
Total 84.50 83.90 85.70 85.89
Main working
76 population 2011 Census
(%)
Male 92.40 91.63 93.94 94.03
47Female 60.40 59.88 62.26 60.38
Total 15.46 16.11 14.31 14.11
Marginal
77 Working Male 2011 7.56 8.37 6.06 5.97 Census
Population (%)
Female 39.55 40.12 37.74 39.62
% of Cultivators to Total
78 2011 28.42 26.13 25.28 42.37 Census
Workers
% of Agricultural Labourers to
79 2011 21.18 16.62 27.25 33.09 Census
Total Workers
80 % Other to total workers 2011 49.37 56.12 46.78 23.53 Census
Total 47663 30663 8680 8320
Total number of 6th Economic
81 Rural 2013 27403 15138 5150 7115
establishments Census
Urban 20260 15525 3530 1205
Total 82882 54496 16429 11957
Rural 42220 22270 9924 10026
Number of
6th Economic
82 persons Urban 2013 40662 32226 6505 1931
Census
employed
Male 67012 44830 13155 9027
Female 15870 9666 3274 2930
Livestock
83 Total Livestock 2012 241195 128895 54642 57658
Census
Livestock
84 Total Poultry 2012 9034 3857 1051 4126
Census
48Chapter :-3 District Specific Issues
To seeing the sector profile of porbandar district some
district specific issues can be find throughout the related to the
porbandar district sectors that’s education, health and livelihood as
above.
In Ranavav and Porbandartaluka the percentage of
computer lab facility in the school is less when compared
the district.
Percentage of Female literacy in the district has increased
over the last decade but still it is less when compared to
male literacy.
Enrollment of the students is less in upper primary
category when compared to primary. During the last 5
years increase in terms of CAGR in primary is 3.39% and
in upper primary is 3.24%.
Population served per Allopathic hospitals is less in rural
areas compared to urban counterparts.Poor function of
CHC is found at Ranavav and Kutiyanataluka.
Staff against IPHS norm of 40 is less zero which is a
hurdle in providing healthcare services.
51% and 12% post of MO and ANM cadre are vacant and
27% post of staff nurse is not filled.
49 There is a paramedical staff as filled position is only 64%.
Children are found affected by Anemia and Skin disease
problem.
Despite sanction of post of General Surgeon, Physician,
Gynecologists and Orthopedic Surgeon, it has not been
filled.
Number of MO recruited is less than the post sanctioned.
Human resource power of medical officer and specialist is
worrisome issue.
More than 50% area of all taluka is not irrigated through
proper sources.
Yield off cotton is lower in district when compared to
state.
More than 50% woman of rural and urban areas work as
agriculture labours.
Decline of CAGR of 11.19% was noticed for mechanized
boats.
Fishing co-opertive society increased from 70 to 71 over 4
years and increase in members is just 0.60%
There was a reduction at the rate of 6.29% CAGR with
respect to training imparted to fishermen.
50 Some of processing co-operative societies likes fruits and
vegetable,poultry,fishetc were closed down.
Non-working factories are 24%.
58 different types of units are closed down in
Porbandartaluka.
Rainfall in the district has drastic fluctuation in the last
four years.
Kutiyana district is not connected with the railway line.
51Chapter:4 Sector Wise Planning
In this chapter we prepared Sector wise planning separately for each
sector which is further made up with the combination of part (a) and (b). Part (a)
show “Gap Analysis” and Part (b) show “Action Plan”. The Sector wise planning
is described as Education,Health and Livelihood.
Chapter : 4 (A) Gap Analysis :- 1.Education :-
Sr. Taluka Indicators Current Status Gap Target* (year wise)
No.
(Unit) Year Units
1 75.78 2016-17 75.78%
76.63 2017-18 76.63%
77.48 2018-19 77.48%
All Literacy 76.63% is all talukas literacy rate with
78.33 2019-20 78.33%
Talukas Rate including male and female.
79.18 2020-21 79.18%
80.03 2021-22 80.03%
2 2412 2016-17 2412
2423 2017-18 2423
CALP 2434 2434
All 2018-19
Facilities 2412 Computers are provided in total
Talukas for 242 schools including all talukas. 2445 2019-20 2445
Students
2456 2020-21 2456
2467 2021-22 2467
3 63.3 2016-17 63.3%
It is describe that literacy Gap 64.51 2017-18 64.51%
between all talukas
includePorbandar has highest rank 65.72 2018-19 65.72%
All Literacy
Talukas
with literacy 70.61% where 66.93 66.93%
Gap 2019-20
askutiyana has 64.88%, and with
compare taluka wise literacy gap 68.14 2020-21 68.14%
ranavav has lowest rate with 63.03%.
69.35 2021-22 69.35%
521. Literacy Rate :- literacy rate in allTalukason every year from the year 2016-17,
They plan to improve this indicator by 0.85% of literacy rate and will be achieved
the target upto the year 2021-22 to reached atleast at district average.
2. literacy Gap:-It is describe that literacy Gap between all talukas includePorbandar
has highest rank with literacy 70.61% where askutiyana has 64.88%, and with
compare taluka wise literacy gap ranavav has lowest rate with 63.03%.they
improve this indicator and planned upto the year 2021-22 increasedliteracy gap
Every year from 2016-17 they planned to increased this Literacy Gap by 1.21%.
3. CALP Facilities for Students :-2412 Computers are provided in total 242 schools including
all talukas. They are trying to increase Computer Aided Learning Programme facilities to
the student for increase IT knowledge to students.
Year (2016-17 to 2017-18)
Sr. % of work
No. Activity Implementing Target Work Work Work completed
Scheme
Carried out Agency (Unit) Sanctioned Started Completed against
Sanctioned
1 SSA Transportation SSA 3379 3379 3379 2862 84.70
Special
2 SSA Training SSA 293 293 293 290 98.98
Program
Teachers
3 SSA SSA 2041 2041 2041 2008 98.38
Training
Intervension
4 SSA SSA 752 752 752 533 70.88
for CWSN
Additional
5 SSA Classroom GF SSA 8 8 8 3 37.50
(Civil Works)
53Additional
Classroom
6 SSA SSA 15 15 15 0 0.00
Multy (Civil
Works)
Toilet/Urinals
7 SSA for Boys (Civil SSA 3 3 3 3 100.00
Works)
Separate
8 SSA Toilet for Girls SSA 6 6 6 6 100.00
(Civil Works)
Mejor
9 SSA Repairing (Civil SSA 3 3 3 2 66.67
Works)
Furniture (Civil
10 SSA SSA 1200 1200 1200 1200 100.00
Works)
2.HEALTH :-
Gap Target* (year wise)
Sr. Taluka Indicators Current Status
No. (Unit) Year Units
2016-17 15813
1 ANC ANC registration in all Talukas has decreased 1813
All Talukas Registration over year. 2017-18 14000
District
2 Institutional Institutional Deliveries is increased from 0 2016-17 9900
Average Deliveries Previous year
3 District The IMR in the district (20) is 0 2015-16
IMR 36
Average Less than that in the state (36). 2016-17
District The IMR in the district (20) is 2015-16
4 IMR 0 36
Average Less than that in the state (36). 2016-17
District The MMR in the district (67) is 2015-16 10(No.)
5 MMR 2
Average less than the state (112) 2016-17 2(No.)
8 District Maternal Maternal Deaths are decreasing from previous 2 2015-16 10(No.)
Average Deaths year. 2016-17 2(No.)
(1) Out of 489 total ICDS Centers, 414
9 District INFRA- aregov.buildingsand 75 buildings are in rent 345 2016-17 to
STRUCTURE 345
Average buildings. 2020
541. IMR:- To improve this indicator throughout the district and set the district in better
position against the state average the C.D.H.O. has planned To minimize and cope
up with the gap by set it to 36 upto the year 2016-17 & to achieve the Millennium
Development Goal for IMR it is targeted to Less than 36 upto the year 2016-17.
2.MMR:- To improve this indicator throughout the district to achieve the
Millennium Development Goal for MMR it is targeted to Less than 2015-16 : 10
and 2upto the year 2016-17.
3.ANGANWADI INFRASTRUCTURE:- To improve this indicator in weaker
talukas the Programme officer-ICDS has planned 5 buildings for renovation, 20
buildings for upgration, 320 also for repairingthese all are target of icds construction
level.
3. Livelihood :- Agriculture,Road & Building,
Sr. Taluka Indicators Current Status Gap Target* (year wise)
No. (Unit)
Year Units
2016-17 81%
2017-18 83%
Net The Net Cropped Area (NCA) in the
DISTRICT Cropped 2018-19 82%
1. district was 85.00% of the reported area 85%
as a whole Area 2019-20 81%
(NCA) in 2010-11.
2020-21 83%
2021-22 82%
Chapter : 4 (B) Action Plans for Livelihood
Physical Achievement
Year (2016-17 to 2017-18)
% of
Sr. work
Targ
No Sector Work Work Work complet
Schem Implementi et
. Activity Carried out Sanction Starte Complet ed
e ng Agency (Unit
ed d ed against
)
Sanction
ed
Road
Budget
1 Road Resurfacing/Strength R&B K.M. 12.5 12.5 12.5 100
work
ning
55Buildi Budget Building
2 R&B Nos 10 10 4 40
ng work Construction
CHAPTER – 4 (B) :- ACTION PLAN FOR EDUCATION SECTOR
Primary Education.
Financial Allocation and Source of
Remarks
fund
Sr. Implementin
Sector Indicator Scheme Activity Allocation
No g Agency Source of
Year (Rs. in
fund
lakh)
KANYA
Enrolment of Girls District
KELAVNI & Primary
in Std.1 & Primary 2016-17 to decided at
SHALA Education Nil
distribution of Education 2021-22 state level
PRAVESHOTSA Department
VidhyaLaxmi Bonds office
V
Drop out students &
out of School SarvaSikshaA
DROP 2016 TO 17.53
1 OUT Special Training children will be bhiyan SSA Nil
2022 Per Year
RATE enroled in S.T.P. (S.S.A.)
CLASS
Training to the
members of SarvaSikshaA
2016 TO 26.61
PRIMAR TRAINING S.M.C.(School bhiyan SSA Nil
2022 Per Year
Y Management (S.S.A.)
EDUCATI
committee)
ON
KANYA
Enrolment of Girls District
KELAVNI & Primary
in Std.1 & Primary 2016-17 to decided at
SHALA Education Nil
distribution of Education 2021-22 state level
PRAVESHOTSA Department
VidhyaLaxmi Bonds office
Literacy V
2
Rate KGBV
Additional SarvaSikshaA Decided
(Kasturbaa 2016 TO
education with bhiyan At 3 KGBV
Gandhi 2022
Hostel Facilities (S.S.A.) State Level
BalikaVidyalaya)
Computer Aided State Project Decided
Infrastruct Covering 13 Upper 2016 TO 36.00
3 ure Learning Director Shri At
primary Schools 2022 Per Year
facilities Programme(SSA) – State Level
56Gandhinagar
Education Action Plan for the year 2017-18
Sr. Financial Allocation and Source of fund
Schem Implementin
Activity Allocation
e g Agency
no Year (Rs. In Source of fund
Lakh)
1 SSA Transportation SSA 2017-18 99.27 GOI + GOG
Special Training
2 SSA SSA 2017-18 16.45 GOI + GOG
Program
Teachers
3 SSA SSA 2017-18 23.37 GOI + GOG
Training
Intervension
4 SSA SSA 2017-18 19.74 GOI + GOG
for CWSN
Additional
5 SSA Classroom GF SSA 2017-18 135.04 GOI + GOG
(Civil Works)
Additional
Classroom
6 SSA SSA 2017-18 355.54 GOI + GOG
Multy (Civil
Works)
Toilet/Urinals
7 SSA for Boys (Civil SSA 2017-18 16.44 GOI + GOG
Works)
Separate Toilet
8 SSA for Girls (Civil SSA 2017-18 16.38 GOI + GOG
Works)
Mejor
9 SSA Repairing (Civil SSA 2017-18 9.94 GOI + GOG
Works)
572. Health :-
CHAPTER – 4 (B) :- ACTION PLAN OF HEALTH
2
Sr. Sector Indicator Scheme Activity Implementing Financial Allocation and Source of
No Agency fund
Year Allocatio Source of
n (Rs. in fund
lakh)
RMNCH+A & Anti Natal Services HEALTH,
Government
ANC RCH BRANCH of
2017-18 - of Gujarat
1 Registrat District
(SHS)(GOI)
ion Panchayat
JSY,JSSK,IGMS Increase in Institutional HEALTH, 41
Y, KPSY, CY, Deliveries BRANCH of
District (JSY+
108, RSBY,
Institutio Panchayat JSSK Government
RMNCH+A,
nal 2017-18
Maternal
of Gujarat
2 “KHILKHILAT
Deliverie +
(SHS)(GOI)
”
s MamtaG
har)
BSY, JSSK, For Decrease the IMR. HEALTH, 41
HEALT Government
IGMSY, KPSY, BRANCH of
HCARE 2017-18
(JSSK
of Gujarat
3 IMR MA, RMNCH+A
District
(SHS)(GOI)
Panchayat Child)
BSY, JSSK, For Decrease the IMR. HEALTH,
IGMSY, KPSY, BRANCH of
Government
District
I4MSY,MA, 2017-18 81 of Gujarat
4 IMR Panchayat
(SHS)(GOI)
RCH,
RMNCH+A
BSY, JSSK, For Decrease the MMR. HEALTH, Government
IGMSY, KPSY, BRANCH of of Gujarat
District 2017-18 81 (SHS)(GOI)
5 MMR MA, RMNCH+A
Panchayat
MALNOURISH The screening of Children HEALTH,
Malnutri Government
ED free in the age group of 0-6 BRANCH of
tion 2017-18 0.84 of Gujarat
6 District
among GUJARAT years has been carried out (SHS)(GOI)
children
58SCHEME, whether to go in Panchayat
RMNCH+A, Anganwadi or not. After
IGMSY, KPSY examining by Doctors, the
Malnourished children has
been referred to
CMTC/NRC for further
treatment. So far
…………..% of the
children has been found as
the Severe &
Moderateunderweightat
nutritional status.
IRON- Search & Identifying HEALTH,
Incidenc
SUNCROSE Pregnant women suffering BRANCH of
e of Government
District
Anemia INITIATIVE, from Anemia& treatment 2017-18 1.20 of Gujarat
7 Panchayat
among RMNCH+A, has been given to them (SHS)(GOI)
pregnant WIFS, NIPPI
women
JSY, JSSK, The monitoring is carried HEALTH,
IGMSY, KPSY, out at District level by BRANCH of
District
CY, RMNCH+A, Collectorshri at different Government
Panchayat
Maternal MATERNAL stages to reduced and 2017-18 0.30 of Gujarat
8
Deaths DEATH control the maternal deaths (SHS)(GOI)
REVIEW
MEETING
2. Health Care, Sanitation and Enviroment (Porbandar District)
Sr.No. District Indicator Current Status Target (2017-18)
Year Units
1 District Average ANC Registration Anc 2017-18 12000
Registration in
the year
2 District Average Institutional Delveries Institutional 2017-18 10,000 Deliveros
Deliveries is
increased 9900 (99%)
3 District Average IMR IMR 36 (State) 2017-18 36
4 District Average MMR MMR 112 2017-18 112
(State)
59You can also read