RAJASTHAN - HAWA MAHAL IN JAIPUR, RAJASTHAN March 2021 For updated information, please visit www.ibef.org - IBEF Presentation
←
→
Page content transcription
If your browser does not render page correctly, please read the page content below
RAJASTHAN

            HAWA MAHAL IN JAIPUR, RAJASTHAN
                                                 March 2021
               For updated information, please visit www.ibef.org
Table of Contents

        Executive Summary           3

        Introduction                4

        Economic Snapshot           9

        Physical Infrastructure     15

        Social Infrastructure       23

        Industrial Infrastructure   26

        Key Sectors                 29

        Key Procedures & Policies   36

        Appendix                    49

 2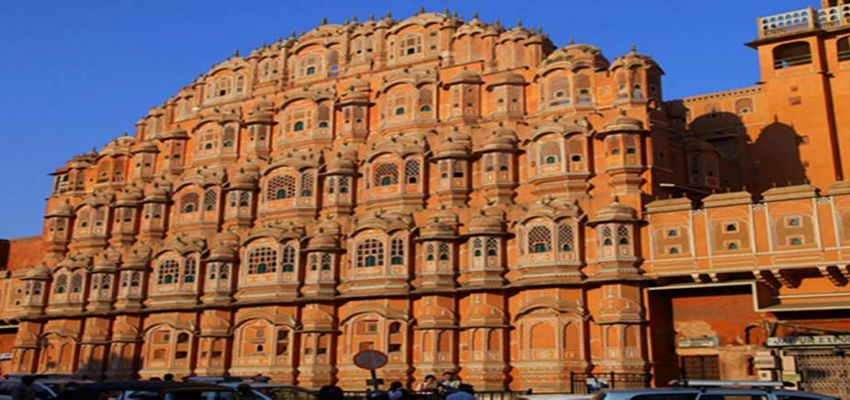
Executive summary
     1. Thriving tourism
     industry                                                                                                            6. One of the largest
     •   In 2019, tourist arrivals in the state                                                                          producers of crude oil
         reached 53.82 million. Historic palaces,                                                                        •   Rajasthan is the second largest*
         especially in Jaipur and Udaipur, offer                                                                             producer of crude oil in India, recording
         opportunities to expand the luxury                                                                                  production of approximately 7.72
         tourism segment, with increasing                                                                                    million metric tonnes (MMT) of crude
         number of tourists visiting wildlife                                                                                oil^ in FY19P, which was 22.68% of the
         sanctuaries and desert locations.                                                                                   total domestic crude oil production in
                                                                             1                          6                    the country.

     2. Leading producer of
                                                                                                                             5. Conducive policy
     agro-based products
                                                                                                                             environment
 •   Rajasthan is the second largest
     producer of oilseeds and largest                                                                                    •   The policy environment has been
     producer of coarse cereals in India, as
     of FY19. Tremendous opportunities
                                                               2                                                     5       favourable for the establishment of
                                                                                                                             industrial units. A Single Window
     exist in the areas of organic and                                                                                       Clearance System        (SWCS) for
     contract farming as well as in                                                                                          investment approvals is operational in
     infrastructure developments related to                                                                                  the state and the Bureau of Investment
     agriculture.                                                                                                            Promotion (BIP) was set up to focus
                                                                                                                             on investments above US$ 2.2 million.

     3. Focus on renewable                                                   3                          4
     energy                                                                                                              4. Strong economic
 •   The state has immense potential for electricity                                                                     growth
     generation through renewable energy sources and
                                                                                                                         Rajasthan’s Gross State Domestic
     wind    power.   Rajasthan     Renewable    Energy
                                                                                                                         Product (GSDP) increased at a CAGR
     Corporation Ltd has actively promoted solar energy
                                                                                                                         (in Rs.) of 7.05% between 2015-16 and
     and biomass projects.
                                                                                                                         2020-21.

 Note: 2nd largest * - After Offshore production, ^does not include condensate, E- Estimate, P - Provisional
 Source: Bureau of Investment Promotion, Ministry of Tourism, Rajasthan Economic Survey, Central Statistics Office

 3
INTRODUCTION

4

Rajasthan Fact File

                                                               Jaipur
                                                                 Capital            200 persons per sq km                       78.9 million
                                                                                        Population density                     total population

                                                                342,239 sq.km.
                                                                 geographical area           33.0 million                    35.6 million
                                                                                           female population                male population

                                                                                                                                    928
                                                                                                                                  Sex ratio
                                                                 66.1%             administrative districts:    33      (females per 1,000 males)
                                                                literacy rate
     Key Insights

     • Rajasthan is the largest state, by area, in India, is situated in the north-western part of the subcontinent. It is surrounded on the north and north-
       east by Punjab, Haryana and Uttar Pradesh; on the east and south-east by Uttar Pradesh and Madhya Pradesh and on the south-west by Gujarat.
     • Jaisalmer, Udaipur, Jodhpur, Ajmer, Bikaner, Alwar, Amber and Chittorgarh are some of the key cities and towns in the state.
     • The most commonly spoken language of the state is Hindi. Marwari, Jaipuri (Dhundhari), Mewari and Malvi are the other dialects popular in the
       state. English is the medium of education in most schools

 Source: Economic Review of Rajasthan 2017-18, Census 2011

 5
Advantage – Rajasthan
Rich labour pool and
High economic growth and stable infrastructure support
political environment
Rajasthan has been investing in capacity building through
GSDP increased at a CAGR (in Rs.) of the development of a strong institutional network at all
7.05% between 2015-16 and 2020-21. levels. The state has renowned higher education
institutions in various disciplines, producing thousands of
With a stable political environment, the
skilled and proficient young individuals every year.
Government is committed towards creating
a progressive business environment. The state is developing sector specific infrastructure, such
as special purpose industrial parks and special
economic zones (SEZs) for exports of
handicrafts, IT and electronic goods
Abundant mineral resources
and
location advantage
Policy and incentives
Rajasthan offers a variety of
unexploited agricultural and The state offers a wide range of
mineral resources, which is fiscal and policy incentives for
indicative of the scope for value businesses. The Government has
addition and exports. introduced sector-specific policies
for tourism, biotechnology, IT and
It borders six major states in the ITeS industries.
northern, western and central
parts of India. Rajasthan is a Rajasthan has a favourable
natural corridor between the industrial relations environment. In
wealthy northern and the addition, the law & order situation in
prosperous western states, the state ensures a good working
making it an important trade and environment.
commerce centre.
Source: Ministry of Statistics and Programme Implementation, News articles
6
Vision – 2022
1 Governance 7 Economy
Minimum education & work
To promote region wide economic
experience must for politicians.
To provide more freedom to 1 7 balance.
To develop efficient economic
bureaucrats.
infrastructure.
Fair & advanced taxation system.
To promote SMEs and develop
Self-disciplined media.
6 special zones.
2 Infrastructure 2
6 Agriculture
To develop good quality roads.
5
To create network of canals.
Proper traffic management
systems. To develop five international level
3
research labs.
To develop & maintain special
economic and technological To address soil fertility & reduce
infrastructure.
To develop appropriate water
4 use of fertilisers.
To achieve leadership in animal
policy. husbandry & livestock businesses.
5 Education
3 Community 4 Human development Compulsory education up to 10th
Poverty elimination and employment standard.
To develop a coherent social opportunities for all. To promote privatisation.
environment.
A comprehensive Economic Inclusion To support higher education and
To execute poverty elimination Policy to be developed. research.
plans.
A well-defined healthcare system. To provide computer literacy.
To increase interaction within
Utilise services & expertise of NGOs.
community.
Source: Confederation of Indian Industry
7
Rajasthan in figures

     Rajasthan’s Contribution to Indian Economy (2019-20)                                       Physical Infrastructure in Rajasthan’s

 GSDP      GSDP as a percentage of all states’ GSDP                                                      Installed power capacity (MW) (as of February
           India: 100.00 | Rajasthan: 4.82
                                                                                                         2021)
                                                                                                        India: 379,130.41 | Rajasthan : 25,740.90
           GSDP growth rate** (%)
           India: 7.53 | Rajasthan : 10.71
                                                                                                         Wireless subscribers (million) (as of September 2020)
           Per capita GSDP* (US$)                                                                       India: 1,148.58 | Rajasthan : 65.16
           India: 1,982.65| Rajasthan :1,868.35
                                                                                                        Internet subscribers (million) (as of September
                                                                                                        2020)
     Social Indicators                                                                                  India: 776.45 | Rajasthan : 43.36

           Literacy rate (%)                                                                             National highway length (kms) (as of December 2020)
           India: 73.0 | Rajasthan : 66.1                                                                India: 136,440 | Rajasthan : 10,350.12

           Birth rate (per 1,000 population) (2018)                                                      Airport (No.)
           India: 20.4 | Rajasthan : 24.3
                                                                                                        India: 125 | Rajasthan : 7
     Industrial Infrastructure
           Operational PPP projects (No.) (November                                              Investments (as of December 2020)
           2019 )
           India: 1824 | Rajasthan : 175                                                                Cumulative FDI equity inflows (from October
           Operational SEZs (No.)                                                                       2019 to December 2020) (US$ million)
           (February 2020)                                                                                India: 75,351.56 | Rajasthan : 345.52
            India: 240 | Rajasthan : 3

  Note: GSDP, per capita GSDP figures are for 2017-18 taken at current prices, Conversion rate: 64.45, For source refer to Annexure, ** - year-over-year, MW- megawatt, FDI- Foreign
  direct investment, MN- Million

 8
ECONOMIC SNAPSHOT

9
Economic Snapshot – GSDP
Rajasthan’s GSDP at current prices GSDP per capita of Rajasthan at current prices
CAGR (in Rs.) 7.05% CAGR (in Rs.) 5.47%
160 12 2,000 140,000
140 1,800
128,318.64
120,000
1,820.38
10
141.72
121,468.41
1,716.35
119,955.91
1,600
1,695.43
9.99
1,673.35
131.96
131.89
120
128.57
9.58
109,270.17
9.22
100,000
1,526.64
1,400
102,422.20
8
113.37
1,422.14
8.29
100
93,093.58
104.11
1,200
7.61
80,000
6.81
80 6 1,000
60,000
60 800
4
600 40,000
40
2 400
20 20,000
200
0 0 0 -
2015-16
2016-17
2017-18
2018-19
2019-20
2020-21
2015-16
2016-17
2017-18
2018-19
2019-20
2020-21
US$ billion Rs trillion US$ Rs
At current prices, Rajasthan’s GSDP stood at US$ 131.96 billion In 2020-21, Rajasthan’s per capita GSDP at current prices was
in 2020-21. US$ 1,673.35.
Between 2015-16 and 2020-21, the GSDP of Rajasthan Per capita GSDP was estimated to increase at a CAGR (in Rs.)
increased at a CAGR (in Rs.) of 7.05%. of 5.47% between 2015-16 and 2020-21.
Source: MOSPI
10Economic Snapshot – NSDP
Rajasthan’s NSDP at current prices NSDP per capita of Rajasthan at current prices
CAGR (in Rs.) 7.15%
CAGR (in Rs.) 5.57%
140 10 1,800 140,000.0
9 1,600
120
127.56
120,000.0
1,638.42
8.99
8.63
1,543.71
8
118.84
118.62
1,523.48
1,506.91
1,400
8.29
115.53
115,492.41
109,386.46
100
107,889.77
100,000.0
1,370.16
7
7.45
101.75
1,200
1,274.46
98,188.44
6.83
93.30
6
91,923.80
80 80,000.0
6.11
1,000
83,426.15
5
60 800 60,000.0
4
600
40 3 40,000.0
2 400
20 20,000.0
1 200
0 0 0 -
2015-16
2016-17
2017-18
2018-19
2019-20
2020-21
2015-16
2016-17
2017-18
2018-19
2019-20
2020-21
US$ billion Rs trillion US$ Rs
At current prices, the Net State Domestic Product (NSDP) In 2020-21, Rajasthan’s per capita NSDP at current prices
stood at US$ 118.84 billion in 2020-21. stood at US$ 1,506.91.
Between 2015-16 and 2020-21, the NSDP increased at a Per capita NSDP was estimated to increase at a CAGR (in Rs.)
CAGR (in Rs.) of 7.15%. of 5.57% between 2015-16 and 2020-21.
Source: MOSPI
11Economic snapshot – Percentage distribution of GSDP
At a CAGR (in Rs.) of 10.86% between 2011-12 and 2020-21, the GSVA composition by sector
tertiary sector has been the fastest-growing sector and the largest
contributor to Rajasthan’s economy in 2020-21, with a 45.44% share
100%
in the state’s GSVA. The growth was driven by storage, 38.75% CAGR* 45.44%
communication & services related to broadcasting, financial services 90%
and public administration.
80% 10.86%
The primary sector contributed 33.91% to Rajasthan’s GSVA in
2020-21 and increased at 9.25% CAGR between 2011-12 and 2020- 70%
21. The secondary sector grew at a 5.18% CAGR in the same period
and contributed 20.65% in 2020-21. 60%
28.27%
50% 20.65%
40%
5.18%
30% 32.98% 33.91%
20%
10%
9.25%
0%
2011-12 2020-21
Primary Secondary Tertiary
Note: *in Rs. terms
Source: MOSPI
12Economic snapshot – FDI inflow & investments
Investment Intentions filed in Rajasthan
FDI inflow in Rajasthan in April 2000-March 2020 (US$ million)
Proposed Investments
Year Number
2,500 (US$ million)
2,151
103
363 88
2,000 2015 76 1,070.04
117
165
1,500 541 51
2016 97 871.21
1,000
132 38
520
33
500 2017 99 1,113.64
0
2018 92 5,489.40
FY12
FY13
FY14
FY15
FY16
FY17
FY18
FY19
FY20
FY00-FY21*
FY00-FY11
FY21*
2019 100 1,446.27
According to the Department for Promotion of Industry and Internal Trade (DPIIT), Foreign Direct Investment (FDI) inflows in the state stood at
US$ 345.52 million between October 2019 and December 2020.
During 2019, 100 investment intentions were filed in the state with total investment of Rs. 10,108 crore (US$ 1.45 billion).
Note: *-until September 2020
Source: Department for Promotion of Industry and Internal Trade
13Economic snapshot – Export trends
Merchandise Export from Rajasthan (US$ billion) Major Commodities Exported in FY21*
8.00 Plywood &
Allied
7.00 Product
7.06 8%
6.95
6.00 6.63 7%
6.09 Granite,
5.77 Natural
5.00 5% Stone &
5.24 5.21
Product
4.00 5%
Zinc &
3.00 4% Product
3% Made of
2.00 64%
3% Zinc
1.00 Man Made
Yarn &
0.00 Fabrics
FY15 FY16 FY17 FY18 FY19 FY20 FY21*
Total merchandise exports from Rajasthan stood at ~US$ 6.63 billion in FY20 and US$ 5.21 billion in 2020-21*.
Plywood & allied products, granite, natural stones & products, zinc & products made of zinc and man-made yarn & fabrics accounted for a majority
share in the overall exports from the state.
In 2020-21*, total exports of plywood & allied products from Rajasthan stood at US$ 418.07 million (~8%).
Note: *- Until January 2021
Source: DGCIS Analytics
14PHYSICAL INFRASTRUCTURE 15
Physical infrastructure – Roads
As of March 2019, Rajasthan had 10,342 km of national highways. Road length (km)
Road type
as of March 2019
As on 31 March 2019, state has a total road length of 2,64,244.05
National highways 9,079.10
km. The road density in the state is 77.21 km per 100 sq. km.
whereas national road density is 143.08 km per 100 sq. km. State highways 15,543.60
As per the State Budget 2021-22, Rs. 1,400 crore (US$ 193.48 Major district roads 8,802.20
million) has been allocated for Pradhan Mantri Gram Sadak Yojana.
Other district roads 32,175.41
In December 2020, the Union Minister for Road Transport and
Highways laid the foundation stones for 18 highway projects worth Village roads 1,70,971.96
Rs. 8,341 crore (US$ 1,129 million). These projects include a road
Total 2,64,244.05
length of ~1,127 kilometres, which will enhance better connectivity,
convenience and economic growth in the state.
Road work completion under PMGSY
In year 2018-19, 50 State Highways, 39 District Roads, 15 Urban
Roads and 1,783 Rural Roads have been sanctioned. Year Road works (No)
On December 22, 2020, the Government of India and the World 2014-15 1,107
Bank signed a US$ 500-million project to construct environment- 2015-16 939
friendly national highway corridors in Rajasthan, Himachal Pradesh,
Uttar Pradesh and Andhra Pradesh. 2016-17 252
2017-18 1,501
2018-19 2,581
Source: NHAI (National Highways Authority of India, Statistics Rajasthan Government, Rajasthan Economic Survey, Rajasthan Budget 2021-22
16Physical infrastructure – Railways
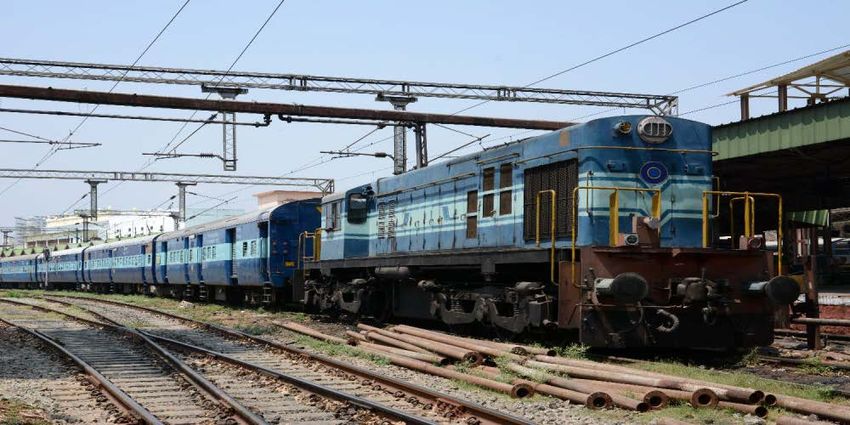
As of March 2019, Rajasthan has a total railway network spanning
5,937 km. The railway length in state is 8.66% of all India route
length of 68,442 km.
As per the State Budget 2021-22, the state government allocated Rs.
4,986 crore (US$ 689.08 million) for railway projects.
In January 2021, Prime Minister Mr. Narendra Modi inaugurated the
306-kilometer Rewari (Haryana) – Madar (Rajasthan) section of the
Western Dedicated Freight Corridor.
The Government of Rajasthan has undertaken the development of a
Metro Rail Urban Transport Project in Jaipur.
• Phase-1-A (Mansarovar to Chandpole - 12.1 km): In 2010, JMRC
entered into an agreement with DMRC for Phase-1-A
development on deposit work basis, encompassing 9.7 km. Work Source: Maps of India
of Phase 1A has been completed. The average daily ridership for
the first 46 months (June 2015 to March 2019) was 20,653.
• Phase-1-B (Chandpole to Badi Chaupar): Comprises
underground metro for 2.44 km and 2 stations. Construction work
of the 2 stations is under progress.
• Phase II (Ambabari to Sitapura - 23.1 km): Phase II is proposed to
be developed on a PPP model.
Source: State Economic Survey, News Articles
17Physical infrastructure – Airports … (1/2)
Domestic airports are located at Jodhpur, Udaipur, Jaisalmer,
Kishangarh, Kota and Bikaner. The Airports Authority of India
plans to operate civil airports in Jaisalmer, Jodhpur and
Bikaner. An international airport is located at Jaipur.
AAI further plans to open an airport at Sawai Madhopur. An
air cargo complex at Jaipur, and Inland Container Depots
(ICDs) at Jaipur, Jodhpur, Bhilwara and Bhiwadi facilitate
trade within and outside India.
The airport at Jaipur has received the first rank among global
airports in the Best Airport in the World in 2 to 5 million
International airport
passenger category of Airport Service Quality (ASQ) awards
by Airports Council International (ACI) for the year 2017.
Domestic airport
In August 2020, Airport Authority of India (AAI) approved the
proposal to lease out Jaipur airport to Adani Enterprises for
50 years.
Source: Airports Authority of India
18Physical infrastructure – Airports … (2/2)
Airport Indicators (from April 2020 to January 2021)
Rajasthan Airport Statistics
Aircraft movements Passengers Freight
(in no) (in no.) (in MT)
Airport
2019-20 2020-21 2019-20 2020-21 2019-20 2020-21
Jaipur 33,573 13,783 4,305,506 1,283,942 15,424 9,609
Udaipur 9,001 2,667 1,043,736 255,628 5 3
Jodhpur 3,330 1,214 425,707 185,683 1 0
Source: Airports Authority of India
19Physical infrastructure – Power
Transmission network in the state ( in Ckt. Km)
Installed power capacity (GW)
2019-20
30 Voltage\Year 2016-17 2017-18 2018-19 (until Dec
25 2019)
25.74
25.36
20 765 KV 425.5 425.5 425.50 0
22.59
21.02
19.78
15
10 400 KV 4275.33 5640.73 7317.00 287.54
5
220 KV 14500.47 15130.05 15350 .00 92.44
0
FY17
FY18
FY19
FY20
FY21*
132 KV 16771.05 17189.29 18012.00 224.39
Total 35972.35 38385.57 41104 .50 604.37
As of February 2021, Rajasthan had a total installed power-generation capacity of 25,740.90 MW, of which 3,792.60 MW was under the central
sector, state utilities (8,230.65 MW) and private sector (13,717.65 MW). Of the total installed power-generation capacity, 13,300.47 MW was
contributed by thermal, 1,939.19 MW by hydro and 9,944.50 MW by renewable energy.
In January 2021, Sembcorp Energy India (SEIL), a wholly owned subsidiary of Sembcorp Industries, won the contract for a new 400 MW solar
power project in Rajasthan. The commercial operations of the project are expected to be rolled out by mid 2022.
In January 2021, under tariff-based competitive bidding, Power Grid Corporation of India Ltd. (PGCIL) won two electricity transmission projects in
Rajasthan.
In January 2021, L&T Hydrocarbon Engineering won an order worth >Rs. 7,000 crore (US$ 965.40 million) from HPCL Rajasthan Refinery.
Note: *- Until February 2021, Ckt Km - circuit kilometre, GW- Gigawatt, MW- Megawatt
Source: Central Electricity Authority
20Physical infrastructure – Telecom
Telecom Infrastructure (as of September 2020)
Wireless subscribers (million) 65.16
Wireline subscribers (million) 0.47 Performance status of Bharat Net Project
Service-ready GPs (November 2020) 8,903
Internet subscribers (million) 43.36
Teledensity (in %) 83.23
As of September 2020, Rajasthan had 65.16 million wireless and Major telecom operators in Rajasthan
0.47 wireline subscribers. Bharat Sanchar Nigam Limited (BSNL)
The number of internet subscribers in the state stood at 43.36 Bharti Airtel
million, as of September 2020.
Vodafone Idea
Rajasthan had a total teledensity of 83.23%, as of September 2020.
Reliance Jio
Source: Telecom Regulatory Authority of India
21Physical infrastructure – Urban
Four cities of Rajasthan viz. Ajmer, Udaipur, Kota and Jaipur have Cities Population Literacy Rate
been selected under the Smart Cities Mission of Government of
Ajmer 2,583,052 69.33%
India.
Udaipur 3,068,420 61.82%
Under Atal Mission for Rejuvenation and Urban Transformation
(AMRUT), twenty-nine cities have been selected from the state. Kota 1,951,014 76.56%
Jaipur 6,626,178 75.51%
The State Government has undertaken Rajasthan Urban
Infrastructure Development Project (RUIDP) with the financial
assistance of Asian Development Bank (ADB), in order to provide
quality infrastructural facilities.
Phase-III (Newly approved Project) - with loan assistance from ADB,
Government of Rajasthan (GoR) approved the RUSDIP-RUIDP
Phase III. This program will complement the past and ongoing efforts
of GoR in order to improve water supply, sewerage, sanitation to the
residents of the selected cities in Rajasthan. The total cost of the
project is Rs. 3,653.25 crore (US$ 566.83 million).
As of August 2018, under Smart City Mission, 140 projects have
been completed or are under implementation in the state.
Up to March 2019, 10.55 lakh LED lights have been setup in
Rajasthan under energy saving Project.
Source: Rajasthan Urban Infrastructure Development Project, Government of Rajasthan
22SOCIAL INFRASTRUCTURE 23
Social infrastructure – Education
Rajasthan’s education statistics (2019-20)
Primary: 35,235
Schools (No.) Upper primary: 19,769
Secondary/senior secondary: 14,898
Colleges (No.) 1,963
Government sanctioned: 229
ITIs (No.)
Private sector: 1,716
Functional engineering colleges 98
Functional MBA institutions 58
The state has a literacy rate of 66.1% the male literacy rate is 80.5% and the female literacy rate is 52.7%.
The state’s school infrastructure consists of primary (35,235), upper primary (19,769) and secondary/sr. secondary (14,898).
In total, the state had 1,963 colleges including 275 government colleges, 15 government law colleges, 1,660 private colleges, 7 self-financed
institutions and 6 colleges established with private partnerships.
As of 2019-20, the government sanctioned 38 new government colleges and established employment centers under ‘Youth Development Cell’ in
all government colleges.
The state has ~136 polytechnics with an intake capacity of 29,996 students.
In the Union Budget 2021-22, Rajasthan allocated 19.1% of its total expenditure for education in FY22, higher than the average allocation (15.8%)
for education by all states.
Under the State Budget 2021-22, Rs. 44,309 crore (US$ 6.12 billion) was allocated for the education, sports, arts and culture sectors.
Source: Economic Review of Rajasthan 2019-2020, Rajasthan Budget 2021-22
24Social infrastructure – Health
Health indicators (SRS Bulletin 2018) Health indicators (2016-18)
Population served per hospital bed 1,451 Community health centres 664
1
Birth rate 24.0 Primary health centres 2,866
1
Death rate 6.1 Sub-Centres 14,575
2
Infant mortality rate 37
Sub District Hospitals 365
Life expectancy at birth (year) District hospitals 36
Male (2016-20) 68.6 Total 18,526
Female (2016-20) 71.9
Rajasthan has a 3-tier health infrastructure comprising primary health centres, health units, community health centres & sub-centres
A number of initiatives such as the Chief Minister’s ‘Jeevan Raksha Scheme’ & the World Bank-assisted Rajasthan Health System Development
Project have been taken up to improve healthcare facilities in the state.
A total of 18,816 AYUSH doctors and 43,388 doctors having medical qualification were registered, as on 2018-end.
As of May 2020, the state had 664 community health centres, 2,866 primary health centres and 14,575 sub-centres.
In the Union Budget 2021-22, Rajasthan allocated 7% of its total expenditure on health, higher than the average allocation for health by other
states (5.5%).
In January 2021, Rajasthan State Health Assurance Agency signed an MoU with the New India Assurance Agency to start Ayushman-Bharat
Mahatma Gandhi Rajasthan Swastya Bima Yojana scheme in the state. ~Rs. 1,750 crore (US$ 241.85 million) per annum will be expended
towards the scheme and the state plans to bear 79% of the cost.
Note: 1Per thousand persons, 2Per thousand live births,
Source: Economic Review of Rajasthan 2018-19, Sample Registration System (SRS)
25INDUSTRIAL INFRASTRUCTURE 26
Industrial infrastructure …(1/2)
Bureau of Investment Promotion (BIP) and Rajasthan Industrial
Industrial Corridors in Rajasthan
Development and Investment Corporation (RIICO) are responsible
for promoting investments and developing industrial infrastructure in
the state.
The Government of Rajasthan is promoting the development of
several SEZs across the state for sectors such as gems and
jewellery, handicrafts, IT, electronics, automotive/auto components
and textiles.
The Rajasthan Industrial Infrastructure Corporation (RIICO) has been
assigned the responsibility of setting up industrial areas in the state.
The organisation also provides loans for small, medium and large-
scale projects.
Rajasthan will soon host several development projects in textile,
defence and aviation sectors. In September 2020, the state
government entered an understanding with SVP International Group
for an investment of Rs. 4,000 crore (US$ 541.57 million) for
development of facilities related to these sectors.
In January 2021, Okinawa Autotech announced plan to invest Rs.
150 crore (US$ 20.73 million) to set up a new factory in Rajasthan.
In the Union Budget 2021-22, the government announced to
establish a fintech city in Jaipur. The project is estimated at ~Rs. 106
crore (US$ 14.65 million) and is expected to be rolled out in FY22.
Source: State Budget 2021-22, IEM: Industrial Entrepreneurs Memorandum, Invest India, SEZ: Special Economic Zone
27Industrial infrastructure …(2/2)
Start-up initiatives
iStart Initiative
• In November 2017, the state Government launched a dedicated platform for startups called iStart. to facilitate entrepreneurship and job
creation in the state.
• The aim of this initiative is to assist anyone with an entrepreneurial aspiration to take their concepts and business to the next level - be it at
idea/concept stage or MVP or early-growth stage startups.
• The platform will work on the “access-improve-access” model. Startups will undergo mentoring programs and customised & group skill building
to focus on areas that need to be improved.
• Applyifi will provide entrepreneurs and investors a detailed assessment report and a 36-point score card on the startup’s potential and
investment worthiness.
• A one-month skill-building programme will be organised for startups and startups graduating from the programme will be offered opportunities
to pitch their ideas for investments to the state Government.
• iStart will also focus on building a digital infrastructure in the form of a set of APIs that the Government, startups, developers and businesses
can utilise for solving problems faced by them.
• A quarterly ‘Start-up Showcase Yatra’ will be organised in Mumbai, Delhi-NCR and Bengaluru to offer startups exposure to key investors and
enablers of the startup ecosystem.
In August 2018, the state Government inaugurated Bhamashah Techno Hub, India’s biggest incubation centre, in Jaipur. The state-of-the-art
facility is spread over 100,000 sq ft and is expected to house over 700 start-ups. Start-ups operating from the centre will receive various facilities
including mentoring, funding, logistics and office space.
Department for Promotion of Industry and Internal Trade (DPIIT) has recognized 800 start-ups, as on February 01, 2020.
Source: iStart website, startup2day, News Articles
28KEY SECTORS 29
Key sector – Agriculture and allied industries
The state has an agricultural economy with nine agro-climatic zones Agricultural production (‘000 tonnes)
and various types of soil that help during the cultivation of crops.
Crop Estimated annual production in 2019-20
Food grain production was estimated to have reached 24.98 million
tonnes in 2019-20. Production of cereals was estimated at 20.49 Cereals 20,498
million tonnes, while that of pulses at 4.49 million tonnes during this
Pulses 4490
period.
Cotton, which is an important cash crop, is primarily grown in Oil Seeds 6,579
Ganganagar and Hanumangarh districts. Production is estimated at
Sugarcane 250
2.64 million bales in 2019-20.
As per the State Budget 2021-22, an estimated outlay of Rs. 11,810 Cotton (lint) 2,664
crore (US$ 1.63 billion) was made for agriculture and allied activities.
Source: Ministry of Agriculture, Rajasthan Budget 2021-22, Rajasthan Economic Survey
30Key sector – Tourism
Tourist arrivals in Rajasthan (in million)
Developers and investors are offered attractive investment
opportunities through the state’s popular tourist attractions that
include historic cities (Jaipur, Udaipur), wildlife sanctuaries 60 1.60
1.75
50 1.61
(Sariska, Ranthambore) and deserts (Jodhpur, Jaisalmer). 1.51
52.22
50.24
40
45.92
In 2019, 52.22 million domestic tourists and 1.60 million foreign
41.50
30
tourists visited Rajasthan.
20
The state runs famous luxury tourist trains such as Royal 10
Rajasthan on Wheels and Palace on Wheels, which connect
0
some of Rajasthan’s important tourist destinations to other
2016
2017
2018
2019
states.
As per State Budget 2021-22, Rs. 500 crore (US$ 69.10 million) Domestic Foreign
was allocated for the tourism department.
In a bid to develop cultural tourism hubs, UNESCO and
Rajasthan Tourism decided to develop 10 cultural tourism hubs Key Hotels
in various districts, including Jaisalmer, Jodhpur, Bikaner and
Rambagh Palace Radisson Blu
Barmer. These hubs will be adopting the ‘Art of Life’
methodology and help 884 Rajasthani performing artists and 594 Rajvilas Le Meridien
handicraft artists. Udaivilas
Fairmont
ITC-Sheraton
The Oberoi
Holiday Inn
Source: Ministry of tourism, Government of India, Rajasthan Budget 2021-22
31Key sector – Mining and mineral processing …(1/2)
Exports of Zinc and Products Made of Zinc from Rajasthan Mineral production in the state of Rajasthan
(US$ million)
600.00 April-May April-May
Mineral Unit
2019 2020
500.00
481.67
Lead & Zinc Ore Tonnes 2,330,337 1,888,564
400.00
Copper ore Tonnes 21,8117 35,756
300.00
278.57 Phosphorite Tonnes 181,135 106,322
273.34
200.00 243.00
201.29 Silver Kg 107,260 60,450
100.00
Thousand
Lignite 1,057 978
tonnes
0.00
FY17 FY18 FY19 FY20 FY21 (until Manganese Ore Tonnes 2,680 1,120
January
2021) Thousand
Iron ore 189 45
tonnes
Rajasthan is among the largest mineral-producing states in India. Around 81 varieties of minerals are available in the state and 57 minerals are
produced on a commercial scale.
It also contributes significantly to production of dimensional and decorative stones, such as marble, sandstone, and granite etc.
In May 2020, value of all minerals produced^ in the state stood at Rs. 990 crore (US$ 136.82 million).
In January 2021, Mineral Exploration Corporation Limited (MECL), Rajasthan State Mines & Minerals Limited (RSMML) and the Department of
Mines & Geology (DMG), Govt. of Rajasthan, signed a tripartite agreement to facilitate feasibility analysis for solution mining of potash in the state.
Note: , ^Excluding Fuel, Atomic and Minor Minerals
Source: Indian Bureau of Mines, Ministry of Mines, Government of India
32Key sector – Mining and mineral processing …(2/2)
Key players in mining and mineral processing industry
HZL is a part of the Vedanta Resources Group and has four mines in Rajasthan. Rampura Agucha mine is a zinc
mine with annual ore production capacity of 6.15 million tonnes per annum (MTPA).
Sindesar Khurd mine has reserves and a resource base of 85.0 million tonnes. Sindesar Khurd has annual ore
production capacity of 2 MTPA.
Hindustan Zinc Ltd
(HZL) The Zawar mine has a reserves and resources base of 76.4 MT, with ore production capacity of 1.2 MTPA.
Hindustan Copper Limited is a public sector undertaking under the administrative control of the Ministry of Mines. It
is a vertically integrated copper producing company, with facilities of mining, beneficiation, smelting, refining and
casting of refined copper metal into downstream-saleable products. HCL has four operating units of mines and
Hindustan Copper Ltd plants, one of which is the Khetri Copper Complex (KCC) at Khetrinagar in Rajasthan.
RSMML is a public sector enterprise of the Government of Rajasthan, primarily engaged in mining and marketing
of industrial minerals. The company has various Strategic Business Units (SBUs) in Rajasthan. The rock
Rajasthan State Mines phosphate SBU is located at Udaipur, gypsum SBU at Bikaner, limestone SBU at Jodhpur and lignite SBU at
and Minerals Limited Jaipur.
(RSMML)
Liberty Whiteware Limited has a sanitary-ware unit, located at Neemrana in Rajasthan.
The company has an annual production capacity of 500,000 pieces.
Company is engaged in the production of bathroom products includes shower trays, wash basins and sinks.
Liberty Whiteware Ltd
33Key sector – Cement … (1/2)
The state is the leading producer of cement grade limestone in India. Limestone production (in million tonnes)
Production of limestone reached 5.03 million tonnes in April-May
2020.
14
The state has about 26% share in proven limestone reserves in the
12 12.80
country.^
10
Ultratech Cement is setting up a 3.5 million tonnes per annum
(MTPA) greenfield integrated cement plant in Rajasthan with an 8
investment of Rs. 1,850 crore (US$ 287.76 million). 6
In August 2019, Wonder Cement announced set up of its third 4 5.03
cement plant at Nimbahera in Rajasthan’s Chittorgarh district. 2
0
April-May 2019 April-May 2020
Key players
ACC
Ambuja Cement
Grasim Industries
Shree Cement
Ultratech Cement
Note: ^proven limestone reserves - STD111,
Source: Indian Bureau of Mines
34Key sector – Cement … (2/2)
Key players in cement industry
ACC is the largest cement producer in India; its plant at Lakheri (Bundi), Rajasthan, has a production capacity of
1.5 MTPA. The company is also one of the largest manufacturers of ready-mix concrete in India.
ACC Ltd
Ambuja Cements Limited has cement plants in Rajasthan, Maharashtra, Gujarat, Himachal Pradesh, Punjab,
Chhattisgarh, Uttar Pradesh and West Bengal.
The production facility in Rajasthan has a capacity of 2.8 MTPA. The company has an integrated cement plant at
Ambuja Cements Ltd Rabriyawas, District Pali, Rajasthan.
Shree Cement is the largest cement manufacturer in North India and among the top six cement manufacturing
groups in the country. The company sells cement under the brands of Shree Ultra, Bangur and Rockstrong.
Shree Cement has manufacturing plants at Beawar, Ras, Khushkhera, Suratgarh and Jaipur in Rajasthan.
Shree Cement
Grasim Industries Limited is a flagship company of the Aditya Birla Group.
Grasim’s subsidiary UltraTech Cement has 20 integrated plants, 26 grinding units, seven bulk terminals, one
clinkerisation plant and 101 ready-mix concrete plants across India, the UAE, Bahrain, Bangladesh and Sri Lanka.
UltraTech Cement has a capacity of 102.75 MTPA. The company has plants at Kotputli and Shambhupura in
Grasim Industries Ltd
Rajasthan.
35KEY PROCEDURES AND POLICIES 36
Single – Window approval mechanism
Rajasthan’s Single Window Clearance System (SWCS) is a single point of contact to reduce the time and efforts involved in various clearances
and approvals of layouts/applications for the proposed investment submitted by investors. This online application shall render transparency to the
system, thereby facilitating investors with expeditious and time-bound clearances and approvals.
This system has come into effect from 1 April 2011 in all the districts of the state.
Application through SWCS is mandatory for all projects involving investments above US$ 165,893.
This system will grant permissions, invoking and using clearance mechanism, in case of failure of the original competent authorities to decide on
application within the specified time. This system will serve as a single point interface between investors and various Government departments.
SWCS will provide an electronic-based transparent system for online tracking of application/forms and also keep entrepreneurs updated on
information relating to relevant rules, regulations, orders, policy initiatives and schemes for guidance.
With the introduction of the Single Window Ordinance/Act and Single Window Clearance Portal, setting up and operationalising projects and
investment proposals in the state is expected to become a speedy, uninterrupted and hassle-free process.
Investor also has the right to appeal against the decision of rejection by the Department before the State Empowered Committee.
37Key investment promotion offices … (1/3)
Agency Description Contact information
BIP is a nodal agency of the Government of Rajasthan that facilitates
investments in various sectors in the state. It provides one stop
service, mainly for large projects, by acting as an interface between
entrepreneurs and the Government.
Role of BIP in Rajasthan:
Udyog Bhawan, Tilak Marg
• Identifying investment opportunities.
Jaipur - 302005, Rajasthan
• Providing access to information that is critical for setting up of
Phone: 91-141-2227 274, 2227 812, 2227
Bureau of Investment projects.
713
Promotion (BIP) • Assisting translation of investment possibilities into concrete
Fax: 91-141- 2227 506
investment proposals.
E-mail: bip.raj@nic.in
• Nodal agency for single-window clearances.
Website: http://resurgent.rajasthan.gov.in/
• Facilitation on behalf of investors with all Government
departments /agencies to ensure that proposals get immediate
attention.
• Assisting in site selection and obtaining infrastructural facilities.
• Interfacing with Government departments for required clearances.
38Key investment promotion offices … (2/3)
Agency Description Contact information
RIICO is the sole agency in the state that develops land for industrial
growth. It provides financial assistance and other vital infrastructural
facilities for industries.
Role of RIICO:
• Identifying investment opportunities.
• Providing access to information that is critical for setting up of Udyog Bhawan, Tilak Marg
Rajasthan State projects.
Jaipur, Rajasthan
Industrial Development • Assisting translation of investment possibilities into concrete
Phone: 91-141-5113 201 / 222 7751-55
and Investment investment proposals.
Corporation (RIICO) E-mail: riico@riico.co.in
• Nodal agency for single-window clearances.
Website: http://www.riico.co.in/
• Facilitation on behalf of investors with all Government
departments /agencies to ensure that proposals get immediate
attention.
• Assisting in site selection and obtaining infrastructural facilities.
• Interfacing with Government departments for required
clearances.
39Key investment promotion offices … (3/3)
Agency Description Contact information
Udyog Bhawan, Tilak Marg
Jaipur - 302005, Rajasthan
RFC provides medium- and long-term loans for new industrial units in Phone: 91-141-2385 522
Rajasthan Financial
the SME sector. It also assists in planning a balanced development of Fax: 91-141-2385 503
Corporation (RFC)
industries in the state.
E-mail: info@rfc.rajasthan.gov.in
Website:
http://rfcapp.industries.rajasthan.gov.in/
First Floor, LIC Jeevan Nidhi Building
Near Ambedkar Circle,
Bhawani Singh Road,
PDCOR Limited (PDCOR) is a company jointly promoted by the
Government of Rajasthan and Infrastructure Leasing & Financial Jaipur - 302005, Rajasthan
PDCOR Limited Phone: 91-141-2747012-14
Services Limited (IL&FS) to facilitate private sector investment in the
infrastructure sector of Rajasthan. Fax: 91-141-2747045
E-mail: info@pdcor.com
Website: http://www.pdcor.com/
40Key approvals required … (1/3)
Permission and clearances required Respective departments/ organisations of state Time limit (within working days)
• Up to 10 hectares: 30 days from
Land conversion submission of completed
application to district collector.
• Above 10 hectares: 60 days from
submission of completed
application to State Government.
• In case the allotment is to be
made at the district level: 30 days
Land allotment from submission of completed
application to district collector.
• In case Government’s approval is
Exemption in the land ceiling limit Revenue department required: 60 days from
submission of completed
application to the State
Government.
Permission for land use • 60 days at the level of State
Government from the date of
submission of application in the
(In case industry is located outside an district collector’s office.
industrial area) • a) IDCO
• b) Department of Town and
Country Planning
No-Objection Certificate (NOC) and • c) Local authority/District
consent under Water and Air Pollution Collector
Control Act • Rajasthan State Pollution Control
Board (RSPCB)
Source: Industries Department Notification, News Articles
41Key approvals required … (2/3)
Permission and clearances required Respective departments/ organisations of state Time limit (within working days)
For loads up to 25 kW:
• Issue of demand notice: 21 days
from receipt of application.
• Release of connection: 30 days
after compliance of demand notice
if no augmentation is required.
Otherwise 45 days.
For loads above 25 kW and up to 300
kW:
• Issue of demand notice: 21 days
Energy Department from receipt of application.
Release of power connection (Jaipur Vidyut Vitran Nigam • Release of connection: 60 days
Ltd.) after compliance of demand notice.
For loads above 300 kW and up to
2,000 kW
• Issue of demand notice: 21 days
from receipt of application.
• Release of connection: 60 days
after compliance of demand notice.
For loads above 2,000 kW and up to
3,000 kW:
• Issue of demand notice: 60 days
from receipt of application.
• Release of connection: 60 days
after compliance of demand notice.
Source: Industries Department Notification, News Articles
42Key approvals required … (3/3)
Permission and clearances required Respective departments/ organisations of state Time limit (within working days)
For loads above 3,000 kW and up to
Energy Department 5,000 kW:
Release of power connection (Jaipur Vidyut Vitran Nigam • Issue of demand notice: 21 days
Ltd.) from receipt of application.
• Release of connection: 120 days
Allotment of Land/Shed in Industrial after compliance of demand
Estates or Industrial Areas notice.
Sanction of loan Rajasthan State Industrial 40 days
Development and Investment
Allotment of plots in industrial area Corporation (RIICO) 30 days
Registration under the VAT Act
24 hours
Registration under the CST Act
Commercial Taxes Department
Tax clearance certificate 24 hours
One day in case of non-default of tax
payment
Drug Licence - Wholesale 15 days
Drug Licence - Retail Medical and Health Directorate
15 days
Manufacturing of gauge bandage, cotton,
repacking 45 days
Source: Industries Department Notification, News Articles
43Cost of doing business in Rajasthan
Cost parameter Cost estimate Source
Industrial land (per sq ft) US$ 70 to US$ 130 Industry sources
Ministry of Labour and Employment,
Labour cost (minimum wages per day) US$ 3.0 to US$ 5.5
Government of India, April 2014
Hotel costs (five star) US$ 95 to US$ 385 per room per night Leading hotels in the state
Office space rental (per sq ft) US$ 0.22 to US$ 2.5 per month Industry sources
US$ 0.05 to US$ 0.28 per sq ft per month
Residential space rental Industry sources
(rates depend on the type of structure and location)
Domestic: 7.9 cents (US), Commercial: 11.3 cents (US),
Power cost (per kWh) DCH Databook, October 2013
Industrial: 9.7 cents (US), Agriculture: 2.5 cents (US)
44State acts & policies … (1/4)
Rajasthan Solar Energy Policy 2019
• To develop a global hub of solar power of 50GW capacity in next 5-6 years to meet energy
1
requirements of Rajasthan and India.
• To create an R&D hub for deployment of various combinations of RE power technologies and
Wind-Solar based hybrid, co-generation technologies which will focus on improving efficiency in
existing applications and will reduce the cost of balance of system. Read more
Rajasthan Start-up and Innovation Policy 2019
• The policy will be in force for a period of five years.
• Key objectives of the policy are to operationalized and manage Government owned 10 incubators,
support 2,000 startups, mobilise US$ 14.31 million of Angel and Venture Capital and develop an
2
innovation culture in the state.
• It also aims to create employment opportunity for 10 million people in state
• Efforts will be made to provide relevant benefits available under various schemes of the central and
state Government to all startups.
• A major startup fest and two mini startup fests will be organised to provide national and
international visibility to startups. Read more
Rajasthan Investment Promotion Scheme - 2019
3
• To generate employment opportunities and promote rapid, sustainable and balanced economic
growth in the state.
• To provide benefits to eligible enterprises in the manufacturing and services sector.
Read more
45State acts & policies … (2/4)
E-Governance and IT/ITeS Policy, 2015
• Released in November 2015, the main objective of the policy is to bring the citizens and public
services closer to one another.
4
• Provision of IT for good governance in the state.
• Enhanced investments in IT/ITeS, ESDM and robotics sector for promoting economic development
of the state.
• Achieving efficiency, transparency and reliability in different public services to improve these
services by controlling e-Governance in the state. Read more
Rajasthan Mineral Policy 2015
• The Rajasthan Mineral Policy 2015 aims at providing a favourable framework for the legal,
5
procedural, fiscal as well as regulatory aspects in the investment system.
• The other objective of the policy is to improve the exploration of the mineral wealth of Rajasthan
through various in-house facilities and by outsourcing different enhanced techniques.
• To enhance and improve the employment opportunities in the state.
Read more
Biotech Policy 2015
• Positioning Rajasthan as an attractive destination for the biotech industry.
• Creating and upgrading biotechnology infrastructure.
6
• Creating quality infrastructure for research and commercial activities.
• Creating a strong base in academics
• Creating most basic understanding about the sector
• Human resources should be generated for the sector
• More and more biotech industries should be invited in the state
Read more
46State acts & policies … (3/4)
Tourism Policy of Rajasthan
• The Rajasthan Tourism Unit Policy, 2015 is expected to reinforce existing infrastructure
7
• It will encourage infrastructural development
• It will generate income as well as employment and will also increase the availability of rooms in
hotels for tourists
• Rural tourism is expected to increase with opening up of heritage hotels in the rural or panchayat
areas Read more
Rajasthan Solar Energy Policy, 2014
• To reduce dependence on conventional sources of energy by promoting the development of non-
8
conventional energy sources, especially solar power.
• To help Rajasthan attain self-sufficiency in its energy needs.
• To facilitate installation of 25,000 MW solar power through state or private enterprises or through
public private partnerships or through individual efforts. Read more
Urban Local Bodies (ULB) Reforms
9
In January 2021, Rajasthan became the fifth state in the country to successfully undertake Urban
Local Bodies (ULB) reforms, making it eligible to mobilise additional funds worth Rs. 2,731 crore
(US$ 377.43 million) through open market borrowings.
Read more
Policy for Promoting Generation of Electricity from Biomass, 2010
10
• To promote generation of power from biomass.
• To offer solutions to various problems faced by developers, investors, Independent Power
Producers (IPPs) and utilities.
Read more
47State acts & policies … (4/4)
Rajasthan Agro-Processing and Agri-Marketing Promotion Policy - 2015
• To create supply chain infrastructure needed for agro industrial development.
11
• To encourage value addition in agricultural produce and to reduce post-harvest losses.
• To bring in new technologies and practices to modernise agro-processing and marketing.
• To increase the export of value added agri-products from the State
• To accelerate a close interface among research, extension, industries and farmer in agri-sector.
Read more
One Nation One Ration Card System Reform
12
In February 2021, Rajasthan became the 12th state in the country to successfully undertake ‘One
Nation One Ration Card System’ reforms, making it eligible to mobilise additional funds worth Rs.
2,731 crore (US$ 377.43 million) through open market borrowings. Read more
48APPENDIX 49
Sources

                       Data                                                                 Sources

 GSDP (state)                                  Ministry of Statistics and Programme Implementation

 Per capita GSDP figures                       Ministry of Statistics and Programme Implementation

 GSDP (India)                                  Ministry of Statistics and Programme Implementation

  Installed power capacity (MW)                Central Electricity Authority

  Wireless subscribers (No)                    Telecom Regulatory Authority of India

  Internet subscribers (Mn)                    Telecom Regulatory Authority of India

  National highway length (km)                 NHAI, Roads and Building Department-Government of India

  Airports (No)                                Airports Authority of India

  Literacy rate (%)                            Census 2011

  Birth rate (per 1,000 population)            Census 2011

 Cumulative FDI equity inflows (US$ billion)   Department for Promotion of Industry and Internal Trade

  Operational PPP projects (No)                DEA , Ministry of Finance, Government of India

  Operational SEZs (No)                        Ministry of Commerce & Industry, Department of Commerce

 50
Exchange rates
Exchange Rates (Fiscal Year) Exchange Rates (Calendar Year)
Year Rs. Equivalent of one US$ Year Rs. Equivalent of one US$
2004-05 44.95 2005 44.11
2005-06 44.28 2006 45.33
2006-07 45.29 2007 41.29
2007-08 40.24 2008 43.42
2008-09 45.91 2009 48.35
2009-10 47.42 2010 45.74
2010-11 45.58 2011 46.67
2011-12 47.95 2012 53.49
2012-13 54.45 2013 58.63
2013-14 60.50 2014 61.03
2014-15 61.15 2015 64.15
2015-16 65.46 2016 67.21
2016-17 67.09 2017 65.12
2017-18 64.45 2018 68.36
2018-19 69.89 2019 69.89
2019-20 70.49 2020 74.18
2020-21 72.59 2021* 73.69
Note: As of February 2021
Source: Reserve Bank of India, Average for the year
51Disclaimer India Brand Equity Foundation (IBEF) engaged Sutherland Global Services private Limited to prepare/update this presentation. All rights reserved. All copyright in this presentation and related works is solely and exclusively owned by IBEF, delivered during the course of engagement under the Professional Service Agreement signed by the Parties. The same may not be reproduced, wholly or in part in any material form (including photocopying or storing it in any medium by electronic means and whether or not transiently or incidentally to some other use of this presentation), modified or in any manner communicated to any third party except with the written approval of IBEF. This presentation is for information purposes only. While due care has been taken during the compilation of this presentation to ensure that the information is accurate to the best of Sutherland Global Services’ Private Limited and IBEF’s knowledge and belief, the content is not to be construed in any manner whatsoever as a substitute for professional advice. Sutherland Global Services Private Limited and IBEF neither recommend nor endorse any specific products or services that may have been mentioned in this presentation and nor do they assume any liability, damages or responsibility for the outcome of decisions taken as a result of any reliance placed on this presentation. Neither Sutherland Global Services Private Limited nor IBEF shall be liable for any special, direct, indirect or consequential damages that may arise due to any act or omission on the part of the user due to any reliance placed or guidance taken from any portion of this presentation. 52
You can also read