UTTARAKHAND THE SPIRITUAL SOVEREIGN OF INDIA - KEDARNATH TEMPLE IN KEDARNATH, UTTARAKHAND

Page created by Ted Padilla
 
CONTINUE READING
UTTARAKHAND THE SPIRITUAL SOVEREIGN OF INDIA - KEDARNATH TEMPLE IN KEDARNATH, UTTARAKHAND
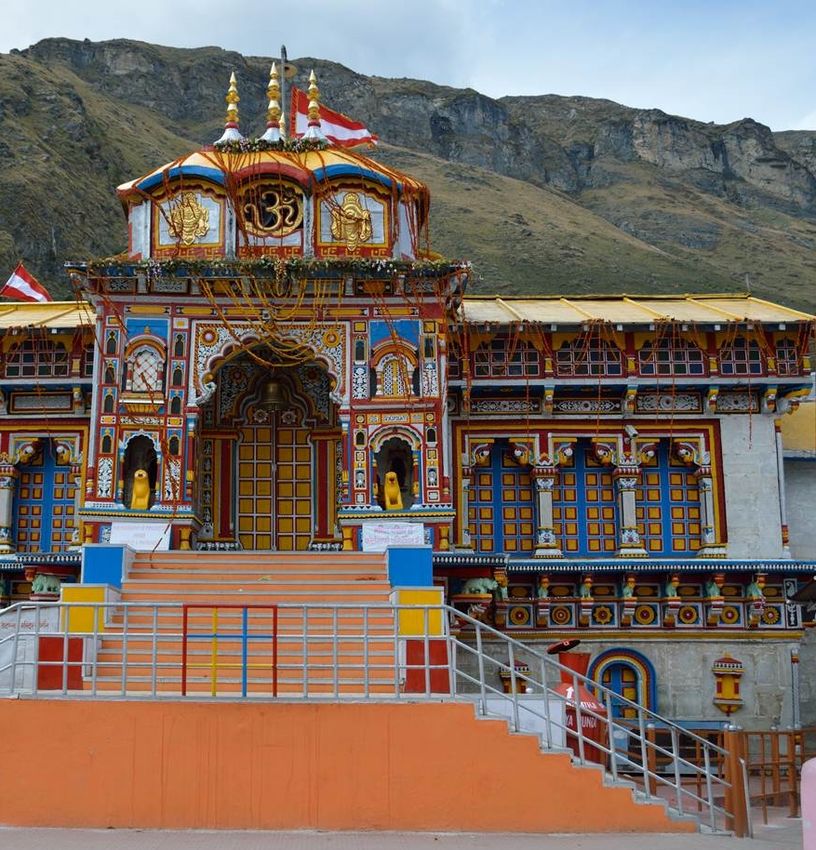
KEDARNATH TEMPLE IN KEDARNATH, UTTARAKHAND

 UTTARAKHAND
 THE SPIRITUAL SOVEREIGN OF INDIA

For updated information, please visit www.ibef.org                                  March 2020
UTTARAKHAND THE SPIRITUAL SOVEREIGN OF INDIA - KEDARNATH TEMPLE IN KEDARNATH, UTTARAKHAND
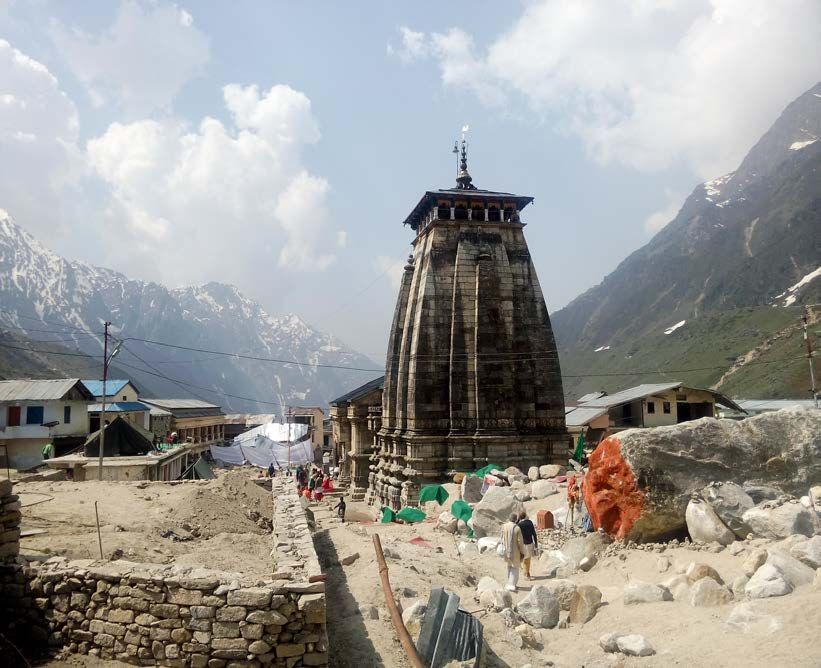
Table of Content

   Executive Summary .…………….…….…...3

   Introduction ……..………………………...…4

   Economic Snapshot ……………….….……9

   Physical Infrastructure ………..……..........15

   Social Infrastructure………………………..23

   Industrial Infrastructure ……..……….........26

  Key Sectors ………….………………..…....28

  Key Procedures & Policies………………...38

  Annexure…………………………………….46
UTTARAKHAND THE SPIRITUAL SOVEREIGN OF INDIA - KEDARNATH TEMPLE IN KEDARNATH, UTTARAKHAND
EXECUTIVE SUMMARY

       Evolving                                  Uttarakhand has witnessed massive growth in capital investments due to a conducive industrial policy and
       industrialisation                          generous tax benefits. Therefore, Uttarakhand is one of the fastest growing states in India. The state’s GSDP
       facilitating growth                        increased at a compound annual growth rate (CAGR) of 10.94 per cent between FY 11-21.

                                                   The state is situated in the foothills of Himalayas. The presence of several hill stations, wildlife parks,
       Thriving tourism                             pilgrimage places & trekking routes make Uttarakhand an attractive tourist destination. In 2017(P), domestic
                                                    tourist inflow in the state were 34.36 million and foreign tourist visits had crossed over 0.13 million.

                                                 Uttarakhand is being developed as an ‘energy state’ to tap the hydropower electric potential of over 25,000
       Hydropower generation
                                                  MW. As of February 2020, hydropower generation installed capacity in the state was recorded to be 1,876.99
       potential                                  MW.

       Forest sector on growth                   Forest area covers about 71.05 per cent of the state. The state’s GSVA from forestry and logging grew at a
       path                                       CAGR of 4.60 per cent between 2011-12 and 2018-19 to reach US$ 538.81 million.

       Floriculture and                          Uttarakhand has almost all agro-geo climatic zones, which provide commercial opportunities for floriculture and
       horticulture                               horticulture. The state has 175 rare species of medicinal and aromatic plants.

    Note: P – Provisional, Uttatakhand latest GDP data available till 2017-18 on MOSPI.
    Source: Uttarakhand at a glance, 2014-15, Central Electricity Authority, Forest Department, Uttarakhand, Ministry of Tourism, Ministry of Statistics and Programme Implementation,
    Economic survey of Uttarakhand 2018-19

3         UTTARAKHAND                                                                                                       For updated information, please visit www.ibef.org
UTTARAKHAND THE SPIRITUAL SOVEREIGN OF INDIA - KEDARNATH TEMPLE IN KEDARNATH, UTTARAKHAND
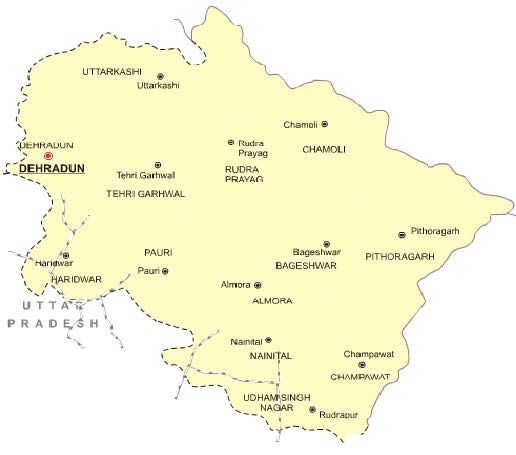
UTTARAKHAND

INTRODUCTION
UTTARAKHAND THE SPIRITUAL SOVEREIGN OF INDIA - KEDARNATH TEMPLE IN KEDARNATH, UTTARAKHAND
ADVANTAGE: UTTARAKHAND

                                 Favourable location and abundant resources                              Stable political environment

                                The state has close proximity to the national capital of      The state has a stable political environment with
                                 Delhi, a leading market of the country and excellent           successive governments that have been committed
                                 connectivity with neighbouring states.                         towards creating a progressive business environment.
                                Abundant natural resources due to hills and forests
                                 supporting tourism, and vast water resources favouring
                                 hydropower. Agro-climatic conditions support
                                 horticulture-based industries.

                                                                                     Advantage
                                                                                     Uttarakhand
                                              Adequate labour pool                                         Policy and Infrastructure

                                                                                               The state offers a wide range of benefits in terms of
                                The average literacy level is high. A large pool of
                                                                                                interest incentives, financial assistance, subsidies and
                                 talented human resources is available as Uttarakhand
                                                                                                concessions.
                                 has some of the leading educational institutions in the
                                 country.                                                      Uttarakhand has a strong social and industrial
                                                                                                infrastructure, virtual connectivity with over 39,000 km
                                Top-notch institutes, such as IIT Roorkee and IIM
                                                                                                of road network, two domestic airports, 339.80 km of
                                 Kashipur, are located in the state.
                                                                                                rail routes and an installed power capacity of 3,549.68
                                                                                                MW (up to February 2020).

    Source: Central Electricity Authority

5         UTTARAKHAND                                                                                             For updated information, please visit www.ibef.org
UTTARAKHAND THE SPIRITUAL SOVEREIGN OF INDIA - KEDARNATH TEMPLE IN KEDARNATH, UTTARAKHAND
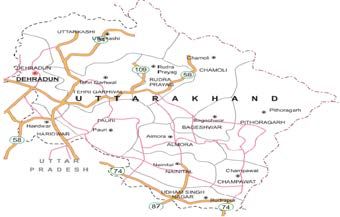
UTTARAKHAND VISION 2022

                                              Strengthen road network in urban areas            Quality primary education to be
                                               and upgrade national highways.                     provided to all children.
                                              Develop two major all-weather airports            Job oriented vocational training
                                               with connectivity to metro cities.                 facilities and establishment of
                                                                                                  higher education institutions.

              Affordable healthcare with focus on                                                                                      Become a world leader in green
                                                                                        Education & skill
               disease prevention.                                    Transport                                                          energy by leveraging
                                                                                         development
              Provide state funded maternal and                                                                                         hydropower potential.
               child healthcare, especially in rural                                                                                    Promote micro and small
               areas.                                     Health
                                                                                                                                         enterprises.
                                                                                                          Industries
                                                                               Vision 2030
          Promote the state as a global tourist                                                                                        Promote the state as a green
                                                         Tourism                                          Environment
           destination by showcasing its                                                                                                 economy by focusing on sectors
           spiritual, cultural and adventure                                                                                             such as IT, agriculture, tourism,
           tourism.                                                                                                                      hydropower and education.
                                                                     Agriculture        Infrastructure
          To attain a position among the top 3                                                                                         100 per cent solid waste
           destination states by 2030.                                                                                                   management, waste water
                                                                                                                                         treatment and recycling.
                                              Reduce the use of fossil fuel
                                              transform through diversification             Harness hydropower for 100%
                                               towards horticulture, aromatic and             electrification in the state and supply
                                               medicinal plants, animal husbandry,            power to other states.
                                               etc.    and       give     additional         Connect major cities through multi-lane
                                               employment opportunities                       highways and proper roads for
                                                                                              villages.

    Source: Confederation of Indian Industry

6       UTTARAKHAND                                                                                              For updated information, please visit www.ibef.org
UTTARAKHAND FACTFILE

                                                                                                 The state was formed in November 2000 by carving out the 13 hill-
                                                                                                  districts of Uttar Pradesh. It was formerly named Uttaranchal.

                                                                                                Parameters                                             Uttarakhand

                                                                                                Capital                                                  Dehradun

                                                                                                Geographical area (lakh sq. km)                            53,483

                                                     Source: Uttarakhand Government Portal      Administrative districts (No)                                24
                                                            (http://uk.gov.in/images/map.jpg)
                                                                                                Population density (persons per sq. km)                     189
      Uttarakhand is located at the foothills of the Himalayan mountain
         ranges. The state shares borders with China (Tibet) in the north &                     Total population (million)                                  10.1
         Nepal in the east & inter-state boundaries with Himachal Pradesh in
                                                                                                  Male population (million)                                 5.1
         the west & northwest & Uttar Pradesh in the south.

                                                                                                  Female population (million)                               4.9
      Hindi, Garhwali & Kumaoni are commonly spoken in the state.
         English is the medium of education in many of its schools.                             Sex ratio (females per 1,000 males)                         963

      Uttarakhand has diverse geographical features ranging from snow-                         Literacy rate (%)                                          79.63
         capped mountain peaks in the north to tropical forests in the south;
         its climate & vegetation vary accordingly.

    Source: Uttarakhand at a Glance, 2014-15, Directorate of Economics and Statistics

7         UTTARAKHAND                                                                                               For updated information, please visit www.ibef.org
UTTARAKHAND IN FIGURES

      Uttarakhand Contribution to Indian Economy (2017-18)                                      Physical Infrastructure in Uttarakhand

      Parameter                                 Uttarakhand                 India               Parameter                               Uttarakhand                    India
      GSDP as a percentage of all                                                               Installed power capacity
                                                     1.24                  100.00                                                         3,549.68                   369,427.97
      states’ GSDP                                                                              (MW) (February 2020)
      GSDP growth rate (%)                          11.25^                   9.82               Wireless subscribers
                                                                                                (million)                                   62.89                     1,151.43
      Per capita GSDP (US$)                          3,287                  1,975               (as of February 2020)*
                                                                                                Internet subscribers (mn)*
      Social Indicators                                                                                                                     34.62                       687.62
                                                                                                (as of September 2019)
      Parameter                                 Uttarakhand                 India               National highway length
                                                                                                                                            2,949                      132,499
                                                                                                (km) (March 2019)
      Literacy rate (%)                              79.63                  74.04
                                                                                                Airports (No)                                  2                       13+187
      Birth rate (per 1,000
                                                     16.6                    20.4
      population)

      Industrial Infrastructure                                                                  Investments (US$ million)

      Parameter                                 Uttarakhand                 India                Parameter                                  Uttarakhand1                India
      Operational PPP projects (No)                                                              Cumulative FDI equity inflows
                                                       34                    901                 between April 2000 –                              699                446,237
      (April 2019)
                                                                                                 September 2019

    Note: ^GSDP growth in rupee terms , Public-Private Partnership, SEZ: Special Economic Zone, SRS: Sample Registration System, 1Uttar Pradesh and Uttarakhand, *Uttarakhand is
    included in Uttar Pradesh West telecom circle, For sources refer to annexure

8         UTTARAKHAND                                                                                                  For updated information, please visit www.ibef.org
UTTARAKHAND

ECONOMIC SNAPSHOT
ECONOMIC SNAPSHOT – GSDP

                                            GSDP at current prices                                                                                                  GSDP per capita at current prices

         45.00                                                                                                                         3.5   4,000                                      CAGR (In Rs) 11.11%                                              250,000
                                                       CAGR (In Rs) 10.94%
         40.00

                                                                                                                                                                                                                                               237,147
                                                                                                                             41.99
                                                                                                                                       3     3,500
                                                                                                                                                                                                                                                         200,000

                                                                                                                                                                                                                                 214,933
         35.00

                                                                                                                           2.93
                                                                                                                 37.66

                                                                                                                                                                                                                                  3,335

                                                                                                                                                                                                                                             3,287
                                                                                                                                       2.5   3,000

                                                                                                                                                                                                                     192,397
                                                                                                               2.63
                                                                                           33.35
         30.00

                                                                                                    32.87

                                                                                                                                                                                                                     2,868
                                                                                                   2.37
                                                                                                                                             2,500                                                                                                       150,000

                                                                                                                                                                                                          165,202
                                                                                                                                       2
                                                                                28.60
         25.00

                                                                                        2.15

                                                                                                                                                                                                           2,524
                                                                                                                                                                                                2,495
                                                                      27.06

                                                                                                                                                                                              152,560
                                                            26.40

                                                                                                                                                            2,366

                                                                                                                                                                                      2,360
                                                                                                                                                                           2,346

                                                                                                                                                                                   142,778
                                                                              1.92
                                               24.64

                                                                                                                                             2,000
                                24.17
                    24.05

         20.00
                                                                    1.77

                                                                                                                                       1.5

                                                                                                                                                                      127,755
                                                         1.61

                                                                                                                                                                                                                                                         100,000
                                            1.49

                                                                                                                                                     113,456
         15.00                                                                                                                               1,500
                                     1.32

                                                                                                                                       1
                         1.15

         10.00                                                                                                                               1,000
                                                                                                                                       0.5                                                                                                               50,000
           5.00
                                                                                                                                              500
           0.00                                                                                                                        0
                                                                                                                                                0                                                                                                        0
                    2011-12

                                2012-13

                                            2013-14

                                                         2014-15

                                                                    2015-16

                                                                              2016-17

                                                                                        2017-18

                                                                                                   2018-19AE

                                                                                                               2019-20BE

                                                                                                                           2020-21BE

                                                                                                                                                     2011-12

                                                                                                                                                                      2012-13

                                                                                                                                                                                   2013-14

                                                                                                                                                                                              2014-15

                                                                                                                                                                                                          2015-16

                                                                                                                                                                                                                     2016-17PE

                                                                                                                                                                                                                                 2017-18PE

                                                                                                                                                                                                                                             2018-19AE
                                                       US$ billion             Rs trillion
                                                                                                                                                                                                    US$         Rs
          At current prices, Gross State Domestic Product (GSDP) of
           Uttarakhand stood at around Rs 2.93 trillion (US$ 41.99 billion)                                                                   In 2018-19AE, the state’s per capita GSDP was estimated at
           in 2020-21.                                                                                                                         around Rs 237,147 (US$ 3,287).
          Between 2011-12 and 2020-21, GSDP of the state grew at a                                                                           The per capita GSDP increased at a CAGR of 11.11 per cent
           CAGR of 10.94 per cent.                                                                                                             between 2011-12 and 2018-19AE.

     Note: Exchange rates used are averages of each year, provided on page 47, AE – Advanced estimate, PE – Provisional estimate
     Source: Ministry of Statistics and Programme Implementation, Uttarakhand 1st advanced estimate of 2018-19

10       UTTARAKHAND                                                                                                                                                 For updated information, please visit www.ibef.org
ECONOMIC SNAPSHOT – NSDP

                             NSDP at current prices (in US$ billion)                                                           NSDP per capita at current prices (in US$)

        35.00                                                                                                    2.5   3,000                                                                                                    200,000
                                                         CAGR (In Rs) 11.06%                                                                                           CAGR (In Rs) 9.58%
                                                                                                                                                                                                                                180,000

                                                                                                                                                                                                                      190,284
        30.00

                                                                                                                                                                                                              2,709
                                                                                                                       2,500

                                                                                                                                                                                                                      2,637
                                                                                                                                                                                                           174,622
                                                                                                                 2                                                                                                              160,000

                                                                                            29.85

                                                                                                      2.12
                                                                                                     29.44

                                                                                                                                                                                                 158,112
        25.00

                                                                                                                                                                                                   2,357
                                                                                           1.92
                                                                                                                                                                                                                                140,000

                                                                                                                                                                                        2,255
                                                                                 25.62

                                                                                                                                                                              2,222

                                                                                                                                                                                      147,592
                                                                                                                       2,000

                                                                        24.18

                                                                                 1.72

                                                                                                                               2,092

                                                                                                                                                     2,087

                                                                                                                                                                 2,087
                                                               23.51

                                                                                                                 1.5

                                                                                                                                                                          135,881
        20.00                                                                                                                                                                                                                   120,000
                                                                       1.58
                                                 21.79
                                       21.50

                                                                                                                                                             126,247
                   21.26

                                                             1.44

                                                                                                                                               113,610
                                                                                                                       1,500                                                                                                    100,000
                                               1.32

        15.00                                                                                                    1
                                    1.17

                                                                                                                                     100,305
                                                                                                                                                                                                                                80,000
                             1.02

        10.00                                                                                                          1,000
                                                                                                                                                                                                                                60,000
                                                                                                                 0.5
         5.00                                                                                                                                                                                                                   40,000
                                                                                                                        500
         0.00                                                                                                    0                                                                                                              20,000
                   2011-12

                                    2012-13

                                               2013-14

                                                             2014-15

                                                                       2015-16

                                                                                 2016-17

                                                                                           2017-18

                                                                                                     2018-19AE
                                                                                                                          0                                                                                                     0

                                                                                                                               2011-12

                                                                                                                                               2012-13

                                                                                                                                                             2013-14

                                                                                                                                                                          2014-15

                                                                                                                                                                                      2015-16

                                                                                                                                                                                                 2016-17

                                                                                                                                                                                                           2017-18

                                                                                                                                                                                                                      2018-19
                                                 US$ billion           Rs trillion                                                                                              US$         Rs

          At current prices, net state domestic product (NSDP) of
                                                                                                                        In 2018-19AE, the state’s per capita NSDP was about Rs
           Uttarakhand was around Rs 2.12 trillion (US$ 29.44 billion) in
                                                                                                                         190,284 (US$ 2,637).
           2018-19.
                                                                                                                        The per capita NSDP increased at a CAGR of 9.58 per cent
          NSDP of the state witnessed growth at a CAGR of 11.06 per
                                                                                                                         between 2011-12 and 2018-19.
           cent between 2011-12 and 2018-19AE.

     Note: Exchange rates used are averages of each year, provided on page 47, AE – Advanced estimate, PE – Provisional estimate
     Source: Ministry of Statistics and Programme Implementation, Uttarakhand 1st advanced estimate of 2018-19

11       UTTARAKHAND                                                                                                                           For updated information, please visit www.ibef.org
ECONOMIC SNAPSHOT – PERCENTAGE
                  DISTRIBUTION OF GSVA

      During 2018-19AE, the tertiary sector’s share in Gross State Value                                         GSVA composition by Sector
       added was 40.91 per cent. Trade, hotels & restaurants are the
       largest sub-groups of the sector & registered strong growth in                           100%
                                                                                                                       33.88%       CAGR         40.91%
       comparison with the previous year.                                                         90%

      The tertiary sector witnessed the fastest growth of 13.14 per cent,                        80%                              13.14%

       followed by the secondary sector (8.93 per cent) and primary sector                        70%
       (6.15 per cent) between FY12-19.
                                                                                                                       52.13%
                                                                                                  60%
                                                                                                                                                 48.28%
      The share of the secondary sector in GSVA was 48.28 per cent in                            50%
       2018-19AE; majorly driven by the growth in the manufacturing
                                                                                                  40%
       sector.
                                                                                                                                    8.93%
                                                                                                  30%

                                                                                                  20%

                                                                                                  10%                  14.00%
                                                                                                                                    6.15%        10.81%
                                                                                                   0%
                                                                                                                       2011-12                  2018-19AE

                                                                                                                       Primary   Secondary   Tertiary

 Note:- * CAGR in Rs term, Exchange rates used are averages of each year, provided on page 47, AE- Advanced estimate
 Source: Ministry of Statistics and Programme Implementation, 1st advanced estimate as of 2018-19

12      UTTARAKHAND                                                                                               For updated information, please visit www.ibef.org
ECONOMIC SNAPSHOT – FDI INFLOWS &
                        INVESTMENTS

                                                                               1
                Visakhapatnam
                 FDI Inflows in Uttarakhand
                                 port traffic (million
                                               (US$ million)
                                                       tonnes)                                                Investment intentions Filed in Uttarakhand

         800                                                                                699
                                                                                     5                  450         422.24
         700                                                                  34
                                                                       90                               400

                                                                                     694

                                                                                            694
         600                                                    7
                                                         80                                             350                                                          306.48
         500                                      111                                                                              282.31
                                                                                                        300
         400                        30     25                                                           250
                             140                                                                                                                     191.27
         300                                                                                            200

         200                                                                                            150
                                                                                                        100
                 65

         100                                                                                                                                  47              46
                                                                                                               42             45
                                                                                                         50
           0
                             FY12

                                    FY13

                                           FY14

                                                  FY15

                                                         FY16

                                                                FY17

                                                                       FY18

                                                                              FY19

                                                                                     FY20
                 FY00-FY11

                                                                                            FY01-FY20
                                                                                                          0
                                                                                                                 2016            2017              2018            2019

                                                                                                        Number of Investment Intentions   Proposed Investments (US$ Million)

      According to the Department for Promotion of Industry and Internal Trade (DPIIT), the cumulative FDI inflows, during April 2000 to September
       2019, stood at around US$ 699 million1.

      In 2019, 46 Industrial Entrepreneurs Memorandums (IEMs) worth Rs 2,142 crore (US$ 306.48 million) have been filed in Uttarakhand.

      Since Investors Summit in October 2018, the state has received Rs 17,246 crore (US$ 2.47 billion) investment and generated around 45,000 jobs
       in various sectors.

 Note: 1Uttarakhand is included in Uttar Pradesh West telecom circle
 Source: Department for Promotion of Industry and Internal Trade (DPIIT),1Including Uttar Pradesh

13      UTTARAKHAND                                                                                                  For updated information, please visit www.ibef.org
ECONOMIC SNAPSHOT – UTTARAKHAND’S EXPORT
                   TRENDS

                             Export Trend (US$ billion)                                          Composition of Major Item Exported

           2.50

                                                                                                                                      5.53%
                                                                     2.35

                                                                                                              27.92%
           2.00

                                                                                                                                                      35.93%
                                                                             1.92

           1.50
                                                         1.46
                     1.39
                                 1.22

                                                                                                      7.79%

                                                                                                                                         9.37%
           1.00

                                                                                                                 2.74%

                                                                                                                         1.87%

                                                                                                                                 3.26%

                                                                                                                                             5.58%
                                             0.90

           0.50
                                                                                      Zinc and Products Made of Zinc                          Drug Formulations and Biologicals
                                                                                      Organic Chemicals                                       Plastic sheet, Film, Plastic Etc
                                                                                      Lead and Products made of Led                           Gold
           0.00                                                                       Motor Vehical/Cars                                      Auto Components/Parts
                   2014-15     2015-16     2016-17     2017-18     2018-19 2019-20*   Others

      Total exports from the state stood at US$ 2.35 billion during 2018-19 and reached US$ 1.92 billion during April-December 2019.

      Major items exported from Uttarakhand are Ship, Boat and Floating Structure, Gold and Zinc and Products Made of Zinc etc.

      During 2018-19, total exports of Ship, Boat and Floating Structure from Uttarakhand stood at US$ 370 billion which was 16.88 per cent of the total
       exports.

 Note: *-till December 2019
 Source: Directorate General of Commercial Intelligence and Statistics

14      UTTARAKHAND                                                                                  For updated information, please visit www.ibef.org
UTTARAKHAND

PHYSICAL
INFRASTRUCTURE
PHYSICAL INFRASTRUCTURE – ROADS

      PWD, BRTF, local bodies & the prominent authorities in the state for
       the maintenance of roads.

      Under Pradhan Mantri Gram Sadak Yojana (PMGSY), 32 habitations
       have been provided connectivity by completing the construction work
       on 598 km long roads, spending Rs 720 crore (US$ 103.02 million)
       in 2018-19 and Rs 900 crore (US$ 128.77 million) have been
       allocated for 2019-20.

      Under State Budget 2019-20, an amount of Rs 240 crore (US$ 34.34
       million) was allocated for maintenance of roads and bridges.

                                                                                                                                                                Source: Maps of India
     Fund Allocation                                                                           Vehicles in Uttarakhand (Parc)

        CRF (US$ million)                     Accrual                   Release                Year                      Personal            Professional              Total
                                                                                                                         Vehicles              Vehicles               Vehicles
              2014-15                           4.68                      16.56                  2000-01                   333,433                30,483                363,916

              2015-16                           5.74                       0.06
                                                                                                 2009-10                   930,820                81,268              1,012,088

              2016-17                          14.37                       1.89
                                                                                                 2016-17                  2,083,313               168,808             2,252,121
              2017-18                          13.33                      11.95
                                                                                                 2017-18 (up
     2018-19$(as of September,                                                                   to December              2,077,605               371,342             2,448,947
                                               15.56                       0.00                  2017)
              2018)

 Note: $ - Funds to some states have been released more than accrual of a state from the unspent balance of previous years of that states, CRF - Central Road Fund.
 Source: Ministry of Road Transport & Highways, NHAI, State Transport Department, State Budget 2019-20, Hindustan Times

16      UTTARAKHAND                                                                                                   For updated information, please visit www.ibef.org
PHYSICAL INFRASTRUCTURE – RAILWAYS

      The main railway stations in the state are Dehradun, Haridwar,
       Roorkee, Kotdwar, Kashipur, Udham Singh Nagar, Haldwani,
       Ramnagar and Kathgodam

      Uttarakhand had 339.80 km of rail routes. The state is focusing on
       increasing the share of railways in cargo and passenger transport.

      Initiatives have been undertaken to start monorails at Dehradun,
       Haridwar and Rishikesh, on the inter-city linkage routes.

      Under State Budget 2019-20, an allocation of Rs 50 crore (US$ 7.15
       million) has been made for development of metro rail.

      Eight railway stations in the state have been identified for
       redevelopment by Government of India.

      In July 2019, Bharat Heavy Electricals Limited and Container
       Corporation of India (CONCOR) entered in agreement to set up a
       rail-based logistics terminal at Haridwar.

                                                                                                           Source: Maps of India

17      UTTARAKHAND                                                         For updated information, please visit www.ibef.org
PHYSICAL INFRASTRUCTURE – AIRPORTS

                          Dehradun aircraft movement (nos.)                                                  Dehradun passenger traffic (‘000)

           14,000                                                                            1,400

           12,000                                                     12,517                 1,200
                                                                                                                                                 1,240
           10,000                                           11,204             11,229                                                                    1125
                                                                                             1,000
                                                                                                                                       1,015
                                                    9,485
            8,000                                                                              800                              883

            6,000                                                                              600

            4,000                4,840     4,962                                               400
                       4,078                                                                                             472
                                                                                                                 379
            2,000                                                                              200      307

                 0                                                                                0
                     2013-14              2015-16           2017-18            2019-20*               2013-14 2014-15 2015-16 2016-17 2017-18 2018-19 2019-20*

      The state has two domestic airports: one at Jolly Grant in the Dehradun district and another at Pant Nagar in the Udham Singh Nagar district. The
         state intends to position air transport as a reliable all-weather transport option for the hills.

      With Uttarakhand emerging as a hot tourist and industrial destination, the state government is focussing on upgrading the Jolly Grant airport as an
         international airport, in coordination with Airports Authority of India. In December 2019, government allocated Rs 13 crore (US$ 1.86 million)
         construct and expand air strip at Jolly Grant airport.

      In 2018-19, Dehradun airport handled 12,517 aircraft movements and 1,240,173 passengers.

      Under UDAN scheme, the government started cheap air services to Dehradun, Pantnagar and Pithoragarh.
     Note: * Till February 2020
     Source: Airport Authority of India

18        UTTARAKHAND                                                                                         For updated information, please visit www.ibef.org
PHYSICAL INFRASTRUCTURE – POWER

      As of February 2020, the state had total installed power generation                                 Installed power capacity (MW)
       capacity of 3,549.68 MW. Hydro (renewable) power contributed
                                                                                    4,000
       1,876.89 MW to the total installed power generation capacity of the
                                                                                    3,500

                                                                                                                                                                                                              3,550
       state, followed by thermal power with a contribution of 980.83 MW

                                                                                                                                                                                                    3,403
                                                                                                                                                                                          3,356
                                                                                    3,000

                                                                                                                                                                                3,313
                                                                                                                                                                      3,269
                                                                                                                                                            3,177
       and 660.21 MW from renewable sources. Of the total installed power           2,500

                                                                                                                                                 2,615
                                                                                                                                       2,561
                                                                                                                           2,527
                                                                                                                 2,455
                                                                                                       2,405
                                                                                             2,383
       generation capacity, state utilities accounted for the largest share of      2,000
                                                                                    1,500
       1,320.02 MW, followed by 1,291.05 MW under private utilities and
                                                                                    1,000
       938.61 MW under central utilities.
                                                                                      500
                                                                                        0
      As of April to January 2019-20, energy requirement in the state

                                                                                             2008-09

                                                                                                       2009-10

                                                                                                                 2010-11

                                                                                                                           2011-12

                                                                                                                                       2012-13

                                                                                                                                                 2013-14

                                                                                                                                                            2014-15

                                                                                                                                                                      2015-16

                                                                                                                                                                                2016-17

                                                                                                                                                                                          2017-18

                                                                                                                                                                                                    2018-19

                                                                                                                                                                                                              2019-20*
       reached 12,4784 million units.

      Uttarakhand Jal Vidyut Nigam Limited (UJVNL) controls the state’s
       hydropower generation and the state’s power sector is regulated by        Structure of power utilities of Uttarakhand
       the Uttarakhand Electricity Regulatory Commission (UERC).
                                                                                  Activity                                                                 Company name
      Uttarakhand Government has laid down the foundation stone of the
                                                                                                                                     Uttarakhand Jal Vidyut Nigam Limited
                                                                                  Power generation
       60 MW Naitwar Mori Hydro Electric Project at Uttarkashi which is                                                                           (UJVNL)
       located on Yamuna river in Uttarakhand.                                                                                        Power Transmission Corporation of
                                                                                  Power transmission
                                                                                                                                        Uttarakhand Limited (PTCUL)
      In 2019-20, the work of 120 MW Byasi hydro power project is
                                                                                                                                     Uttarakhand Power Corporation Limited
       expected to be completed.                                                  Power distribution
                                                                                                                                                   (UPCL)
 Note: * Till February 2020
 Source: Central Electricity Authority

19      UTTARAKHAND                                                                                         For updated information, please visit www.ibef.org
PHYSICAL INFRASTRUCTURE – TELECOM

       The state has a well-developed communication network including                         Telecom Infrastructure* (as of February 2020)
         both wired and wireless connectivity. As per Telecom Regulatory
         Authority of India (TRAI), the state had 0.31 million wire-line                       Wireless subscribers (no.)                          62,898,141
         subscribers and 62.89 million wireless subscribers, as of February
                                                                                               Wireline subscribers (no.)                           317,023
         2020.
                                                                                               Internet subscribers* (million)(as on
                                                                                                                                                       34.62
                                                                                               Septemberr 2019)
       All India Radio (AIR) plans to set up new transmitters with the aim to
         reach every nook and corner of the state’s mountainous terrain.                       Tele density^ (%)                                       69.27

       Uttarakhand State Wide Area Network (USWAN) is operational in
         the state. Some of the projects under Information Technology                          Performance Status of Bharat Net Project (as of December 2018)
         Development         Agency      (ITDA)      Uttarakhand       are     National   e-
         Governance Plan (NeGP) Capacity Building Project, Common                              No. of GPs in Phase-I                           1,767

         Service Centre (CSC) and State Data Centre (SDC).
                                                                                               Optical Fibre Cable laid (km)*                  3,530

                                                                                               GPs for which cable laid                        1,524

                                                                                               Service ready GPs(as of
                                                                                                                                               1,525
                                                                                               December 2019)

     Note: * Uttarakhand included in UP West circle, ^-include Uttar Pradesh
     Source: Telecom Regulatory Authority of India

20        UTTARAKHAND                                                                                              For updated information, please visit www.ibef.org
PHYSICAL INFRASTRUCTURE – URBAN … (1/2)

      In Government of India and Government of Uttarakhand and the                            Status of Fund Release and Utilisation under AMRUT
        World Bank signed US$ 120 million Loan Agreement to improve                            (as of February 2019) (US$ million)

        access to Water Supply Services in the Hilly State of Uttarakhand.                                                    Approved
                                                                                                                                                   Committed          Released
                                                                                                                              SAAP Size
      Focussing on urban development, the Uttarakhand government
                                                                                               Fund under
                                                                                                                                  98.5                 73.97             25.58
        allocated an amount of US$ 203.98 million in the State Budget 2019-                    AMRUT Program*
        20.                                                                                    Total number of
                                                                                                                                                      7
                                                                                               AMRUT cities
      In April 2018, Asian Development Bank has agreed to provide Rs
        1,700 crore (US$ 263.77 million) to Uttarakhand, for the development
        of infrastructure and construction of sewerage treatment facilities in                 Achievement under AMRUT

        urban areas.                                                                                                                                                  Work-on
                                                                                                     Programs                   Target             Completed
                                                                                                                                                                      progress
      Under State Budget 2019-20, Rs 100 crore (US$ 14.31 million) have
        been allocated for        the Atal Renewal and Urban Transformation                        Water supply                    37                     8                14

        Mission (AMRUT) scheme.                                                                    Sewerage and
                                                                                                     Septage                        42                    8                19
                                                                                                   management

                                                                                                      Drainage                      7                     2

                                                                                                    Green Space                     41                    6                23

     Source: Uttarakhand at a Glance, 2014-15, Directorate of Economics and Statistics, Government of Uttarakhand, JNNURM, Ministry of Urban Development, State Budget 2019-20

21       UTTARAKHAND                                                                                                 For updated information, please visit www.ibef.org
PHYSICAL INFRASTRUCTURE – URBAN … (2/2)

      The Government of Uttarakhand proposed 3 Smart Cities: Dehradun,
        Haridwar & Roorkee. Out of these, the central government approved
        only Dehradun to be developed as a smart city on the basis of urban
        population & the number of statutory towns.

      Dehradun will be the first smart city in the state and will be based on
        the city of Rio de Janerio in Brazil. Under the model, all public
        services like transport, medical services, water, electricity and solid
        waste management will be IT-enabled through an Integrated
                                                                                  Dehradun
        Command and Control System (ICCS).

      In 2019, the merger of the Uttarakhand Special Area Development
        Authority (SADA) with the Mussoorie Dehradun Development
        Authority (MDDA) was approved.

      Under State Budget 2019-20, Rs 160 crore (US$ 22.89 million) has
        been allocated for smart city project.
     Smart City

      City                 Population        Area (sq. km)      Literacy rate

        Dehradun            1,696,694            3,088             84.25%

22      UTTARAKHAND                                                                          For updated information, please visit www.ibef.org
UTTARAKHAND

SOCIAL
INFRASTRUCTURE
SOCIAL INFRASTRUCTURE – EDUCATION

      The state has 15,179 government schools with student enrolment
                                                                                              Allocation and release of Funds Under Sarva Shiksha Abhiyan
                                                                                                                       (US$ million)
       reaching    754,816     and    4,469     private   schools     with    923,857
                                                                                                  180.00
       enrolments.
                                                                                                  160.00

                                                                                                                                                                                                       163.05

                                                                                                                                                                                                                    153.53
      To ensure regular presence of teachers in schools, biometric                               140.00
                                                                                                  120.00
       machines have been installed in 2114 state model schools.
                                                                                                  100.00

                                                                                                                                                                                              99.78
      At an estimated cost of US$ 6.11 million, Sampark Smart Class                               80.00

                                                                                                                                                                                            86.62
                                                                                                                     85.19

                                                                                                                                     72.64
                                                                                                   60.00
       programme was launched by the Government of Uttarakhand to

                                                                                                                                                            61.61
                                                                                                                                                60.54

                                                                                                                                                                                   58.54
                                                                                                                                                                       52.85
                                                                                                   40.00

                                                                                                             44.57
       improve the learning outcomes in Mathematics & English at primary

                                                                                                                             33.03

                                                                                                                                             36.57

                                                                                                                                                         37.96

                                                                                                                                                                     31.31

                                                                                                                                                                                35.02
                                                                                                   20.00
       level.
                                                                                                    0.00

                                                                                                                2011-12

                                                                                                                                2012-13

                                                                                                                                               2013-14

                                                                                                                                                           2014-15

                                                                                                                                                                      2015-16

                                                                                                                                                                                  2016-17

                                                                                                                                                                                             2017-18

                                                                                                                                                                                                          2018-19

                                                                                                                                                                                                                       2019-20
      For the financial year 2019-20, provision of Rs 7,642.63 crore (US$
       1.09 billion) for school education and Rs 548.37 crore (US$ 78.46
                                                                                                                             Funds Released                          Expediture Incurred
       million) for higher education department has been made.

      Rs 12 crore (US$ 1.71 million) under capital head of Doon University                   In order to boost medical education in the state, the Government of
       and for the 27 establishment of Law University in the state a                            Uttarakhand has proposed to invest US$ 44.50 million. The
       provision of Rs 5 crore (US$ 0.71 million) has been made in budget                       government is planning to introduce new medical and A.N.M
       2019-20.                                                                                 colleges in the state.

      As of 2018, Uttarakhand has 36 universities and 438 colleges and
       158 Industrial Training Institutes.
 Source: Uttarakhand at a Glance, 2014-15, Directorate of Economics and Statistics, Government of Uttarakhand, Census 2011

24      UTTARAKHAND                                                                                                          For updated information, please visit www.ibef.org
SOCIAL INFRASTRUCTURE – HEALTH

      Uttarakhand has a good network of hospitals & health centres. As of                    Healthcare facilities in Uttarakhand (as of March 2020)
       December 2019, the state had 1,919 Sub centres, 305 Primary
                                                                                                Type of Facility                                           No.
       health centers, 73 Community Health Centres, 47 Sub District
       Hospitals and 21 District Hospitals.                                                     Sub centres                                                1,919

                                                                                                Primary health centres                                     305
      In State Budget 2019-20, under Medical Health and Family Welfare,
       Medical Education, provision of Rs 2,545.40 crore (US$ 364.20                            Community health centres                                    73
       million) has been made.
                                                                                                Sub district hospitals                                      47

      The state government has started a service called e-Aushadhi Yojna                       District hospitals                                          21
       in order to maintain continuous supply and availability of medicines
                                                                                                Total                                                      2,365
       and tele-radiology service has been started by the Government to
       accelerate the tests and diagnosis facilities of patients in 35 major
       hospitals of the state.                                                                Health indicators (2017)

                                                                                                          1
                                                                                               Birth rate                                                          17.3

                                                                                                              1
                                                                                               Death rate                                                          6.7

                                                                                                                      2
                                                                                               Infant mortality rate                                               32

 Source: Directorate of Economics and Statistics, Government of Uttarakhand, Sample Registration System 1Per thousand persons, 2Per thousand live births

25      UTTARAKHAND                                                                                                  For updated information, please visit www.ibef.org
UTTARAKHAND

INDUSTRIAL
INFRASTRUCTURE
INDUSTRIAL INFRASTRUCTURE

     Prime Minister's Employment Generation Programme (PMEGP)
     Schemes                                                                                    Industrial Estates in the State

                         Projects (US$          Utilized (US$           Employment
         Year                                                                                     Industrial Estates                 Area (Acre)        Location
                            million)               million)              generated

        2015-16              1,136                   2.41                   6,161                 IT Park Dehradun                        -             Dehradun
                                                                                                  Pharma City, Selaqui Industrial
        2016-17              1,345                   2.94                   9,890                                                        50             Dehradun
                                                                                                  Area

        2017-18              1,613                   3.99                  12,904                 Integrated Industrial Estate          2,034            Haridwar

       2018-19*              1,501                   3.95                  12,008                 Integrated Industrial Estate          3,339           Pantnagar

                                                                                                  Integrated Industrial Estate
                                                                                                                                         311             Kashipur
      Floriculture Chaffi is a Joint Venture between the Dutch government                        (Escort Farm)
       & Uttarakhand government to manufacture & process the planting                             SIIDCUL Phase II, Integrated
       material of flowers such as chrysanthemum, tulips, zantedeschia,                                                                 1760             Sitarganj
                                                                                                  Industrial Estate
       lilium & gladioli.
                                                                                                  Sigaddi Growth Centre                  100             Kotdwar
      The alliance aims to reduce the reliance on imports of flower bulbs &                      IIE Bhimtal                             -              Nainital
       meet the demand of cut-flower growers & exporters in India. The
       production facility in Bhimtal, equipped with Dutch machinery &                            ESIPL Sitarganj                         -              Sitarganj
       technology, has an annual production capacity of 20 million flower                        Moreover, the establishment of new industries in Khurpia, Sitarganj,
       bulbs. Moreover, the company can produce 2 million plants annually                         NEPA and Parag, has also been proposed by the state government
       in the tissue culture laboratory.                                                          in order to keep a check on migration from hills as well as for
                                                                                                  addressing and minimising the problem of unemployment, in the
                                                                                                  state.

 Source: State Infrastructure and Industrial Development Corporation of Uttarakhand Limited, News article

27      UTTARAKHAND                                                                                                 For updated information, please visit www.ibef.org
UTTARAKHAND

KEY SECTORS
  ICT Industry

  Agro and Food Processing

  Floriculture and Horticulture

  Tourism
KEY SECTORS – ICT INDUSTRY … (1/2)

                                                                               Some of the key players
      Information & Communication Technology (ICT) has received special
       attention from the state government & it has been accorded the             Hiltron

       status of an industry. Several initiatives have been taken to promote      HCL Infosystems
       the ICT industry in Uttarakhand.
                                                                                  Wipro Infotech

      With the establishment of the Software Technology Parks of India           Modi Infotech Service

       (STPI) earth station at Dehradun, Uttarakhand now offers high-speed
       connectivity. There are more such earth stations planned at other
       locations. Facilities by BSNL & Reliance are also available in the
       state.

      In 2002, incorporation of Information Technology & Industrial
       Development & State Industrial Development Corporation of
       Uttaranchal Ltd. (SIDCUL), as the nodal organisation to endorse the
       growth the IT sector of the state.

29      UTTARAKHAND                                                                                  For updated information, please visit www.ibef.org
KEY SECTORS – ICT INDUSTRY … (2/2)

             Hiltron           Hiltron initially worked to promote the development of electronics and allied industries and services in
                                Dehradun, Uttarakhand.

                               It functions as an IT and communication service provider to the state under the administrative control of the
                                department of IT.

        HCL Infosystems        HCL is among the largest vertically integrated IT manufacturing companies of India. It is the largest hardware,
                                system integration, networking solutions and distribution company in India.
                               It has its manufacturing facility at Rudrapur in the SIDCUL Industrial Estate, which has an overall capacity of 2
                                million personal computers per annum.

         Wipro Infotech        Wipro Infotech is a division of Wipro Limited. It provides enterprise customers with high-value IT products,
                                software services, solutions and consulting services in India and the Middle East.
                               It has a unit at Kotdwar in Uttarakhand. The unit is spread over 5.8 acres of land with a built-up area of 75,000
                                sq ft.
                               It has fully-automated production lines designed on lean manufacturing practices and houses product
                                engineering and R&D labs for continuous innovation in products and processes.

     Modi Infotech Services    Modi Infotech is located in Haridwar. It is involved in the business of website designing, software development,
                                web-hosting, web-advertising, ERP solutions, e-commerce-based application development & educational
                                segments of the IT market.

30    UTTARAKHAND                                                                          For updated information, please visit www.ibef.org
KEY SECTORS – AGRO AND FOOD PROCESSING …
                     (1/3)

      Sugarcane, wheat, rice and potato are the key agricultural products                        Crops                     Annual production in 2017-18 (‘000 tonnes)
        of the state.
                                                                                                   Rice^                                             600.0

      For 2017-18, food grain production is targeted at 1.97 million tonnes.                      Wheat*                                            908.0

                                                                                                   Pulses^                                            42.0
      Sugarcane is the major crop produced in the state, with production of
        about 64.17 lakh tonnes in 2019-20 (as per first advance estimates).
                                                                                                   Crops                   Annual production in 2018-19** (‘000 tonnes)

      The production of oilseeds and pulses during the year 2018-19 is                            Fruits                                            670.63
        estimated to be around 11,570 metric tonnes and 40,000 metric
                                                                                                   Spices                                             40.30
        tonnes, respectively.
                                                                                                   Vegetables                                        1002.64

      The Central Government is going to provide Rs 1,500 crore (US$                              Onion**                                           44.09*
        231.69 million) for development of ‘Organic Farming’ in the state of
                                                                                                   Tomato**                                          103.85*
        Uttarakhand over 3 years. 10,000 new clusters are expected to be
        developed in this project.
                                                                                                   Kharif Crops                  Production in 2018-19 (‘000 tonnes)

      As of November 2019, 16 Agricultural Produce Market Committees                              Food grains                                        912.0
        (APMCs) are linked with the National Agriculture Market (eNAM) in
                                                                                                   Oilseeds                                           15.8
        the state.
                                                                                                   Sugarcane                                         6,565.8

      As of February 29, 2020, 16 mandis are registered online with 4,621
        traders.
 Note: ** 3 rd advance estimates for 2018-19, * as per 4th Advanced estimate, ^ - As per 1st Advance Estimates 2018-19 (Kharif only)
 Source: Indian Horticulture Database, National Horticulture Board, Directorate of Economics & Statistics, Department of Agriculture & Cooperation

31      UTTARAKHAND                                                                                                     For updated information, please visit www.ibef.org
KEY SECTORS – AGRO AND FOOD PROCESSING …
                  (2/3)

      Many Agri-Export Zones (AEZs) have already been declared under            The state has one other food mega park based in Haridwar. These
       the AEZ scheme of Government of India for products such as litchi,         two mega food parks are anticipated to contribute US$ 995.35 million
       floriculture & horticulture, herbs, medicinal plants and basmati rice.     to the GSDP of the state and expected to generate about 30,000
       A biotech park near Pant Nagar is coming up in the state.                  direct and 290,000 indirect employment opportunities in the state by
                                                                                  2020.
      Uttarakhand has been included in the difficult area category by the
       Ministry of Food Processing Industry (MoFPI) and hence units being        The government is planning to develop Uttarakhand as a

       set up in Uttarakhand are also eligible for higher incentives under        manufacturing hub for organically processed food units. Thus, it is

       the scheme of MoFPI.                                                       inviting food processing companies to come and manufacture
                                                                                  organic processed food units in the state.
      Fruits such as apples, oranges, pear, grapes peach, plum apricot,
                                                                                Status of food processing units in Uttarakhand
       litchi, mangoes and guava are widely grown in the state and
       therefore have immense potential for development of horticultural         Total established units                                    28
       crops and processing units.                                               Horticulture based units established under MM-IV
                                                                                                                                            42
                                                                                 of HMNEH
      In April 2018, the second mega food park was inaugurated at
                                                                                Food parks in Uttarakhand
       Mahuakhera Ganj village, Kashipur in Udham Singh Nagar district.
       M/s Himalayan Mega Food Park Private Ltd has been set up at Rs
                                                                                 Name of the food park            Area (acres)         Plots (nos.)
       99.96 crore (US$ 15.51 million) and will benefit 25000 farmers and
       neighbouring districts.                                                   Patanjali Mega Food Park
                                                                                                                      71.63                 25
                                                                                 Pvt. Ltd.

                                                                                 Himalayan Mega Food
                                                                                                                      50.14                 23
                                                                                 Park
 Source: Uttarakhand State Portal, News Article

32      UTTARAKHAND                                                                                For updated information, please visit www.ibef.org
KEY SECTORS – AGRO AND FOOD PROCESSING …
               (3/3)

     Britannia Industries Ltd    Britannia is one of India’s leading food product companies, with an estimated 33.0% biscuit market share. The
                                  principal activity of the company is the manufacturing and sale of biscuits, bread, cakes and dairy products like
                                  cheese, butter and milk.
                                 It has a plant in the integrated industrial estate at Pantnagar. The plant is located in Integrated Industrial Estate
                                  (IIE), Pantnagar, and the project cost incurred was US$ 12.5 million. The company employs almost 1,987
                                  people nationwide.

                                 Nestle is the world's largest and most diversified food company. It manufactures products under famous brand
        Nestle India Ltd
                                  names such as Nescafe, Maggi, Milkybar, Kit-Kat and Bar-One.
                                 It has around 280,000 employees worldwide and 500 factories in about 77 countries.
                                 In 2006, Nestle India commissioned its seventh factory at Pantnagar in Uttarakhand.

         PepsiCo India           PepsiCo established its business operations in India in 1989 and is one of the largest and fastest growing food
                                  and beverage businesses in India.
                                 It provides direct and indirect employment to over 285,000 people globally and has 38 beverage bottling plants
                                  and three food plants in India. There is a company-owned bottling plant in Bajpur, Uttarakhand, which has an
                                  installed capacity of 100,000 cases of soft drink per day.

                                 KLA Foods (India) Limited is involved in international trading in agricultural commodities. The company
     KLA Foods (India) Ltd
                                  diversified into exports of minerals and metals and is exporting large quantities of iron-ore to China.
                                 Their rice processing unit, located at Rudrapur in Uttarakhand, was founded in 1977.

33    UTTARAKHAND                                                                              For updated information, please visit www.ibef.org
KEY SECTORS – FLORICULTURE AND
                     HORTICULTURE … (1/2)

                                                                                   Policy / administrative measures in horticulture sector
      Uttarakhand has          several agro-geo-climatic   zones, making it
                                                                                       Uttarakhand University of Horticulture and Forestry was established in 2011.
         particularly conducive to commercial horticulture and floriculture. The
                                                                                        This University is continuously taking new initiatives in the fields of
         floriculture industry is being developed aggressively to meet the              extension, research and certificate level courses for the benefit of staff as
         demands of domestic as well as foreign markets. The climate of the             well as lay farmers.

         state makes it ideal for growing flowers around the year.                     Single window system has been shaped in order to smoothen clearance of
                                                                                        projects under schemes of Horticulture Mission for North East and
                                                                                        Himalayan States, National Mission on Food Processing, National
      Floriculture parks with common infrastructure facilities for sorting,
                                                                                        Horticulture Board and Agricultural and Processed Food Products Export
         pre-cooling, cold chain, processing, grading, packing and marketing            Development Authority.
         facilities have been planned to provide adequate incentives and               A weather-based crop insurance cover has been facilitated to the farmers
         facilities to the industry.                                                    producing apple, litchi, mango, tomato, potato and ginger.

      Production of loose flowers in the state increased to 2.55 MT in            Horticulture production (‘000 MT) 2018-19*
         2018-19*.
                                                                                       Fruits                                                          670.63
      In January 2018, Oil and Natural Gas Corporation (ONGC) has
         started a project on Beekeeping in Uttarakhand with an aim for an             Vegetables                                                     1002.64
         employment generation and to promote a sustainable ecosystem in
         and around the wilderness of Jim Corbett National Park.                       Spices                                                           40.30

     Key player
                                                                                       Flowers (cut)                                                    12.02

        Uttarakhand Organic Commodity Board (UOCB)
                                                                                       Honey                                                             2.80

 Note: *3rd advance estimates for 2018-19
 Source: State Horticulture Mission

34       UTTARAKHAND                                                                                      For updated information, please visit www.ibef.org
KEY SECTORS – FLORICULTURE AND
                  HORTICULTURE … (2/2)

              Total horticulture crop production (in ‘000 MT)                                         Total horticulture crop production area (in 000’ha.)

                                                                                                     320
         1,900

                                           1,955.37
                     1,908.10

                                                                                                                                               315.79
                                                                                                     310
         1,700
                                1,748.70

                                                                                         1,730.95
                                                                              1,663.56
                                                                   1,661.39
                                                        1,658.72
         1,500                                                                                       300

                                                                                                                                     303.00
                                                                                                             298.50
         1,300                                                                                       290

                                                                                                                                                                              289.93
                                                                                                                                                                   305.43
         1,100                                                                                       280

                                                                                                                                                         281.45
           900                                                                                       270

                                                                                                                           269
           700                                                                                       260
           500                                                                                       250
                     2012-13

                                2013-14

                                           2014-15

                                                        2015-16

                                                                   2016-17

                                                                              2017-18*

                                                                                         2018-19^

                                                                                                             2012-13

                                                                                                                           2013-14

                                                                                                                                     2014-15

                                                                                                                                               2015-16

                                                                                                                                                         2016-17

                                                                                                                                                                   2017-18*

                                                                                                                                                                              2018-19^
     Uttarakhand Organic                           The Uttarakhand Organic Commodity Board (UOCB) is a government body founded in 2003.
      Commodity Board                              It is supported by the state government and is located in the Dehradun.
           (UOCB)                                  UOCB advises and assists the state government in the overall strengthening and implementation of the
                                                    institutional set up. It is also engaged in the production, processing, marketing and promotion of organic farming
                                                    in the state.
                                                   The Board also focuses on promoting organic farming in the fields of land use – agriculture, horticulture, animal
                                                    husbandry, dairy, sericulture, apiculture, floriculture, herbs and medicinal plants, tea, fisheries, forest and all
                                                    related areas – for the promotion and development of organic farming in the state, and networks and liaisons with
                                                    various department of the state.
                                                   The Board provides training for organic farming to equip the farmers with the latest methods and make them
                                                    aware about the potential market for the commodities.
 Note: *3rd advance estimates
 Source: National Horticulture Board

35    UTTARAKHAND                                                                                                      For updated information, please visit www.ibef.org
KEY INDUSTRIES – TOURISM … (1/2)

      Uttarakhand is a well-renowned religious and wildlife tourism                         Tourist arrivals in Uttarakhand (in million)
        destination. In 2017(P), domestic tourist arrivals in the state were 34.36
        million and foreign tourist arrivals had crossed over 0.13 million.          40.00

      In 2018, 27.81 lakh pilgrims arrived in state for Chardham Yatra, out of      35.00

                                                                                                                                                                             34.49
        which 7.32 lakh pilgrims visited Kedarnath.

                                                                                                                                                                     31.78
                                                                                     30.00

                                                                                                                     31.11
      About 21 new places in Uttarakhand that have the potential to become

                                                                                                                                                             29.05
                                                                                                                                     28.47
        major tourist destinations. These places include Jageshwar, Baijnath,

                                                                                                                             26.81
                                                                                     25.00
        Saat Taal, Bhimtal, Patal Bhuvaneshwar, Chakori, Someshwar,

                                                                                                             23.27
                                                                                                     23.18

                                                                                                                                                     22.63
                                                                                             22.26
        Pithoragarh, Chakrata, Roopkund, Hanaul, Anson Barrage, Harshil,             20.00

                                                                                                                                             21.13
        Dhanaulti and Dayara meadow. Jauljiwi in Kumaon and Tons in
        Garhwal division are planned to be developed as adventure tourism            15.00
        destinations.

                                                                                     10.00
      Uttarakhand Tourism Policy, 2018 was revised policy, which aims at
        developing the state’s image as a safe, secure and friendly destination
                                                                                      5.00
        for tourists.

                                                                                      0.00
      The Government of Uttarakhand is also focusing on Gramin Paryatan

                                                                                                                                                                             2017(P)
                                                                                             2007

                                                                                                     2008

                                                                                                             2009

                                                                                                                     2010

                                                                                                                             2011

                                                                                                                                     2012

                                                                                                                                             2013

                                                                                                                                                     2014

                                                                                                                                                             2015

                                                                                                                                                                     2016
        Uthan Yojana to help villagers in generating products and services to
        promote tourism in the state.
 Note: P - Provisional
 Source: Ministry of Tourism

36       UTTARAKHAND                                                                                  For updated information, please visit www.ibef.org
KEY INDUSTRIES – TOURISM … (2/2)

      National parks/wildlife sanctuaries            Religious tourism in         Main tourist centres in Uttarakhand
      in Uttarakhand                                     Uttarakhand
                                                                                     Corbett                    Dhanaulti            Chopta
      Askot Sanctuary                                     Yamunotri                  Chakrata                   Ranikhet
                                                                                     Mussoorie                  Almora
      Kedarnath Sanctuary                                  Gangotri
                                                                                     Bhimtal                    Chamba
      Valley of Flowers (national park)                   Kedarnath                  Nainital                   Binsar
                                                                                     Lansdowne                  Pauri
      Nanda Devi National Park                             Badrinath
                                                                                     Valley of flowers          Auli
      Rajaji National Park                           Haridwar-Har ki Pauri
                                                                                     Kausani                    Mukteshwar

      Corbett National Park                            Hemkund Sahib

      Govind Wildlife Sanctuary

      In January 2018, to boost tourism, Centre has launched the regional connectivity scheme as ‘Udan’ which will help the low income group people to
        fly easily affordable air fares.

      In December 2019, Hello Uttarakhand, a public utility mobile app which provides multilingual translation facility to tourists to communicate with
        locals launched.

      Uttarakhand government to introduce mobile caravans or motor homes equipped with all facilities available in a house to attract tourists.

     Source: Uttarakhand Tourism Development Board

37      UTTARAKHAND                                                                                       For updated information, please visit www.ibef.org
UTTARAKHAND

KEY PROCEDURES &
POLICIES
SINGLE–WINDOW CLEARANCE MECHANISM

      The IT enabled single-window contract facility is available under a two-tier system:

        •   The District Industrial Centres (DIC) at the district-level.

        •   SIDCUL at the state-level.

      These centres are responsible for providing information and escort services to entrepreneurs. They also maintain a data bank. Single window
        mechanism increases the efficiency through time and cost savings for both the traders and the government. The mechanism offers one single
        platform wherein parties, involved in trade and transport, lodge information and the required documents at a single point of entry.

      The Government of Uttarakhand announced the implementation of single window clearance system in the MSME (medium, small and micro
        enterprises) policy introduced in 2015.

      In addition, the Uttarakhand state government introduced Uttarakhand Film Policy-2015 in October 2015, that aims at offering single window
        clearance or hassle free clearance to the requests or applications for shooting, tourism promotion, etc. For instance, the policy along with
        implementation of such mechanisms is expected to offer ease to the citizens and also generate employment opportunities.

      Approvals for establishment of ventures is given in 15 days and the deadline for approvals has been set at 30 days. All approvals are provided
        online.

      State government has proposed an investment plan of Rs 554.00 crore (US$ 85.96 million) through single window system, which will result in
        employment generation opportunities for around 500 people.

39      UTTARAKHAND                                                                                    For updated information, please visit www.ibef.org
KEY INVESTMENT PROMOTION OFFICES … (1/2)

     Agency                                                      Description                                                    Contact information

                       SIDCUL, a Government of Uttarakhand enterprise, was incorporated as a limited company in
                        2002. It has equity participation from the Union Bank of India (UBI), the Oriental Bank of
                        Commerce (OBC) and Small Industries Development Bank of India (SIDBI).

      State            SIDCUL functions as the nodal agency of the state to administer all existing Government of
                                                                                                                                  29, IIE (IT Park)
     Infrastructure     India (GoI) and Government of Uttarakhand schemes for industrialisation and industrial
                                                                                                                               Sahastradhara Road
     and Industrial     promotion. The corporation provides the industrial units with the requisite information and              Dehradun-248001
     Development        guides them on the approvals needed for potential investors. It is a multipurpose company for         Phone: 91-135-2708100,
     Corporation                                                                                                                2607292, 2608092
     of                 industrial promotion investment and infrastructure development.
                                                                                                                               Fax: 91-135-2708 109
     Uttarakhand       The corporation’s key aim is to promote industrial development in the state; provide financial        Website: www.sidcul.com
     Limited
                        assistance by way of debt, equity, or venture capital; develop infrastructure; and assist private
     (SIDCUL)
                        initiatives in the industry. It also implements and manages projects and provides specialised
                        consultancy for finances and construction. It allows the industries and infrastructure projects in
                        the state to be developed either directly or through special purpose vehicles, joint ventures, and
                        assisted companies, among others.
                                                                                                                               Directorate of Industries
                                                                                                                                    Industrial Area
     Uttarakhand                                                                                                                      Patel Nagar
     Handloom &        Uttarakhand Handloom & Handicraft Development Council is a registered council constituted by              Dehradun-248001
     Handicraft                                                                                                                      Uttarakhand
                        the state government. The council acts as a facilitator to motivate, guide and organise artisans      Phone: 91-135-2728 227,
     Development
                        and provide common platforms for direct interactions between creators and connoisseurs,                        2728272
     Council
                        producers and buyers.                                                                                   Fax: 91-135-2728 226
     (UHHDC)                                                                                                                           Website:
                                                                                                                             www.uttarakhandcrafts.com

40    UTTARAKHAND                                                                                   For updated information, please visit www.ibef.org
KEY INVESTMENT PROMOTION OFFICES … (2/2)

     Agency                                                            Description                                              Contact information

                                                                                                                               Industries Association of
                                                                                                                                     Uttarakhand
                                  IAU is an apex body of small and medium scale industries of Uttarakhand. IAU is           Mohabelwala Industrial Area
     Industries Association of     committed to the development of the state and its small entrepreneurs. It follows a            Dehradun - 248110
                                                                                                                               Phone: 91-135-2640 530
     Uttarakhand                   two-tier system at the city-level and operates through the respective chapters. The          Fax: 91-135-2643 382
     (IAU)                         thrust and focus of IAU is taking initiatives to help the existing industry and attract              E-mail:
                                   new industries in Uttarakhand.                                                            info@iauonline.in,iauuttarak
                                                                                                                                   hand@gmail.com
                                                                                                                              Website: www.iauonline.in

                                                                                                                             SIDCUL Building, 1st floor
     Information Technology                                                                                                    IT Park, Shasthradhara
                                  The ITDA is an independent and autonomous body to guide and monitor various                          Road
     Development Agency
                                   projects and provide expert inputs, monitor, evaluate and execute the state's IT           Dehradun, Uttarakhand
     (ITDA)                                                                                                                   Phone: 91-135-2708 122
                                   initiatives and projects under the National e-Governance Plan (NeGP).
                                                                                                                                Fax: 91-135-2708 174
                                                                                                                             Website: www.itda.uk.gov.in

41    UTTARAKHAND                                                                                   For updated information, please visit www.ibef.org
KEY APPROVALS REQUIRED

     List of approvals and clearances required                                         Departments to be consulted

     Prior to setting up the unit

     Registration                                                                            Industries Department

                                                                State Infrastructure and Industrial Development Corporation of Uttarakhand Limited
     Allotment of land/shed
                                                                                                      (SIDCUL)

     Power load approval for construction load                                      Uttarakhand State Electricity Department

     Approval for construction of building activity under the
                                                                                           Chief Inspector of Factories
     Factories Act

     No-Objection Certificate                                                             Fire and Forest Departments

     Provisional trade tax registrations                                              Central and State Excise Departments

     Registration under the Central Sales Tax (CST) Act,
                                                                                      Central and State Excise Departments
     1956

      Before commencement of production

     Environmental clearances                                            Uttarakhand Environment Protection and Pollution Control Board

     No-objection Certificate                                                             Fire and Forest Departments

     Permanent trade tax Registration                                                        Trade Tax Department

     Registration under CST Act                                                       Central and State Excise Departments

42     UTTARAKHAND                                                                             For updated information, please visit www.ibef.org
COST OF DOING BUSINESS IN UTTARAKHAND

     Parameter                                                                                                              Cost estimate

     Industrial land purchase (per sq ft)                                                                                 US$ 4 to US$ 8.5

     Office space rent (per sq ft)                                                                          Dehradun: US$ 18 to US$ 170 per month

     Residential rent (2,000 sq ft)                                                                         Dehradun: US$ 270 to US$ 450 per month

     Five-star hotel room rent (per night)                                                                        Mussoorie: US$ 100 to US$ 300

     Power (industrial)                                                                                             US 5.64-6.55 cents per kWh

     Labour (minimum wage per day)
        Unskilled:                                                                                                         US$ 3.45-18.2
        Semi-skilled:                                                                                                      US$ 3.78-18.38
        Skilled:                                                                                                           US$ 4.19-18.7
        Highly skilled:                                                                                                     US$ 17.5-19
                          Source: Ministry of Labour and Employment, Government of India, Uttarakhand Power Corporation Limited, Industry sources, TechSci Research Research

43   UTTARAKHAND                                                                                              For updated information, please visit www.ibef.org
STATE ACTS & POLICIES … (1/2)

                              Objectives

                               To increase the employability of workers, competitiveness of enterprise, and inclusiveness of growth
         Policy for Skill
         Development &         To increase the employment for achieving sustainable development goal of less than 4% unemployment rate
     Entrepreneurship 2018                                                                                                                 Read more
                               To improve productivity & competitiveness at the workplace

                               To encourage investments and incubation in start-up sector of the state.

      Start-up Policy 2018     To establish Uttarakhand as the entrepreneurship capital of India

                                                                                                                                        Read more

                               To promote tourism and develop it as a major source of employment and revenue generation
      Tourism Policy 2018      To ensure necessary basic amenities at all tourist destinations like- parking, toilets, ATMs, dispensaries, internet
                                and telecom facilities, etc.                                                                            Read more

                               To attract investment in the micro, small and medium enterprise sector

       MSME Policy-2015        The policy aims at stopping rural-to-urban migration and boost entrepreneurs

                               To develop remote and flood hit areas of Uttarakhand for overall development                            Read more

       Mega Industrial and     To provide assistance to dairy and textile processing units in the state of Uttarakhand .
     Investment Policy 2015    To promote the textile industry of Uttarakhand through provision of subsidies and rebates on power bills
                                                                                                                                            Read more

44    UTTARAKHAND                                                                                For updated information, please visit www.ibef.org
STATE ACTS & POLICIES … (2/2)

                                   Objectives

                                    To attract public and private investments in the solar power projects for promotion of solar energy in the state
     Solar Energy Policy-2018
                                    The policy aims to setup 200 MW of solar power plants by 2019-20                                          Read more

                                    To set up industrial hubs in the state and attract investments for industrialisation in the hilly areas
     Industrial Hill Policy 2011
                                    In 2012, the state government amended the policy and the effective period was extended from 2018 to 2025
                                                                                                                                          Read more

         Information and            To encourage use of IT tools in the government for management and decision support systems
         Communication
                                    To offer easy access to consumer applications of ICT
     Technology & Electronics
                                                                                                                                               Read more
        Policy 2016-2025            To attract private sector initiatives for development of IT infrastructure in the state

       Policy for Harnessing        To utilize the natural renewable resources of the state for electricity
        Renewable Energy                                                                                                                        Read more
      Sources in Uttarakhand        To supply energy to agriculture, industry, commercial and household sectors.

     Upcoming Policies

     Organic Agricultural Act, New Mining Policy, New Film Policy

45      UTTARAKHAND                                                                                     For updated information, please visit www.ibef.org
UTTARAKHAND

ANNEXURE
ANNEXURE…(1/2) - SOURCES

                          Data                                                Sources

     GSDP (state)                                  MOSPI, Directorate of Economics and Statistics (Uttarakhand)

     Per capita GSDP figures                       MOSPI, Directorate of Economics and Statistics (Uttarakhand)

     GSDP (India)                                  MOSPI, Directorate of Economics and Statistics (Uttarakhand)

     Installed power capacity (MW)                       Central Electricity Authority, as of November 2019

     Wireless subscribers (No)                       Telecom Regulatory Authority of India, as of October 2019

     Internet subscribers (Mn)                         Telecom Regulatory Authority of India, as of June 2019

     National highway length (km)                   NHAI, Roads and Building Department - Government of India

     Airports (No)                                                    Airports Authority of India

     Literacy rate (%)                                                      Census 2011

     Birth rate (per 1,000 population)                             SRS Bulletin, September 2017

     Cumulative FDI equity inflows (US$ billion)   Department for Promotion of Industry and Internal Trade (DPIIT)

     Operational PPP projects (No)                            Ministry of Finance, Government of India

47      UTTARAKHAND                                                             For updated information, please visit www.ibef.org
ANNEXURE…(2/2) - EXCHANGE RATES

     Exchange Rates (Fiscal Year)                                              Exchange Rates (Calendar Year)

                 Year INR                          INR Equivalent of one US$               Year                  INR Equivalent of one US$

                  2004–05                                    44.95                         2005                             44.11
                  2005–06                                    44.28                         2006                             45.33
                  2006–07                                    45.29                         2007                             41.29
                  2007–08                                    40.24                         2008                             43.42
                  2008–09                                    45.91
                                                                                           2009                             48.35
                  2009–10                                    47.42
                                                                                           2010                             45.74
                  2010–11                                    45.58
                                                                                           2011                             46.67
                  2011–12                                    47.95
                                                                                           2012                             53.49
                  2012–13                                    54.45
                                                                                           2013                             58.63
                  2013–14                                    60.50
                                                                                           2014                             61.03
                  2014-15                                    61.15
                                                                                           2015                             64.15
                  2015-16                                    65.46
                  2016-17                                    67.09                         2016                             67.21

                  2017-18                                    64.45                         2017                             65.12

                  2018-19                                    69.89                         2018                             68.36

                  2019-20                                    70.49                         2019                             69.89

 Source: Reserve Bank of India, Average for the year

48     UTTARAKHAND                                                                            For updated information, please visit www.ibef.org
DISCLAIMER

     India Brand Equity Foundation (IBEF) engaged TechSci Research to prepare this presentation and the same has been prepared by TechSci
     Research in consultation with IBEF.

     All rights reserved. All copyright in this presentation and related works is solely and exclusively owned by IBEF. The same may not be reproduced,
     wholly or in part in any material form (including photocopying or storing it in any medium by electronic means and whether or not transiently or
     incidentally to some other use of this presentation), modified or in any manner communicated to any third party except with the written approval of
     IBEF.

     This presentation is for information purposes only. While due care has been taken during the compilation of this presentation to ensure that the
     information is accurate to the best of TechSci Research and IBEF’s knowledge and belief, the content is not to be construed in any manner
     whatsoever as a substitute for professional advice.

     TechSci Research and IBEF neither recommend nor endorse any specific products or services that may have been mentioned in this presentation
     and nor do they assume any liability or responsibility for the outcome of decisions taken as a result of any reliance placed on this presentation.

     Neither TechSci Research nor IBEF shall be liable for any direct or indirect damages that may arise due to any act or omission on the part of the user
     due to any reliance placed or guidance taken from any portion of this presentation.

49      UTTARAKHAND                                                                                     For updated information, please visit www.ibef.org
You can also read