DELHI THE HEART OF INDIA - RED FORT, NEW DELHI - IBEF Presentataion

Page created by Joan Richardson
 
CONTINUE READING
DELHI THE HEART OF INDIA - RED FORT, NEW DELHI - IBEF Presentataion
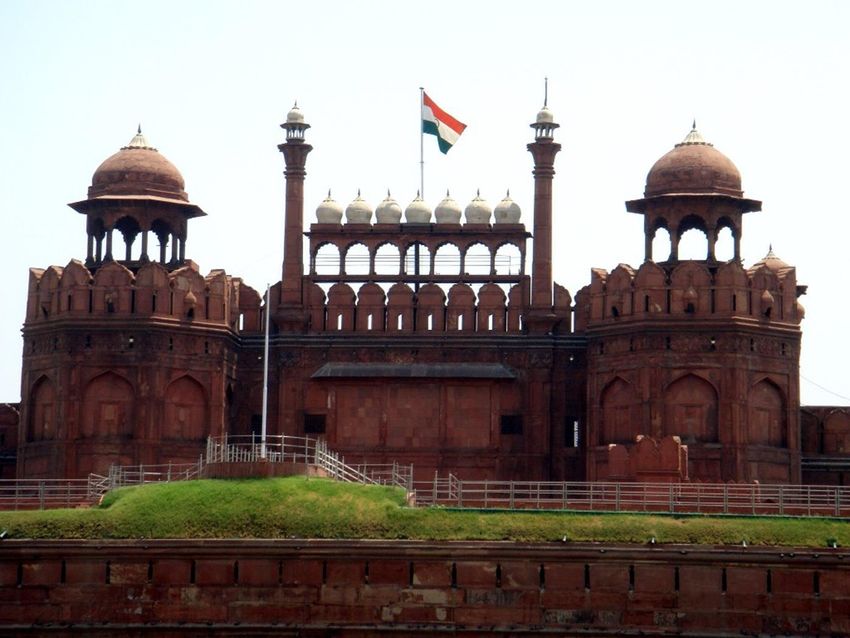
RED FORT, NEW DELHI

 DELHI
 THE HEART OF INDIA

For updated information, please visit www.ibef.org               January 2019
DELHI THE HEART OF INDIA - RED FORT, NEW DELHI - IBEF Presentataion
Table of Content

  Executive Summary .…………….……..…....3

  Introduction ……..……………….………...….4

  Economic Snapshot ………………..….…….9

  Physical Infrastructure ………..……...........15

  Social Infrastructure ...................................22

  Industrial Infrastructure ……..………..........25

 Key Sectors ………….…………….…..…...28

 Key Procedures & Policies….……………...36

 Annexure.………….……..…........................51
DELHI THE HEART OF INDIA - RED FORT, NEW DELHI - IBEF Presentataion
EXECUTIVE SUMMARY

                                                Delhi is one of the fastest growing states of the country.
    Strong economic growth                      At current prices, the gross state domestic product (GSDP) of Delhi increased at a CAGR (in Rs) of 12.20 per
                                                 cent between 2011-12 and 2017-18 to reach Rs 6.86 trillion (US$ 105.96 billion).

    Attractive real estate                      Government focus towards affordable housing is boosting the growth of the real estate sector in the state.
    industry                                    Real estate sector contributed around 28.9 per cent to Delhi’s GSVA in 2017-18.

                                                Owing to its location, connectivity and rich cultural history, Delhi has always been a prime tourist attraction of
                                                 the country. Delhi is also a key arrival/departure point for both foreign & Indian nationals. Delhi is among the
    Growing tourism industry                     top tourist destinations in India.

                                                The number of domestic tourists visiting the state is gradually rising; Delhi was also ranked the best tourist
                                                 destination in India in 2017.

                                                The state has set up a single window approval mechanism to facilitate entrepreneurs in obtaining clearance
                                                 from various departments/agencies for the establishment of industrial enterprises in the National Capital
    Policy support                               Territory (NCT) of Delhi.

                                                The new Industrial Policy 2010-21 aims to provide a conducive environment for knowledge based and hi-tech
                                                 IT/ITeS industries in Delhi.

    Note: GSVA – Gross State Value Added
    Source: State Budget, Ministry of Tourism, Central Statistics Office, *Hotelivate India State Ranking Survey 2017

3        DELHI                                                                                                          For updated information, please visit www.ibef.org
DELHI THE HEART OF INDIA - RED FORT, NEW DELHI - IBEF Presentataion
DELHI

INTRODUCTION
DELHI FACT FILE

      Delhi is the capital of India and also a state for administrative
         purposes. It is one of the largest metropolises in the country. Delhi
         shares its borders with the states of Uttar Pradesh and Haryana.

      Delhi has a cosmopolitan culture with a mix of languages in use.
         English & Hindi are commonly spoken for everyday transactions.
         Punjabi, Bihari, Haryanvi, etc., are the other languages used.

      The state of Delhi is divided into 33 sub-divisions under 11 districts.
         The Union Government’s area is managed by the New Delhi
         Municipal Council (NDMC).                                               Maps of India

      The National Capital Region (NCR)             of Delhi includes the       Parameters                                              Delhi
         neighbouring cities of Gurgaon, Noida, Ghaziabad, Faridabad,            Geographical area (sq km)                               1,483
         Neharpar (Greater Faridabad), Greater Noida, Sonepat, Panipat,
                                                                                 Administrative districts (No)                             11
         Karnal, Rohtak, Bhiwani, Rewari, Baghpat, Meerut, Alwar, Bharatpur
                                                                                 Population density (persons per sq km)                  12,591
         and other nearby towns
                                                                                 Total population (million)                               16.8

                                                                                 Male population (million)                                 9.0

                                                                                 Female population (million)                               7.8

                                                                                 Sex ratio (females per 1,000 males)                      868

                                                                                 Literacy rate (per cent)                                 86.2
    Source: Delhi Economic Survey, Census 2011

5        DELHI                                                                                       For updated information, please visit www.ibef.org
ADVANTAGE DELHI

                         Political and economic hub                                       Attractive avenues of investment
       As Delhi is the seat of Central Government, it has an                 Delhi has emerged as a key state with immense scope for
        important position in the country in terms of formulation of           development of the service industry such as BFSI, IT and
        policies. It has also become an important centre of trade and          ITeS, and consulting, among others.
        commerce, as a number of key industry associations operate            It has an attractive real estate market & is a preferred
        in the state. The state also hosts several trade conventions &         tourist destination. Many global corporations have offices
        fairs throughout the year.                                             in the state.
                                                                              The state has a huge potential for agrochemical-based
                                                                               products. Demand is rising in Haryana, UP, Rajasthan,
                                                                               Punjab and major NCR areas like Ghaziabad, Noida,
                                                                               Gurgaon, Meerut & Faridabad.

                                                                     Advantage
                                                                       Delhi
                               Rich skill pool                                            Policy and infrastructure support
       Delhi has a large skill base; 30 per cent of the workforce is         Delhi has a stable political environment with a single party
        qualified for occupations such as engineering, medicine, law,          government. The Delhi Government is committed towards
        and consultancy.                                                       creating a progressive business environment.
       As Delhi is the country’s capital & has ample facility support, it    A range of fiscal & policy incentives are proposed under
        attracts skilled & semi-skilled labour from across the country.        the Industrial Policy for Delhi.
        It houses a few of the country's most prestigious institutes
                                                                              Delhi has a well developed social, physical and industrial
        such as IIT, IIFT, FMS & AIIMS.
                                                                               infrastructure. It has wide roads, an international airport &
       Among all states, Delhi has the largest share of skilled               a well developed network of rail & metro infrastructure.
        workforce, making it suitable for knowledge-based economic             The state has more than 100 per cent telecom penetration
        activities such as IT/ITeS, designing, R&D and financial               & high internet penetration.
        services.

6   DELHI                                                                                       For updated information, please visit www.ibef.org
STATE VISION 2021

                                               Housing for urban poor
                                               Regularise unauthorised colonies.                    Upgradation & modernisation of existing
                                               Optimum utilisation of available                      industries.
                                               resources for housing.                               Recognition & inclusion of new industries.
                                               Enhancement of ground coverage.

                                                                              Shelter             Industry                             Alternate source of energy.
               Locating new school sites adjacent                                                                                     Power, drainage & waste
                to parks/playgrounds.                                                                                                   management.
               Provision for vocational facilities.        Educational                                        Infrastructure
                                                                                     Vision 2021                                       Building regulations for safety of
                                                             facilities                                        development
               Rationalisation of planning norms                                                                                       structures as per seismic zone.
                with enhanced floor area.                                                                                              Land use zoning as per
                                                                                                             Health                     microzonation.
                                                                  Transportation          Trade &        infrastructure
                                                                                         commerce

                                   Development of multilevel &                                                           Achieve norms of 5 beds per
                                    underground parking space.                                                             1,000 population.
                                                                            Provisions for service &
                                   Integrated multimodal public                                                          Enhancement of FAR for
                                    transport system.                       repair activities.                            hospitals & other facilities.
                                                                            Integrated freight complexes & wholesale
                                                                             markets.
                                                                            Develop district & community centres.

    Source: Delhi Development Authority

7        DELHI                                                                                                         For updated information, please visit www.ibef.org
DELHI IN FIGURES

     Delhi’s Contribution to Indian Economy (2017-18)                                             Physical Infrastructure in Delhi

     Parameter                                      Delhi                     India               Parameter                                   Delhi                      India
     GSDP as a percentage of                                                                      Installed power capacity
                                                     4.10                    100.0
     all states’ GSDP                                                                             (MW) (as of December                      7,234.48                 349,288.22
     GSDP growth rate (in Rs)                                                                     2018)
                                                    11.22                     9.80
     (%)
                                                                                                  Wireless subscribers (Mn)
                                                                                                                                              51.06                    1,171.76
     Per capita GSDP (US$)                          5,571                   1,975.05              (as of November 2018)

      Social Indicators                                                                           Internet subscribers (Mn)
                                                                                                                                              32.93                     560.01
                                                                                                  (as of September 2018)
      Parameter                                      Delhi                    India
                                                                                                  National highway length
      Literacy rate (%)                              86.2                      73.0                                                             79                     122,432
                                                                                                  (km) (February 2018)
      Birth rate (per 1,000
                                                     15.5                      20.4               Airports (No)                                 2                         129
      population) (2017)

      Industrial Infrastructure                                                                   Investments (as of June 2018)

      Parameter                                      Delhi                     India              Parameter                                      Delhi1                    India

      Approved SEZs                                     2                       420               Cumulative FDI equity
                                                                                                  inflows since April 2000                        79.76                   389.72
                                                                                                  (US$ billion)

    Note: GSDP, per capita GSDP figures are taken at current prices, Exchange Rate used is average of 2017-18, i.e. USD = INR 64.45 1Including part of Uttar Pradesh and Haryana, PPP:
    Public-Private Partnership, SRS: Sample Registration System, For sources refer to annexure

8         DELHI                                                                                                         For updated information, please visit www.ibef.org
DELHI

ECONOMIC SNAPSHOT
ECONOMIC SNAPSHOT – GSDP

                                    GSDP of Delhi at Current Prices                                                        Per Capita GSDP of Delhi at Current Prices

         120                                    CAGR (in Rs) 12.20%                                            8   6,000                                                                                                     4,00,000
                                                                                                                                                         CAGR (in Rs) 10.09%
                                                                                                               7                                                                                                             3,50,000

                                                                                                                                                                                                                     5,596
         100

                                                                                                                                                                                                                 3,60,644
                                                                                                                   5,000

                                                                                                     106.44
                                                                                                      6.86

                                                                                                                                                                                                      3,30,490
                                                                                                               6

                                                                                                                                                                                                       4,926.1
                                                                                                                                                                                                                             3,00,000

                                                                                            6.17
                                                                                           91.94

                                                                                                                                                                                            4,571.8
                                                                                                                                                                               4,503.8

                                                                                                                                                                                          2,99,269
           80                                                                                                      4,000

                                                                                                                                    4,223.8
                                                                                 83.73
                                                                                                               5

                                                                                                                                                                  4,162.1
                                                                                                                                                     4,154.9
                                                                                  5.48
                                                                                                                                                                                                                             2,50,000

                                                                                                                                                                            2,75,410
                                                                  80.93

                                                                                                                                                               2,51,806
                                                                 4.95
                                                      73.38
                                         71.88
                   71.70

           60                                                                                                  4   3,000                                                                                                     2,00,000

                                                                                                                                               2,26,236
                                                     4.44

                                                                                                                            2,02,532
                                      3.91

                                                                                                               3                                                                                                             1,50,000
                             3.44

           40                                                                                                      2,000
                                                                                                               2                                                                                                             1,00,000
           20                                                                                                      1,000
                                                                                                               1                                                                                                             50,000
            0                                                                                                  0      0                                                                                                      0
                   2011-12

                                      2012-13

                                                     2013-14

                                                                 2014-15

                                                                                 2015-16

                                                                                           2016-17

                                                                                                     2017-18

                                                                                                                            2011-12

                                                                                                                                               2012-13

                                                                                                                                                               2013-14

                                                                                                                                                                            2014-15

                                                                                                                                                                                          2015-16

                                                                                                                                                                                                      2016-17

                                                                                                                                                                                                                 2017-18
                                                   US$ billion             Rs trillion                                                                                      US$          Rs

          At current prices, the Gross State Domestic Product of Delhi                                             The state’s per capita GSDP in 2017-18 was Rs 360,644 (US$
             reached Rs 6.86 trillion (US$ 106.44 billion) in 2017-18.                                                5,596).                  .

          The state’s GSDP (in Rs) increased at a Compound Annual                                                  The per capita GSDP (in Rs) increased a CAGR of 10.09 per
             Growth Rate of 12.20 per cent between 2011-12 and 2017-18.                                               cent between 2011-12 and 2017-18.

     Note: exchange rates used are averages of each year, data is expected to be updated from Delhi Economic Survey 2018-19
     Source: MOSPI

10       DELHI                                                                                                                                For updated information, please visit www.ibef.org
ECONOMIC SNAPSHOT – NSDP

                             NSDP of Delhi at current prices                                                            Per Capita NSDP of Delhi at current prices

         120                             CAGR (in Rs) 12.15%                                                7   6,000                                                                                           3,50,000
                                                                                                                                                   CAGR (in Rs) 10.04%

                                                                                                                                                                                                     3,29,093
         100                                                                                                6                                                                                                   3,00,000

                                                                                                     6.26
                                                                                                                5,000

                                                                                                                                                                                          3,00,793

                                                                                                                                                                                                     5,106
                                                                                                 97.13
                                                                                          5.61
                                                                                                            5                                                                                                   2,50,000

                                                                                                                                                                              2,71,305

                                                                                                                                                                                         4,483
           80                                                                                                   4,000

                                                                              4.97

                                                                                                                                                                  2,49,635
                                                                                     83.68

                                                                                                                                                                              4,145
                                                                                                                                                                    4,082
                                                                                                                                                       2,29,619
                                                            4.49

                                                                                                                                3,866
                                                                                                            4

                                                                          75.90
                                                                                                                                                                                                                2,00,000

                                                                                                                                                         3,795
                                                                                                                                             3,794
                                                          73.36

                                                                                                                                         2,06,590
                                                4.05

           60                                                                                                   3,000
                                              66.92
                               65.64
                     65.62

                                                                                                                         1,85,361
                               3.57

                                                                                                            3                                                                                                   1,50,000
                   3.15

           40                                                                                                   2,000
                                                                                                            2                                                                                                   1,00,000
           20                                                                                               1   1,000                                                                                           50,000

            0                                                                                               0      0                                                                                            0
                   2011-12

                               2012-13

                                              2013-14

                                                          2014-15

                                                                          2015-16

                                                                                     2016-17

                                                                                                 2017-18

                                                                                                                         2011-12

                                                                                                                                         2012-13

                                                                                                                                                       2013-14

                                                                                                                                                                  2014-15

                                                                                                                                                                              2015-16

                                                                                                                                                                                         2016-17

                                                                                                                                                                                                     2017-18
                                            US$ billion             Rs trillion                                                                                   US$        Rs

          At current prices, the Net State Domestic Product of Punjab                                           The state’s per capita NSDP in 2017-18 was Rs 329,093 (US$
             reached Rs 6.26 trillion (US$ 97.13 billion) in 2017-18.                                              5,106).               .

          The state’s NSDP (in Rs) increased at a Compound Annual                                               The per capita NSDP (in Rs) increased a CAGR of 10.04 per
             Growth Rate of 12.15 per cent between 2011-12 and 2017-18.                                            cent between 2011-12 and 2017-18.

     Note: exchange rates used are averages of each year, data is expected to be updated from Delhi Economic Survey 2018-19
     Source: MOSPI

11       DELHI                                                                                                                          For updated information, please visit www.ibef.org
ECONOMIC SNAPSHOT – PERCENTAGE
                    DISTRIBUTION OF GSVA

      Commerce & trade contribute more to Delhi’s economy than                       GSVA composition by sector at current prices
        manufacturing & agriculture.
                                                                               100%
      In 2017-18, the tertiary sector accounted for 85.92 per cent of the                      83.42%       CAGR         85.92%
                                                                               90%
        GSVA of Delhi, at current prices, followed by the secondary sector,
        which contributed 12.04 per cent and primary sector which              80%                           9.86%

        contributed 2.04 per cent.                                             70%

      Tertiary sector in Delhi grew at a CAGR (in Rs) of 12.16 per cent       60%

        from 2011-12 to 2017-18 while the secondary and primary sector         50%
        grew at a CAGR of 10.06 per cent and 2.06 per cent during the same
                                                                               40%
        time period.
                                                                                                             7.57%
                                                                               30%

                                                                               20%

                                                                                                13.09%
                                                                               10%                                        12.04%
                                                                                                             7.85%
                                                                                                                                    2.04%
                                                                                0%              3.49%
                                                                                               2011-12                    2017-18

                                                                                                Primary   Secondary   Tertiary

     Note: data is expected to be updated from Delhi Economic Survey 2018-19
     Source: MOSPI

12       DELHI                                                                               For updated information, please visit www.ibef.org
ECONOMIC SNAPSHOT – FDI INFLOWS &
                             INVESTMENTS

                                                                                                         Proposed Investments
        Cumulative FDI equity inflows since April 20001 (US$ billion)
                                                                                                                                                            Proposed
          100                                                                                            Year                         IEMs filed          investments
            90                                                                                                                                          (in US$ million)
                                                                              7.66    4.07 79.76
            80
            70                                                        5.88
                                                              12.74                                       2016                            5                  11.17
            60
                                                      6.88
            50                                6.24
                                      3.22
            40                7.98                                                                        2017                            5                  30.88
            30    25.09

            20
                                                                                                          2018 (up to November)           7                  48.79
            10
             0

                                                                                              FY01-19*
                               FY12

                                       FY13

                                               FY14

                                                       FY15

                                                               FY16

                                                                       FY17

                                                                               FY18

                                                                                      FY19*
                   FY01-11

       According to the Department of Industrial Policy & Promotion (DIPP), cumulative FDI inflows to Delhi1 during April 2000–June 2018 amounted to
          US$ 79.76 billion.

       During 2018 (up to November), seven IEMs with proposed investments worth Rs 352 crore (US$ 48.79 million) were filed in Delhi.

     Note: 1Including part of Uttar Pradesh and Haryana; *up to June 2018, IEMs – Industrial Entrepreneur Memorandum Intentions
     Source: Department Of Industrial Policy & Promotion,

13        DELHI                                                                                                          For updated information, please visit www.ibef.org
ECONOMIC SNAPSHOT – EXPORT TRENDS

                Merchandise Exports from Delhi (US$ billion)                                    Major Commodities Exported in FY19*

       12.00                                                                                                                      Electric Machinery &
                                                                                                                                  Equip.

       10.00                                                                                                                      RMG Manmade Fibres
                                          10.55
                   10.03                                                                                      17.66%
                                   9.30
         8.00                                         8.71                                                                        RMG Cotton (incl
                                                                                                                                  accessories)
                                                                                                                    9.94%         Gold
         6.00                                                    6.44                     51.29%
                                                                                                                    6.55%
         4.00                                                                                                                     RMG of other Textile
                                                                                                                                  Material
                                                                                                                  5.38%
         2.00                                                                                                                     Gold and other Precs
                                                                                                          4.08%                   Metal Jewellery
                                                                                                                    5.09%         Others
         0.00
                   FY15            FY16   FY17       FY18        FY19*

      Total merchandise exports from Delhi were US$ 8.71 billion in FY18 and have reached US$ 6.44 billion in FY19 (up to September 2018).

      Electric Machinery & Equipment, Readymade Manmade Fibres, Readymade Cotton (including accessories), Gold, Readymade other Textile
        Material and Gold and other Precious Metal Jewellery account for a majority share in the overall merchandise exports of the state.

     Note: *up to September 2018
     Source: DGCIS Analytics

14      DELHI                                                                                        For updated information, please visit www.ibef.org
DELHI

PHYSICAL
INFRASTRUCTURE
PHYSICAL INFRASTRUCTURE – ROADS

                                                                              Growth of road network in Delhi by agency (in lane km)
       The road network of Delhi serves over 10 million vehicles, as per
         Delhi Economic Survey 2017-18. National Highways Authority of         Agency                                       2016-17

         India, Public Works Department, Municipal Corporations of Delhi,      East DMC                                     162.24*
                                                                               South                                        9,592*
         New Delhi Municipal Council, Delhi Cantonment Board & Delhi
                                                                               North DMC                                   3,272.65*
         Development Authority are the responsible authorities for the
                                                                               New Delhi Municipal Council                   1,290
         development & maintenance of road network in Delhi. Details of
                                                                               Public Works Department
         roads maintained by different agencies is provided in the table.
                                                                               National highways                              430

       Government of India has undertaken highway projects worth Rs           Other roads                                   6,308
                                                                               DSIIDC                                        1,434
         34,000 crore (US$ 5.29 billion) to decongest the national capital.
                                                                               I&FC                                           40
       As per State Budget 2018-19, Rs 5,145 crore (US$ 794.72) has been      DDA                                            435
         allocated for public transport including road infrastructure.

     Note: Updated data is expected in Delhi Economic Survey 2018-19
 Source: Delhi economic survey 2017-18, Annual Budget 2018-19

16        DELHI                                                                              For updated information, please visit www.ibef.org
PHYSICAL INFRASTRUCTURE – RAILWAYS

      Delhi is well connected by rail network to other parts of India. A               Delhi Metro
       significant part of trade is supported by the strong railway links.
                                                                                       Phase I                Phase II               Phase III
       New Delhi Railway Station, which is one of the busiest stations in
       the Indian Railway system, serves as the headquarters of Northern               20.23% underground     27.92% underground     33.79% underground

       Railways.                                                                                                                     66.21% elevated/at
                                                                                       72.85% elevated        70.33% elevated
                                                                                                                                     grade
      The Delhi Metro Rail Corporation (DMRC) was registered in 1995
                                                                                       6.91% at grade         1.73% at grade         Not Available
       under the Companies Act, 1956, for development of Delhi Mass
       Rapid     Transit    System      (MRTS).      DMRC       has   equal   equity
       participation from the Government of India & Government of                      Delhi Metro existing phase length
       National Capital Territory of Delhi (GNCTD). Delhi Metro is the
                                                                                       Phase                                     Length (km)
       seventh busiest metro rail network in the world with 178.9 million
       people having used the service in 2017.                                         Phase I                                      65.05

      The complete phase III of Delhi Metro is expected to become                     Phase II                                     122.36
       operational in 2020.
                                                                                       Phase III                           117.57 (after completion)

      The Board of National Capital Region Transport Corporation has
       invested US$ 3.34 billion in the Rapid Rail Transit Corridor (RRTC),
       which will operate between Delhi, Ghaziabad & Meerut, making it a
       92 km long corridor.

Source: Delhi Economic Survey 2017-18, Delhi Metro Rail Corporation

17      DELHI                                                                                            For updated information, please visit www.ibef.org
PHYSICAL INFRASTRUCTURE – AIRPORTS

      The Indira Gandhi International Airport in Delhi serves domestic and international passengers. It was the 16th busiest airport in the world in 2017
        in terms of traffic volumes. The airport handled around 65.69 million passengers in 2017-18 and 52.43 million passengers between Apr-Dec 2018.

      Terminal 3 is spread over a 500,000 square metre area & equipped with 95 immigration counters, 168 check-in counters & 78 passenger boarding
        bridges to handle 34 million passengers per annum (MPPA) & 12800 bags per hour. The planned ultimate design capacity of the airport is 100
        MPPA.

      The Indira Gandhi International Airport has been awarded the 'International Safety Award' by British Safety Council.

      The government is planning to build a second airport in the NCR region in Jewar in four phases, to be operational in the next five to six years.

     Airport indicators

                      Year                             Passengers                         Aircraft movement                   Freight handled (tonnes)
                   2011-12                             34,729,467                               345,143                               600,045
                   2012-13                             34,211,608                               280,713                               546,311
                   2013-14                             36,876,986                               290.772                               605,699
                   2014-15                             40,985,555                               300,889                               696,539
                   2015-16                             48,424,165                               344,113                               787,168
                   2016-17                             57,703,096                               397,799                               857,419
                   2017-18                             65,691,662                               441,299                               963,032
      2018-19 (up to December 2018)                    52,425,916                               351,450                               785,179

 Source: Airports Authority of India

18      DELHI                                                                                         For updated information, please visit www.ibef.org
PHYSICAL INFRASTRUCTURE – POWER

                                 Installed Power Capacity (MW)                                             Break-up of Installed Capacity as of December 2018

         8,600                                                                                                         1.42% 2.44%
         8,400

                                                            8,326.29
         8,200                                  8,258.07                                                           10.00%
         8,000
                                                                                                                                                   Thermal Power
         7,800

                                                                                    7,884.84
                                                                        7,823.00
                                                                                                                                                   Hydropower
                                    7,808.18

         7,600
                                                                                                                                                   Renewable Power
         7,400
                      7,413.00

                                                                                                                                                   Nuclear Power
         7,200

                                                                                                7,234.48
         7,000
                                                                                                                             86.15%
         6,800
         6,600
                    FY13           FY14        FY15        FY16        FY17        FY18        FY19*

      Electricity consumers in Delhi reached 5.57 million in 2016-17, of which 81 per cent were domestic consumers, 17 per cent commercial
       consumers, 1 per cent industrial consumers and 1 per cent other consumers, as per Delhi economic survey 2017-18.

      Energy requirement in Delhi was 26,373 million units between Apr-Dec 2018. Further during 2021-22, the energy requirement is expected to
       increase to 52,930 million units.

      As of December 2018, Delhi had total installed power generation capacity of 7,234.48 MW of which 6,232.35 MW was contributed by thermal
       power, 723.09 MW by hydropower, 176.21 MW by renewable power and 102.83 MW by nuclear power.

      Under its budget 2018-19, government of Delhi has allocated Rs 2,190 crore (US$ 338.28 million) for the energy sector.
      Note: *as of December 2018
      Source: Central Electricity Authority, Delhi Economic Survey 2017-18

19       DELHI                                                                                                       For updated information, please visit www.ibef.org
PHYSICAL INFRASTRUCTURE – TELECOM

      At 235.88 per cent, Delhi had the highest tele density in India as of   Telecom Infrastructure (as of November 2018)
       November 2018.
                                                                               Wireless subscribers                           51,058,036
      According to the Telecom Regulatory Authority of India (TRAI), Delhi
                                                                               Wire-line subscribers                           3,203,511
       had 51.06 million wireless subscribers and 3.20 million wire-line
       subscribers as of November 2018.                                        Internet subscribers1 (million)                  32.93

      The major telecom operators in the state are Reliance Jio, Bharti       Tele-density (%)                                 235.88

       Airtel, Idea Cellular, Vodafone and Mahanagar Telephone Nigam
       Limited (MTNL).

 Note: 1As of September 2018
 Source: Telecom Regulatory Authority of India

20      DELHI                                                                                      For updated information, please visit www.ibef.org
PHYSICAL INFRASTRUCTURE – URBAN

      About 98 per cent of the total population of Delhi lives in urban                     Population Holding Capacity of Existing Urban Area in 2021
        areas. The state has very strong electrification level & about 99 per
                                                                                             Zone                               Population (‘000)
        cent of the households had access to sanitation facilities. Under
                                                                                                            A                                 570
        State Budget 2018-19, Rs 3,106 crore (US$ 479.77 million) has
        been allocated for housing and urban development in Delhi, an                                       B                                 630

        increase of 71 per cent from revised estimates of 2017-18.                                          C                                 788

                                                                                                            D                                 813
      The population of National Capital Territory of Delhi is expected to
                                                                                                            E                                2,800
        reach 23 million by 2021. Existing urban areas will be able to
        accommodate 15.3 million out of this while new urban areas will be                                  F                                1,975

        developed to accommodate the rest of this population.                                               G                                1,955

                                                                                                            H                                1,865
      According to the Delhi 2021 Master Plan, special emphasis has
                                                                                                        Dwarka                               1,300
        been laid on improved solid-waste management policies. The short-
        term goals are capacity building with respect to financial services                             Rohini III                            160

        and performance management, effecting trial runs of collection &                              Rohini IV & V                           820
        waste-reduction schemes, developing transport, landfill sites and                                Narela                              1,620
        transfer stations for waste & focusing on biomedical & hazardous
                                                                                                          Total                              15300
        waste management programmes.

      As of January 2018, the New Delhi Municipal Council (NDMC) has
        completed 23 smart city projects.

 Source: Annual Budget 2018-19, Delhi Economic Survey 2017-18, Delhi Development Authority

21      DELHI                                                                                                   For updated information, please visit www.ibef.org
DELHI

SOCIAL
INFRASTRUCTURE
SOCIAL INFRASTRUCTURE – EDUCATION

       Higher Educational infrastructure (2017-18)                                          School Education (2016-17)

                                                                                                                                 Enrolment (‘000      Number of
       Universities                                                12                                                    Nos
                                                                                                                                   thousand)           teachers
                                                                                            Pre primary and
       Deemed to be universities                                   11                                                   2,735          20.83            28,989
                                                                                            primary schools
       Institutes of national importance                            4                       Middle schools               933           11.27            12,657
                                                                                            Secondary
       Colleges for general education                              85                                                    400           7.41              9,401
                                                                                            schools
                                                                                            Senior secondary
       Colleges for professional education                         107                                                  1,704          4.92             97,224
                                                                                            schools

        As of 2017-18, Delhi has 12 universities, 11 deemed to be universities and 85 colleges for general education. The number of schools in 2016-17
           was 5,772 while student enrolment in the same period was 4.44 million, as per Delhi Economic Survey 2017-18

        The government plans to improve learning outcomes at government schools, by creating schools of excellence in each zone from 2017 as it will
           help to mentor students on the basis of their interests.

        Under State Budget 2018-19, education received the highest share at 26 per cent. Rs 13,997 crore (US$ 2.16 billion) has been allocated to the
           education sector in 2018-19. Announcements for the education sector under Delhi Budget 2018-19:

           •   Construction of 12,748 additional classrooms and 30 new school buildings

           •   Setting up of nursery classes in 366 Sarvodaya Vidyalayas

           •   120,000 CCTV cameras to be installed in all government schools

           •   New scheme for evaluation of all schools
Note: Updated data is expected in Delhi Economic Survey 2018-19   Source: Delhi Economic Survey 2017-18, Delhi Budget 2018-19

 23        DELHI                                                                                                  For updated information, please visit www.ibef.org
SOCIAL INFRASTRUCTURE – HEALTH

      Delhi has one of the best health infrastructures in the country. The                Health Infrastructure (January 2019)
        state offers sophisticated medical care with the latest state-of-the-
                                                                                           Primary Health Centers                                     689
        art technology for treatment.
                                                                                           Sub Centers                                                674
      In addition, the Government of Delhi has made all diagnostic tests
        as well as medicines free of cost across various government.                       District Hospitals                                         96

                                                                                           Sub District Hospitals                                     132
      The Government of Delhi has allocated Rs 6,729 crore (US$ 1.04
        billion) for the development of the healthcare sector under its                    Community Health Centers                                   740

        budget 2018-19. Announcements under the budget for the
        healthcare sector are:                                                             Health indicators (SRS Bulletin Sep 2017)

        •   1,000 Mohalla Clinics to be set up in 2018-19. 530 land sites
                                                                                            Birth rate                                              15.5
            have been selected for new Mohalla Clinics.

        •   94 dispensaries to be converted into polyclinics                                Death rate                                              4.0

        •   2,546 beds to be added in seven existing hospitals
                                                                                            Infant mortality rate                                   18
        •   Mobile van clinics to be started for eye and ear care services

        •   Universal Health Insurance Scheme to be introduced. The
            scheme will cover treatment in empanelled private hospitals and
            Government hospitals.

 Source Delhi Budget 2018-19, National Health Mission, Sample Registration System September 2017

24      DELHI                                                                                                   For updated information, please visit www.ibef.org
DELHI

INDUSTRIAL
INFRASTRUCTURE
INDUSTRIAL INFRASTRUCTURE … (1/2)

      On the industrial infrastructure front, the state has undertaken a            Formally approved SEZ in Delhi
        number of development initiatives such as redevelopment of
        industrial clusters & maintenance of industrial areas under the              Project Name                              Location            Sector

        Public-Private Partnership (PPP) model.
                                                                                     Delhi State Industrial Information     Baprola village,
                                                                                                                                                     IT
                                                                                     Development Corporation Ltd.               Delhi
      The state government has initiated a set of prestigious projects,
        including those in industrial infrastructure for specific sectors, through
        the Delhi State Industrial & Infrastructure Development Corporation          Delhi State Industrial Information     Baprola village,     Gems and
        Limited (DSIIDC).                                                            Development Corporation Ltd.               Delhi            Jewellery

      The Delhi-Mumbai Industrial Corridor Development Corporation has
        finalized a policy to allot land developed by it at four sites on the        Narela Industrial Complex
        proposed 1504 Km corridor, which will enable industries to acquire
                                                                                      DSIIDC has developed 612 acres of land in Narela. The first phase
        the land for setting up units. The Centre has already invested US$             of construction of 1,800 plots is complete.
        1.07 billion in developing the projects.
                                                                                      The construction of facility centres providing shops and commercial
                                                                                       spaces has already been completed. About 50,000 trees have been
      According to the Delhi 2021 Master Plan, the state will be promoted             planted in the complex. An area of 10 acres covered under the
        as a hub of clean, high-technology & skilled economic activities.              central park is proposed to be developed as central plaza.
        Initiatives would be taken for the modernisation of existing &                Of the remaining land available in the estate, 70 acres is proposed to
        inclusion of new industries such as those related to IT/ITeS. The plan         be utilised for relocation of industries. There is also a proposal for
        emphasises industrial development without effluents, smoke and                 construction of a high-tech estate for ITeS in an area of 50 acres
                                                                                       available in the complex.
        noise pollution.

     Source: Ministry of Commerce & Industry, Department of Commerce

26      DELHI                                                                                           For updated information, please visit www.ibef.org
INDUSTRIAL INFRASTRUCTURE … (2/2)

                SEZs                                                        Industrial clusters in Delhi

       IT and ITeS SEZ-Baprola                                               Narela Industrial Complex

                                                                            Mangolpuri Industrial Area

      Gems and Jewellery SEZ-
                                                                             Kirtinagar Industrial Area
             Baprola

                                                                              Naraina Industrial Area

     IT Park, Shastri Park, DMRC                                               Okhla Industrial Area

     INDEX                           Operational
         SEZ Location
                                    Under construction
         Industrial Area Location

27     DELHI                                             For updated information, please visit www.ibef.org
DELHI

KEY SECTORS
  Agriculture and Allied Industries

  Construction and Real Estate

  IT and Other Knowledge Based Industries

  Tourism and Hospitality
KEY SECTOR – AGRICULTURAL AND ALLIED
                   INDUSTRIES… (1/2)

     Estimated area, yield & production of crops (2016-17)                                   Milk and meat production in Delhi (‘000 MT)
                     Area
                                      Annual production               Yield (kg. per
     Crop          (hectares                                                           300
                                       (metric tonnes)                  hectare)
                       )

                                                                                              284.31

                                                                                                                   280.06

                                                                                                                                       280.03

                                                                                                                                                        279.11

                                                                                                                                                                          279.11
     Wheat           19,623                   87,182                       4,473       250

     Barley            68                       184                        2,706       200

     Bajra            1,497                    3,278                       2,190       150
     Maize             34                       174                        5,118
                                                                                       100
     Jowar            3,193                    3,035                         960

                                                                                                       77.08

                                                                                                                            69.83

                                                                                                                                                69.81

                                                                                                                                                                 66.44

                                                                                                                                                                                   66.44
                                                                                       50
     Paddy            5,973                   25,891                       4,335
                                                                                        0
     Gram              25                        53                        2,120             2013-14              2014-15              2015-16          2016-17          2017-18*
                                                                                                                                    Milk Meat
     Mustard          3,608                    4,527                       1,248

      Commonly grown crops in the state are wheat, rice, jowar, bajra, mustard & vegetables. The main crop in Delhi during 2016-17 was wheat with a
        19,623 hectares of area under cultivation and production reaching 87,182 metric tonnes. Gross irrigated area in Delhi was 29,723 hectares during
        2016-17.

      As per State Budget 2018-19, a new Agriculture Policy will be prepared for development of agriculture and horticulture in Delhi.

      National Capital Region (NCR) is the country’s biggest milk market. The organised milk market in the region, estimated at five million litres per
        day, is growing at 6-8 per cent annually. There are nine principal markets and 12 different sub-markets for trade of agricultural produce in Delhi.
        The main food trade markets are located in Narela, Azadpur, Morigate, Shahdara, Keshopur, Gazipur, Najafgarh and Mehrauli.
Note: Updated data is expected in Delhi economic survey 2018-19
Source: Ministry of Agriculture, Economic Survey of Delhi, Annual budget 2018-19

29      DELHI                                                                                                  For updated information, please visit www.ibef.org
KEY SECTOR – AGRICULTURAL AND ALLIED
                INDUSTRIES… (2/2)

     Key players

                            Mother Dairy was set up in 1974 under the ‘Operation Flood Programme’. It is now a wholly owned company of
         Mother Dairy        the National Dairy Development Board (NDDB). Mother Dairy markets and sells dairy products, such as liquid
                             milk, curd, ice creams, cheese & butter under the ‘Mother Dairy’ brand, the ‘Dhara’ range of edible oils & the
                             ‘Safal’ range of fresh fruits & vegetables, frozen vegetables & fruit juices, at the national level through its sales &
                             distribution networks for marketing food items.

                            Mother Dairy milk has a market share of around 66.0 per cent in the branded sector in Delhi, where it sells 2.5
                             million litres of milk daily & undertakes its marketing operations through around 1,400 retail outlets and over 1,000
                             exclusive outlets. Furthermore, the ice cream brand of the company has around 62 per cent market share in
                             Delhi-NCR. The company has a dairy manufacturing plant at Patparganj & a fruit & vegetable plant at Mangolpuri
                             Industrial Area. It also has a distribution facility with an annual handling capacity of 200,000 tonnes of fresh fruits
                             & vegetables.

      Kohinoor Foods Ltd    It offers an extensive range of products that cater to all kinds of consumers in different parts of the world, from basmati
                             rice, ready-to-eat products, cook-in sauces & cooking pastes to spices, seasonings & frozen food. It has a strong
                             market presence not only in India but also in the US, the UK, Dubai, Canada, Japan, Australia, Singapore & other
                             European countries. It has an office in Greater Kailash in New Delhi.

          Sterling Agro     Sterling Agro Industries markets its dairy products under its brands ‘NOVA’ and ‘A-ONE’.
         Industries Ltd
                            The company’s office in Delhi is located at Pitampura. Nova products include ghee, butter oil, butter, skimmed milk
                             powder, full cream milk powder, dairy whitener, butter milk powder and milk powder blends.

30     DELHI                                                                                    For updated information, please visit www.ibef.org
KEY SECTOR – CONSTRUCTION AND REAL ESTATE
                    SECTOR … (1/2)

      The real estate market in Delhi is lucrative and attracts investors                                          Real Estate’s Contribution to Delhi’s GSVA
        from India and abroad. Owing to the advanced infrastructural base,
                                                                                                 30                                                                                                1800
        the city meets the requirements of a profitable investment.                                                                 CAGR (in Rs) 15.21%

                                                                                                                                                                                          1,695
                                                                                                                                                                                                   1600
      Real estate, ownership of dwelling & professional services

                                                                                                                                                                                         26
                                                                                                 25

                                                                                                                                                                                 1,506
        contributed Rs 1,695 billion (US$ 26 billion) to Delhi’s Gross State                                                                                                                       1400

                                                                                                                                                                       22.5
        Value Added (GSVA) in 2017-18.

                                                                                                                                                               1,323
                                                                                                 20                                                                                                1200

                                                                                                                                                             20.2
                                                                                                                                                1,164
      Delhi Development Authority has reduced the minimum area

                                                                                                                                                19.0
                                                                                                                                                                                                   1000
        requirement for farmhouses to 1 acre from 2.5 acres earlier. The
                                                                                                 15

                                                                                                                                        962
                                                                                                                                       15.9
                                                                                                                            15.1
                                                                                                          15.1
        revised norm offers owners of an estimated 2,700 farmhouses in the                                                                                                                         800

                                                                                                                          824
        city the opportunity to downsize and monetise their surplus property.

                                                                                                                    725
                                                                                                 10                                                                                                600
      Housing sales in Delhi-NCR market increased by 7 per cent year-on-
                                                                                                                                                                                                   400
        year between Jan-Sep 2018.
                                                                                                   5
                                                                                                                                                                                                   200
      Rents of premium office buildings are expected to increase 5 per
        cent annually over 2018-20 with an influx of 3 million square feet of                      0                                                                                               0
                                                                                                          2011-12

                                                                                                                          2012-13

                                                                                                                                      2013-14

                                                                                                                                                2014-15

                                                                                                                                                             2015-16

                                                                                                                                                                       2016-17

                                                                                                                                                                                         2017-18
        office space in the same period.

                                                                                                                                        US$ billion       Rs billion

     Note: exchange rates used are averages of each year, data expected to be updated by March 2019 from Ministry of Statistics and Programme Implementation (MOSPI) statistics
     Source: Delhi Economic Survey 2017-18, MOSPI, Colliers International

31      DELHI                                                                                                                 For updated information, please visit www.ibef.org
KEY SECTOR – CONSTRUCTION AND REAL ESTATE
               SECTOR … (2/2)

     Key players

                       DLF is primarily a real estate developer, rated as India's largest construction company in the sector. Its primary
           DLF Ltd      business is the development of residential, commercial & retail properties. DLF has been in this industry for over
                        60 years & has developed homes, offices, malls, SEZs, hotels & infrastructure projects. DLF developed some of
                        the 1st residential colonies in Delhi such as Krishna Nagar in East Delhi. It started off with its 1st landmark real
                        estate development project Qutub Enclave (DLF city) & then proceeded to build the Gurgaon township. Now, it
                        has pan-India presence, with its properties being developed in almost all the Tier I & II pan India. In Delhi, in the
                        commercial sector, DLF has built infrastructure in Vasant Kunj, Saket & Mayur Vihar. It has also developed some
                        office spaces. The corporate office of the company is located in Delhi.

           Unitech     Established in 1972, Unitech has operations across 22 cities in the country. The company has ventured into
                        constructing power transmission lines, highways, theme parks, steel plants, residential dwellings, indoor stadiums
                        & hotels. Unitech was the 1st real estate developer to have been certified ISO 9001:2000 in North India.

                       In Delhi, Unitech’s noteworthy achievements include the Rohini amusement park, which is spread over 62 acres in
                        Northwest Delhi. The project encompasses a shopping mall, ‘Metrowalk’, spread across 200,000 sq ft, an
                        adventure island, a world-class amusement park & a water park. The registered office of the company is located in
                        Delhi.

                       One of the oldest real estate developer companies in the NCR, Ansal API has ventured into retail shopping malls,
          Ansal API     township development, hotels, clubs, facilities management, etc. Ansal has made large deals in residential and
                        commercial properties located in Delhi-NCR, UP, Haryana, Punjab, Rajasthan, etc. The company has completed
                        several residential buildings such as Gauri Sadan, Upasana at Hailey Road & Dhawan Deep on the Jantar Mantar
                        Road at Connaught Place in New Delhi.

                       The company has constructed the ‘Ansal Plaza’ shopping mall in South Delhi, apart from several landmark high-
                        rise commercial buildings such as the Statesman House.

32     DELHI                                                                           For updated information, please visit www.ibef.org
KEY INDUSTRIES – IT AND OTHER KNOWLEDGE-
                      BASED INDUSTRIES

      There are a number of software companies in Delhi. These                                   Software Exports from STPIs in Delhi (US$ million)
        organisations are involved in the businesses of Enterprise Resource
        Planning (ERP), Structured Query Language (SQL) server, Document
                                                                                              350.00
        Management Systems, Customer Relationship Management (CRM),
        software development, Active Server Pages (ASP), web development,                                  332.33
                                                                                              300.00
        online office automation, etc.

      NASSCOM, the premier trade body and the chamber of commerce of                         250.00
        the IT and BPO industry in India, is headquartered in New Delhi.
                                                                                                                                              222.65
                                                                                              200.00                        216.80
      Enabling institutions such as Software Technology Parks of India
        (STPI), a society set up by the Ministry of Information Technology,
        Government of India, for encouraging, promoting & boosting software                   150.00
        exports from India, is located in New Delhi. Software exports from
        STPIs in Delhi were Rs 1,493 crore (US$ 222.65 million) in 2016-17.                   100.00

      As per the new Industrial Policy for Delhi 2010-21, the Government is
        keen     on   developing       &   promoting      the     hi-tech,   sophisticated,    50.00

        knowledge-based IT & ITeS industries in the state. For this, the
        Government has planned to set up ‘Centre of Excellence’ to promote                      0.00
                                                                                                          2014-15           2015-16           2016-17
        innovation & entrepreneurship in the sectors.

     Note: Information is as per latest available data
     Source: Ministry of Electronics and Information Technology

33      DELHI                                                                                               For updated information, please visit www.ibef.org
KEY SECTOR – TOURISM AND HOSPITALITY

      The metropolitan city of Delhi has always been the main tourist                        Tourist arrivals in Delhi (in millions)
        attraction of the country. The famous tourist places of the state are
                                                                                35.0
        Akshardham Temple, Azad Hind Gram, Bahai Temple, Birla Mandir,
                                                                                30.0
        Dilli Haat, Garden of 5 Senses, Humayun's Tomb, India Gate, Jama        25.0                                               28.5              29.11
                                                                                                                25.3
        Masjid, Jantar Mantar, Lodi Tomb, Parliment House, Purana Quila,        20.0           22.6
                                                                                15.0
        Qutab Minar, Safdarjang Tomb & Red Fort.
                                                                                10.0
                                                                                 5.0   2.32             2.38                2.52              2.74
      Owing to its geographic advantage, Delhi is a key arrival point for
                                                                                 0.0
        foreign tourists. The percentage share of Foreign Tourist Arrivals at            2014               2015               2016             2017
        Delhi Airport was highest in India in April 2018 at 28.75 per cent.                       Foreign Tourists      Domestic Tourists

      It was ranked the best tourist destination in India in 2017.
                                                                                   Government expenditure on tourism (in US$ million)
      The national capital received 29.11 million domestic tourists and 2.74   12.0
        million foreign tourists in 2017.                                       11.0
                                                                                10.0                                                                   11
                                                                                 9.0
                                                                                                                                          9
                                                                                 8.0
                                                                                 7.0
                                                                                 6.0
                                                                                 5.0
                                                                                 4.0
                                                                                 3.0
                                                                                 2.0     4
                                                                                 1.0                    2               1
                                                                                 0.0
                                                                                       2012-13        2013-14        2014-15        2016-17          2017-18
     Note: Information is as per latest available data,
     Source: Ministry of Tourism, Hotelivate India State Ranking Survey 2017

34      DELHI                                                                                    For updated information, please visit www.ibef.org
STARTUP ECOSYSTEM IN NCR

      The National Capital Region has a thriving startup ecosystem and is home to more than 8,772 startups with the highest number of online retail
       startups in India. Major online startups like Ibibo, Lenskart, Paytm, Snapdeal, Shopclues, Polilcy Bazaar are based in the region.

      Delhi-NCR based startups received US$ 3.98 billion in funding, as per YourStory 2017 Startup Funding Report. In the first half of 2018, startups in
       Delhi-NCR received the highest funding of US$ 2.6 billion.

      Delhi-NCR received 33 per cent of all angel investments in India in 2017.

     Funding received by startups in NCR in 2016

     Company                                                   Investor                                                        Deal Size

     Snapdeal                                                  Ontario Teachers’ Pension Plan                               US$ 200 million

     CarTrade                                                  Temasek, Marche Capital, Warburg Pincus                      US$ 145 million

     Ibibo Group                                               Naspers                                                      US$ 250 million

                                                               GIC, Tiger Global Management, Nexus
     Shopclues                                                                                                             US$ 100+ million
                                                               Venture Partners

     Lenskart                                                  IFC, TPG Growth, IDG Capital Partners, Adveq                 US$ 60 milliom

     Source: InnoVen Capital, Economic Times, Tracxn, YourStory 2017 Startup Funding Report

35      DELHI                                                                                            For updated information, please visit www.ibef.org
DELHI

KEY PROCEDURES
& POLICIES
SINGLE-WINDOW APPROVAL MECHANISM

      The Delhi Government has set up a Business Facilitation Council (BFC) to facilitate single-window clearances from various departments for
       establishing industrial enterprises in a time-bound manner.

      The BFC is headed by the Secretary and Commissioner (Industries) with the Joint Commissioner (Industries) as its member secretary. It will be
       operated through the BFC cell headed by the Joint Commissioner of Industries.

      The major objective of the BFC is to facilitate entrepreneurs in obtaining clearances from various departments/agencies in a time bound and
       efficient manner for setting up industrial enterprises.

      BFC will be the single point contact for entrepreneurs until Part-II of the entrepreneur memorandum is received and production is commenced.

      Senior functionaries of concerned departments such as the Department of Industries, Delhi Pollution Control Committee, Trade & Taxes
       Department, Electricity Distribution Companies, Municipal Corporation of Delhi, Labour Department, Delhi Fire Service Department, Drug
       Controller, District Magistrate, Delhi State Industrial & Infrastructure Development Corporation Ltd & Excise Department will be the nodal officers.
       These nodal officers shall ensure that the applications received by their departments are processed without any undue delay.

37      DELHI                                                                                        For updated information, please visit www.ibef.org
KEY APPROVALS REQUIRED … (1/5)

      Approvals and clearances required   List of procedures                                                     Departments       Estimated time

                                           Obtain Director Identification Number (DIN) online from the
                                                                                                                                        1 day
                                            Ministry of Corporate Affairs portal (national)

                                           Obtain digital signature certificate online from private agency                             3 days
                                            authorised by the Ministry of Corporate Affairs (national)
      Registration for starting a new
                                           Reserve the company name online with the Registrar of              Authorised agent         2 days
      business
                                            Companies (ROC) (national)

                                           Stamp the company documents at the State Treasury (state)                                   2 day

                                          Get the certificate of incorporation from the Registrar of
                                                                                                                     ROC                5 days
                                          Companies, Ministry of Corporate Affairs (national)

     www.doingbusiness.org

38        DELHI                                                                                    For updated information, please visit www.ibef.org
KEY APPROVALS REQUIRED … (2/5)

      Approvals and clearances required          List of procedures                                                Departments        Estimated time

                                                  Make a seal (private)                                                                  1 day
                                                  Obtain a Permanent Account Number (PAN) from an
                                                   authorised franchise or agent1                                 Authorised agent       12 days

                                                  Obtain a Tax Account Number (TAN) for income taxes
                                                   deducted at source from an authorised franchise or agent1                             12 days
      Registration for starting a new
      business                                    Register for Value-Added Tax (VAT) at the Commercial Tax                               9 days
                                                   Office (state) 1

                                                  Register with Employees' Provident Fund Organisation           Central and state
                                                                                                                                         13 days
                                                   (national) 1                                                        excise

                                                  Register for medical insurance at the regional office of the
                                                   Employees State Insurance Corporation (national) 1                                    15 days

     www.doingbusiness.org, 1Parallel activity

39        DELHI                                                                                     For updated information, please visit www.ibef.org
KEY APPROVALS REQUIRED … (3/5)

      Approvals and clearances required          List of procedures                                                      Departments       Estimated time

                                                  Obtain no-due tax certificate from the House Tax Department
                                                   (municipal)
                                                                                                                          House Tax
                                                  Obtain no-objection certificate regarding land use as per                                   18 days
                                                                                                                          Department
                                                   master plan/zonal plan (municipal)

                                                  Notarise the affidavit/undertaking (private sector) 1

                                                  Apply for building permit at the Municipal Corporation of Delhi
                                                   (MCD)

                                                  Receive inspection of the site by the Municipal Corporation of
                                                                                                                          MCD, Delhi           67 days
      Obtaining construction permit                Delhi (municipal)

                                                  Obtain building permit from the Commissioner of the
                                                   Municipal Corporation of Delhi (municipal)

                                                  Hire an independent electricity contractor and obtain load
                                                   approval (private)

                                                  Apply for permanent electricity connection with the BSES                 BSES                3 days
                                                   (private)

                                                  Receive on-site inspection by BSES (private)

     www.doingbusiness.org, 1Parallel activity

40        DELHI                                                                                            For updated information, please visit www.ibef.org
KEY APPROVALS REQUIRED … (4/5)

      Approvals and clearances required          List of procedures                                                 Departments       Estimated time

                                                  Receive inspection by an engineer from the Municipal
                                                   Corporation of Delhi at the plinth level

                                                  File completion certificate and apply for occupancy permit at
                                                   the Municipal Corporation of Delhi (municipal)
                                                                                                                     MCD, Delhi           33 days
                                                  Receive final inspection of the construction by the Municipal
                                                   Corporation of Delhi (municipal)

                                                  Obtain occupancy permit from the Municipal Corporation of
                                                   Delhi (municipal)

                                                  Apply for permanent water & sewerage connections to Delhi
      Obtaining construction permit                Jal Board (municipal)

                                                  Apply for permanent phone connection at Bharat Sanchar
                                                   Nigam Limited (national) 1

                                                  Receive an initial on-site inspection from Delhi Jal Board
                                                   (municipal) 1                                                     Respective
                                                                                                                                          63 days
                                                                                                                     authorities
                                                  Obtain permanent water & sewerage connection from the
                                                   Delhi Jal Board

                                                  Obtain permanent electricity connection from BSES (private) 1

                                                  Obtain phone connection (with inspection) from the BSNL
                                                   (national)1

     www.doingbusiness.org, 1Parallel activity

41        DELHI                                                                                       For updated information, please visit www.ibef.org
KEY APPROVALS REQUIRED … (5/5)

      Approvals and clearances required          List of procedures                                                                       Estimated time

                                                 Check for encumbrances at the office of the sub-registrar of assurances (state)              3 days

                                                 Pay the stamp duty at the State Treasury and obtain stamp paper (state)                      2 days

      Registering property in New Delhi
                                                  The final sale deed is prepared by the buyer or his lawyer (private) 1
                                                                                                                                             11 days
                                                  Execute and register the final sale deed at the office of sub-registrar (state)

                                                 Apply to the circle revenue office for mutation of the property title (state)               40 days

     www.doingbusiness.org, 1Parallel activity

42        DELHI                                                                                            For updated information, please visit www.ibef.org
REGISTRATION - SMALL SCALE INDUSTRIES

      Small-scale industries registration has been simplified & replaced by memorandum under the MSMED Act 2006. Furthermore, filing of the
       memorandum is optional for micro, small & medium manufacturing enterprises & micro & small service enterprises.

      The MSMED Act 2006 defines –

       • Manufacturing enterprises in terms of investment in plant and machinery, excluding land & buildings

       • Service enterprises in terms of investment in equipment

     Classification                          Enterprise                              Investment                       Filling memorandum

                                  Micro enterprise                               US$ 0.05 million                          Optional

     Manufacturing                Small enterprise                             US$ 0.05-0.92 million                       Optional

                                  Medium enterprise                            US$ 0.92-1.84 million                       Optional

                                  Micro enterprise                               US$ 0.02 million                          Optional

     Service                      Small enterprise                             US$ 0.02-0.37 million                       Optional
                                  Medium enterprise                            US$ 0.37-0.92 million                      Mandatory

43      DELHI                                                                                     For updated information, please visit www.ibef.org
KEY INVESTMENT PROMOTION OFFICES

      State Level Export Promotion Committee (SLEPC) has been constituted to draw export policy & action plan & approve infrastructure projects for
       financial assistance under Assistance to States for Developing Export Infrastructure & Allied Activities (ASIDE) scheme of Central Government.

      DSIIDC is responsible for the distribution of funds to the developer agency under the ASIDE scheme upon approval of a project.

     Key agency                                                                Description

                                                                               This organisation provides financial assistance for industrial and
     Delhi Financial Corporation
                                                                               commercial activities in the state.

     Delhi State Industrial and Infrastructure Development Corporation         It is involved in providing infrastructure and marketing facilities to
     Limited (DSIIDC)                                                          industries.

                                                                               It offers financial assistance to specific types of small scale industries
     Delhi Khadi and Village Industries Board
                                                                               (khadi and village industries).

                                                                               This organisation serves as the nodal agency to plan, promote and
     The Department of Industries, Government of NCT of Delhi
                                                                               develop industries in the state.

44      DELHI                                                                                      For updated information, please visit www.ibef.org
CONTACT LIST

     Agency                                                   Contact information

                                                              Plot No 37 and 38, Institutional Area,
                                                              Pankha Road, D-Block Janakpuri,
     Delhi Financial Corporation                              Delhi – 110058.
     (DFC)                                                    Phone: 91-11-2852 5035
                                                              Fax: 91-11-28525041
                                                              Email: dgmdfc.delhi@nic.in
                                                              N-Block, Bombay Life Building,
                                                              Connaught Circus,
     Delhi State Industrial Development Corporation Limited   New Delhi – 110001.
     (DSIIDC)                                                 Phone: 91-11-2331 4231-33
                                                              Email: support@dsiidc.org
                                                              Website: www.dsiidc.org
                                                              Delhi Financial Corporation Building,
                                                              5th Floor, Nigam Bhawan (Old Hindu College),
                                                              Kashmere Gate, Delhi - 110006
     Delhi Khadi and Village Industries Board
                                                              Phone: 91-11-2383 1194
                                                              Email: md-dkvib@nic.in
                                                              Website: www.dkvib.delhigovt.nic.in

                                                              Office of the Commissioner of Industries,
     Department of Industries, Government of NCT of Delhi     Udyog Sadan, Plot No - 419, F I E Patparganj,
                                                              Delhi - 110092.

45      DELHI                                                                     For updated information, please visit www.ibef.org
COST OF DOING BUSINESS IN DELHI

      Parameter                                                                                                                        Cost estimate

      Commercial office space cost (per sq ft)                                                                                     US$ 130 to US$ 965

                                                                                                                                    Un-skilled: US$ 5.9
      Labour cost (minimum wages per day)                                                                                          Semi-skilled: US$ 6.5
                                                                                                                                     Skilled: US$ 7.1

                                                                                                                          Commercial: US$ 0.13 to US$ 0.15
      Power cost (per kWh)
                                                                                                                           Industrial: US$ 0.11 to US$ 0.14

      Residential rent (per sq ft per month)                                                                                  US 23 cents to US 105 cents

      Five-star hotel room (per night)                                                                                             US$ 190 to US$ 415

      Water (per 1,000 litres)                                                                                      Industrial: US 25.23 cents to US 252.39 cents

     Delhi Electricity Regulatory Commission, Delhi Jal Board, Government of National Capital Territory of Delhi, Ministry of Labour and Employment, Government of India, Industry sources

46        DELHI                                                                                                             For updated information, please visit www.ibef.org
STARTUP POLICIES

      In 2016, Delhi Government launched incubation policy to promote entrepreneurship among the youths in the city. State Government distributed
       seed money of US$ 0.23 million each to six higher educational institutions, under the scheme.

      In H1 2016, NCR maintained its lead over Bengaluru, which is called the Silicon Valley of India, both in terms of number of funding deals, as well
       as total funding raised. Startups in NCR raised a total of US$ 3.35 billion in funding across 138 deals, whereas, Bengaluru raised US$ 2.56 billion
       from 129 deals

      In budget 2017-18, state government announced plans to spend US$ 43.9 million to build World Class Skill Centre in Jaunapur.

47      DELHI                                                                                        For updated information, please visit www.ibef.org
STATE ACTS AND POLICIES …(1/3)

                               Objectives

                                The government has allocated a sum of US$ 11.46 million for opening new Primary Health Centers.

                                  Government is supplementing the Universal Immunisation Programme by implementing the “Indradhanush
        Medical Policy for
                                   Kawach” in a mission mode to cover all left out children.
          2015-2016
                                The health Department, GNCTD has decided to set up a Health Project Division for Planning and execution of all
                                 health sector projects of Department of Health & Family Welfare, GNCTD.

                                Collection of Excise duty at import level from wholesale licensee
                                To cancel the current renewal system of excise licenses of hotels, restaurants and clubs. Once the payment of
                                 approved annual fee is done, the licenses will continue to function
        Excise Policy for
                                Microbreweries to function at hotels and restaurants only if they seek license
          2015-2016
                                To increase the sale verification limit of low-cost liquor brands from 60,000 cases (including sale in Delhi) to sale
                                 of 80,000 cases (excluding sale in Delhi)
                                No increase in excise duty this year                                                                   Read more

                                To ensure adequate and affordable water supply to the residents of the state.
     Delhi Water Policy 2015
                                To ensure balance of environment along with development.
                                                                                                                                        Read more

       Delhi Solar Energy       To generate 1,000 MW of solar power in the next five years
          Policy 2015           To promote solar energy and installation of solar panels on roof-tops of every government building
                                                                                                                                        Read more

48     DELHI                                                                                    For updated information, please visit www.ibef.org
STATE ACTS AND POLICIES …(2/3)

                               Objectives

        Delhi Electricity
     Regulatory Commission      To control the damage to the environment by reducing the emission of the green house gases.
         (Demand Side
         Management)            To guard the interests of the consumers and result in the overall decrease in tariff for all the consumers.
       Regulations, 2014                                                                                                                 Read more

                                Delhi Development Authority has changed its land acquisition policy to develop housing.
                                The new policy is based on the concept of land pooling, wherein the land owner transfers the land ownership
                                 rights to the designated land pooling agency. The agency develops the acquired land and later transfers a part of
       New Land Pooling          developed land back to the land owner.
            Policy
                                According to the new land-pooling policy:
                                  • For areas of 3–20 hectares, private developers will be able to retain 40% of developed land.
                                  • For areas above 20 hectares, private developers will be able to retain 60% of the developed land. Read more

                               The Industrial Policy for Delhi 2010–21 aims to make Delhi a hub of clean, high-technology and skilled economic
                               activities by 2021 by adhering to the following basic principles:
                                Encouraging cluster development of hi-tech and skilled industries through public private partnership.
                                Infrastructure development.
       Industrial Policy for    De-congestion.
         Delhi 2010–21
                                Promoting ‘walk to work’.
                                Simplifying business.
                                Industry consultation in decision making and sustainability.
                                Promoting knowledge-based industries.                                                                   Read more

49     DELHI                                                                                     For updated information, please visit www.ibef.org
STATE ACTS AND POLICIES …(3/3)

                              Objectives

                               This policy has been framed with a view to provide safe, eco-friendly, cost-effective and efficient modes of
                                transportation through a well integrated, multimodal transport system.

     Transport Policy 2002     The policy aims to make Delhi a well-managed, clean and dynamic city, which is involved in serving its citizens
                                efficiently.

                               The policy focuses on encouraging a balanced modal-mix and discourages personal transport.       Read more

                               The IT policy is governed by six ‘Es’: electronic governance, equality, education, employment, entrepreneurship
                                and economy.

     Information Technology    The policy aims to promote these six goals in an integrated and parallel fashion for the overall development of
           Policy 2000          information and communication technology in the state in terms of infrastructure and usage.

                               The policy promotes IT for masses and e-governance, and aims to create a conducive environment for the growth
                                of the IT industry and related infrastructure.                                                  Read more

50     DELHI                                                                                For updated information, please visit www.ibef.org
DELHI

ANNEXURE
ANNEXURE…(1/2) - SOURCES

                          Data                                             Sources

     GSDP (state)                                      Ministry of Statistics and Program Implementation

     Per capita GSDP figures                           Ministry of Statistics and Program Implementation

     GSDP (India)                                                  Central Statistics Office

     Installed power capacity (MW)                                Central Electricity Authority

     Wireless subscribers (No)                               Telecom Regulatory Authority of India

     Internet subscribers (Mn)                               Telecom Regulatory Authority of India

     National highway length (km)                  NHAI, Roads and Building Department-Government of India

     Airports (No)                                                 Airports Authority of India

     Literacy rate (%)                                                   Census 2011

     Birth rate (per 1,000 population)                          SRS Bulletin September 2017
     Cumulative FDI equity inflows (US$ billion)          Department of Industrial Policy & Promotion

     Operational PPP projects (No)                      DEA , Ministry of Finance, Government of India

52      DELHI                                                                For updated information, please visit www.ibef.org
ANNEXURE…(2/2) - EXCHANGE RATES

     Exchange Rates (Fiscal Year)                                              Exchange Rates (Calendar Year)

                 Year INR                          INR Equivalent of one US$               Year                  INR Equivalent of one US$
                  2004–05                                    44.95
                                                                                           2005                            44.11
                  2005–06                                    44.28
                                                                                           2006                            45.33
                  2006–07                                    45.29
                  2007–08                                    40.24                         2007                            41.29
                  2008–09                                    45.91                         2008                            43.42
                  2009–10                                    47.42
                                                                                           2009                            48.35
                  2010–11                                    45.58
                  2011–12                                    47.95                         2010                            45.74

                  2012–13                                    54.45                         2011                            46.67
                  2013–14                                    60.50
                                                                                           2012                            53.49
                  2014-15                                    61.15
                                                                                           2013                            58.63
                  2015-16                                    65.46
                  2016-17                                    67.09                         2014                            61.03
                  2017-18                                    64.45                         2015                            64.15
                Q1 2018-19                                   67.04
                                                                                           2016                            67.21
                Q2 2018-19                                   70.18
                Q3 2018-19                                   72.15                         2017                            65.12

 Source: Reserve Bank of India, Average for the year

53     DELHI                                                                                  For updated information, please visit www.ibef.org
DISCLAIMER

     India Brand Equity Foundation (IBEF) engaged Aranca to prepare this presentation and the same has been prepared by Aranca in consultation with
     IBEF.

     All rights reserved. All copyright in this presentation and related works is solely and exclusively owned by IBEF. The same may not be reproduced,
     wholly or in part in any material form (including photocopying or storing it in any medium by electronic means and whether or not transiently or
     incidentally to some other use of this presentation), modified or in any manner communicated to any third party except with the written approval of
     IBEF.

     This presentation is for information purposes only. While due care has been taken during the compilation of this presentation to ensure that the
     information is accurate to the best of Aranca and IBEF’s knowledge and belief, the content is not to be construed in any manner whatsoever as a
     substitute for professional advice.

     Aranca and IBEF neither recommend nor endorse any specific products or services that may have been mentioned in this presentation and nor do
     they assume any liability or responsibility for the outcome of decisions taken as a result of any reliance placed on this presentation.

     Neither Aranca nor IBEF shall be liable for any direct or indirect damages that may arise due to any act or omission on the part of the user due to any
     reliance placed or guidance taken from any portion of this presentation.

54      DELHI                                                                                           For updated information, please visit www.ibef.org
You can also read