KARNATAKA - MALLIKARJUNA TEMPLE IN PATTADAKAL, KARNATAKA - IBEF Presentation

 
CONTINUE READING
KARNATAKA - MALLIKARJUNA TEMPLE IN PATTADAKAL, KARNATAKA - IBEF Presentation
KARNATAKA

            MALLIKARJUNA TEMPLE IN PATTADAKAL, KARNATAKA
                                                                March 2021
                              For updated information, please visit www.ibef.org
KARNATAKA - MALLIKARJUNA TEMPLE IN PATTADAKAL, KARNATAKA - IBEF Presentation
Table of Contents

        Executive Summary           3

        Introduction                5

        Economic Snapshot           10

        Physical Infrastructure     16

        Social Infrastructure       25

        Industrial Infrastructure   28

        Key Sectors                 30

        Key Procedures & Policies   40

        Appendix                    51

 2
KARNATAKA - MALLIKARJUNA TEMPLE IN PATTADAKAL, KARNATAKA - IBEF Presentation
Executive summary…(1/2)

                    Strong growth in GSDP
      1              •

                     •
                         At current prices, Karnataka’s gross state domestic product (GSDP) stood at ~Rs. 16.65 trillion (US$ 225.99
                         billion) in 2020-21.
                         The GSDP (in Rs.) of the state increased at a CAGR of 9.76% between 2015-16 and 2020-21.

                    IT hub of India
                     •   Karnataka is the IT hub of India & home to the fourth largest technology cluster in the world. It has 23 operational

     2               •
                         IT/ ITeS SEZs, five software technology parks & dedicated IT investment regions.
                         Export of electronics and computer software from the state reached US$ 42.16 billion in FY20 (till November
                         2019). Export of IT and electronic products accounted for around 38.99% share in India's electronics and computer
                         software export and 76.36% share in Karnataka’s overall export.

                    Vibrant industrial base
     3               •   Karnataka has vibrant automobile, agro, aerospace, textile & garment, biotech & heavy engineering industries. The
                         state has sector-specific SEZs for key industries such as IT, nanotechnology, biotechnology, engineering, food
                         processing and aerospace.

                    One of the preferred investment destinations
      4              •

                     •
                         The cumulative FDI inflow in the state reached US$ 46.61 billion between April 2000 and March 2020, the third
                         highest in India after Maharashtra and New Delhi. It accounted for a share of 9% of India’s cumulative FDI inflow.
                         Karnataka attracted Rs. 1.20 lakh crore (US$ 16.38 billion) investments during COVID-19

 Source: Visvesvaraya Trade Promotion Centre, Karnataka Economic Survey 2019-20

 3
KARNATAKA - MALLIKARJUNA TEMPLE IN PATTADAKAL, KARNATAKA - IBEF Presentation
Executive summary…(2/2)

                    Strong growth in export
      5               •   In 2020-21, the state’s total exports stood at US$ 13.19 million (as of March 2021). In the overall exports from the
                          state, sectors such as iron & steel, petroleum products, electronic instruments and cotton accessories were the key
                          contributors.

                    Strong knowledge infrastructure
      6               •

                      •
                          Karnataka has 52 universities, 4,519 pre-university colleges, 535 Technical Institutions, 206 engineering colleges &
                          314 polytechnics, 47 medical colleges & 38 dental colleges.
                          The state also houses 401 R&D centres; around 400 of the Fortune Global 500 companies outsource their IT
                          services to firms in Bengaluru.

                    Significant agriculture base
     7                •   Sugarcane is the key crop of the state, with production of ~39.6 million tonnes in 2019-20**. The state’s total food
                          grain production was estimated to be 11.9 million tonnes in 2019-20**. Karnataka is also the third largest producer
                          of plantation crops in the country.

                    Strong growth in tourism sector

      8               •   Karnataka boasts of a diverse flora & fauna & a 320km natural coastline, which makes it a nature tourist's
                          paradise. Tourist arrivals in the state increased from 214.85 million in 2018 to 228.54 million in 2019, at a growth
                          rate of 6.37% between 2018 and 2019. The state has world heritage sites at Hampi and Pattadakal. The sector
                          contributes 14.8% to GSDP of Karnataka; plans are afoot to expand to 26% by 2020.

 Source: Economic Survey of Karnataka 2019-20, Karnataka State Budget 2020-21, Ministry of Tourism,GoI,**2019 - 20 As per 2ndAdvance Estimates.

 4
KARNATAKA - MALLIKARJUNA TEMPLE IN PATTADAKAL, KARNATAKA - IBEF Presentation
INTRODUCTION

5
KARNATAKA - MALLIKARJUNA TEMPLE IN PATTADAKAL, KARNATAKA - IBEF Presentation
Karnataka fact file

                                                                  Bengaluru
                                                                        Capital                  319 persons per sq km              61.1 million
                                                                                                   Population density              total population

                                                             192,000 sq.km.
                                                                 geographical area                       68.1%                     82.5%
                                                                                                    Female literacy rate        Male literacy rate

      Source: Maps of India
                                                                                                                                 973:1000
                                                                                                                                     Sex ratio
                                                                       75.6%                 administrative districts:   30   (females per 1,000 males)
     Key Insights                                                    literacy rate

     • Karnataka is located in the southern region of India. The state is surrounded by the Arabian Sea in the west, Goa in the northwest, Maharashtra in
       the north, Andhra Pradesh in the east, Tamil Nadu in the southeast, and Kerala in the southwest.
     • Languages spoken are Kannada, Tulu, Kodava, Hindi and English.
     • Some of the prominent cities in the state are Ankola, Bengaluru, Bagalkot, Belgaum, Bidar, Bijapur, Chikmagalur, Chitradurga, Dandeli, Hubli-
       Dharwad, Mangalore, Mysore and Shimoga.
     • Karnataka has a tropical climate with three major seasons: warm and dry from February to May, monsoon from June to October and winter from
       November to January.

 Source: Economic Survey of Karnataka 2019-20, Census 2011 Office of Registrar General, India.

 6
KARNATAKA - MALLIKARJUNA TEMPLE IN PATTADAKAL, KARNATAKA - IBEF Presentation
Advantage: Karnataka

                                                                              Policy support
         Infrastructure                                                       •   Wide range of fiscal and policy incentives for
         •   Well-developed       social,   physical   and                        businesses under the Karnataka Industrial
             industrial infrastructure and substantial port                       Policy, 2020-25 with simplified procedures for
             infrastructure.                                                      investment.
         •   Well-developed telecom infrastructure.                           •   In January 2017, Karnataka Department of
         •   Excellent healthcare facilities.                                     Commerce and Industries introduced an NRI
                                                                                  policy to attract investments from non-resident
                                                                                  Kannadigas.

 High economic growth                                                                                  Rich talent pool
                                                                                                       •   Karnataka is termed as the
 •   The      state’s      GSDP
                                                                                                           Knowledge Capital of India.
     expanded at a CAGR of
                                                                                                       •   The     state    has    successfully
     9.76% between 2015-16
                                                                                                           attracted skilled labour, especially,
     and 2020-21.
                                                                                                           in the knowledge sector. Karnataka
 •   Buoyant      services    (IT,
                                                                                                           is among the states that produce a
     tourism) and industries
                                                                                                           large number of doctors, engineers
     driving economic growth.
                                                                                                           and medical technicians in the
 •   Sector specific SEZs and
                                                                                                           country.
     SIRs facilitating growth.

 Source: Ministry of Statistics and Programme Implementation, News articles

 7
KARNATAKA - MALLIKARJUNA TEMPLE IN PATTADAKAL, KARNATAKA - IBEF Presentation
Karnataka in figures

     Karnataka’s Contribution to Indian Economy (2018-19)                                        Physical Infrastructure in Karnataka

 GSDP     GSDP as a percentage of all states’ GSDP                                                     Installed power capacity (MW) (as of February
          India: 100.0 | Karnataka: 7.93                                                               2021)
                                                                                                       India: 379,130.41 | Karnataka: 30,056.48

          GSDP growth rate** (%)                                                                       Wireless subscribers (million) (as of January
          India: 10.5 | Karnataka: 9.76                                                                2021)
                                                                                                       India: 1,163.41 | Karnataka: 67.45

          Per capita GSDP* (US$)                                                                       Internet subscribers (in June 2020) (million)
          India: 1877.76 | Karnataka: 3,392                                                            India: 749.07 | Karnataka: 46.11

                                                                                                       National highway length (km) (as of March 2019)
     Social Indicators
                                                                                                       India: 132,499.5 | Karnataka: 7,334.8
          Literacy rate (%)
          India: 73.0 | Karnataka: 75.6                                                                Major and minor ports (No.)
                                                                                                       India: 13+187 | Karnataka: 1 + 10
          Birth rate (per 1,000 population) (2018)                                                     Airports (No.)
          India: 20.0 | Karnataka: 17.2                                                                India: 125 | Karnataka : 5

     Industrial Infrastructure                                                                   Investments

          Operational PPP projects (No.)                                                                Cumulative FDI equity inflows (from October
          India: 1,824 | Karnataka: 139
                                                                                                        2019 to December 2020) (US$ million)
          Operational SEZs (No) (as of February 2020)                                                   India: 75,351.56 | Karnataka: 10,659.45
          India: 240 | Karnataka: 32

 Note: GSDP, per capita GSDP figures are taken at current prices, For source refer to Annexure

 8
KARNATAKA - MALLIKARJUNA TEMPLE IN PATTADAKAL, KARNATAKA - IBEF Presentation
Karnataka Vision 2022

                                                                8 POOR AND BACKWARD
 1 INFRASTRUCTURE
 •   Build infrastructure to boost productive
                                                                CLASSES
     potential of the economy.                                  •       Increase rural incomes through
 •   Various metro rail and mono rail                                   greater viability of agriculture and
     projects are in progress.                                          allied activities.

 2 EDUCATION/
                                                    1   8       •       Bridge the gap between socially
                                                                        backward and vulnerable groups and
                                                                        rest of the people.
 SKILL DEVELOPMENT
 •   Develop the state as a vibrant

                                                2           7
     knowledge society.                                         7 HEALTHCARE/
 •   Focus on job oriented growth through                       SOCIAL AMENITIES
     skill development of the workforce.
                                                                    •    Improve access and availability of
                                                                         quality healthcare for all.

 3 GOVERNANCE                                                   6 TOURISM
 •   Better governance through wider

                                                3           6
     participation and deep democratic                          •       Preserve and promote Karnataka’s
     decentralisation.                                                  rich heritage.
 •   Encourage         transparency and                         •       Karnataka Tourism Vision Group
     accountability.                                                    (KTVG) was set up in October 2013 to
                                                                        advise on promoting tourism in state.

 4 INDUSTRY
 •   Build   and     sustain   Bangalore’s
                                                    4   5       5 WOMEN
     leadership in science, technology and                      EMPOWERMENT
     knowledge based industries.
                                                                •       Enhance opportunities and empower
 •   Achieve a sustainable and orderly
                                                                        women across economic, social and
     process of industrialisation and
                                                                        political spheres.
     urbanisation.

 9
KARNATAKA - MALLIKARJUNA TEMPLE IN PATTADAKAL, KARNATAKA - IBEF Presentation
ECONOMIC SNAPSHOT

10
Economic snapshot – GSDP

                               GSDP at current prices                                                                  GSDP per capita at current prices

                                                 CAGR 9.76%                                              4,000                               CAGR 8.95%                                         300000
         250                                                                                    18
                                                                                                         3,500
                                                                                                16                                                                                              250000

                                                                                                                                                                              3,496
                                                                                        16.65
                                                                            231.09

                                                                                                                                                                                        3,392
                                                                            16.29

                                                                                      225.99

                                                                                                                                                                                      249,947
                                                                                                                                                                          246,419
                                                                                                                                                                  3,252
                                                                                                         3,000

                                                                                                                                                    3,189
         200

                                                                213.28
                                                                                                14
                                                    207.43

                                                                14.91

                                                                                                                                                              227,299
                                                                                                                                                                                                200000

                                                                                                                                     2,773

                                                                                                                                              205,499
                                                                                                         2,500
                                                  13.37
                                                                                                12
                                  180.00

                                                                                                                        2,487

                                                                                                                                186,072
                                 12.08

         150
                      159.67

                                                                                                10       2,000                                                                                  150000

                                                                                                                   162,796
                     10.45

                                                                                                8        1,500
         100                                                                                                                                                                                    100000
                                                                                                6
                                                                                                         1,000
           50                                                                                   4                                                                                               50000
                                                                                                          500
                                                                                                2

            0                                                                                   0           -                                                                                   0

                                                                                                                   2015-16

                                                                                                                                2016-17

                                                                                                                                              2017-18

                                                                                                                                                              2018-19

                                                                                                                                                                          2019-20

                                                                                                                                                                                      2020-21
                     2015-16

                                 2016-17

                                                  2017-18

                                                                2018-19

                                                                            2019-20

                                                                                      2020-21

                                           US$ billion       Rs. trillion                                                                               US$         Rs.

   At current prices, Karnataka’s gross state domestic product (GSDP)                                The state’s per capita GSDP was Rs. 249,947 (US$ 3,392) in 2020-
    stood at Rs. 16.65 trillion (US$ 225.99 billion) in 2020-21.                                       21.
   The state’s GSDP increased at a CAGR of 9.76% between 2015-16                                     The per capita GSDP (in Rs.) increased at a CAGR of 8.95%
    and 2020-21.                                                                                       between 2015-16 and 2020-21.

 Note: Exchange rates used are averages of each year, provided on page 53
 Source: Directorate of Economics & Statistics of Karnataka, Central Statistics Office

 11
Economic snapshot – NSDP

                               NSDP at current prices                                                                    NSDP per capita at current prices

                                                                                                                                         CAGR 8.90%
                                         CAGR 9.71%
         240                                                                                   16     3600                                                                                     240000

                                                                                       15.11

                                                                                                                                                                                     226,796
                                                                                               14                                                                                              210000

                                                                                                                                                                       223,175
                                                                          14.75
         200                                                                                          3000

                                                                                                                                                                    3,166.05
                                                                       209.29

                                                                                  205.06

                                                                                                                                                          205,697

                                                                                                                                                                                 3,077.70
                                                            13.49

                                                                                                                                                        2,943.15
                                                                                               12                                                                                              180000

                                                                                                                                        2,892.24
                                                          193.01
                                              188.16

                                                                                                                                        186,405
                                              12.13

         160                                                                                          2400

                                                                                                                              169,898
                                                                                                                             2,532.39
                                                                                                                                                                                               150000
                               11.03
                              164.35

                                                                                               10

                                                                                                               2,262.57
                                                                                                               148,108
                    145.26
                      9.51

         120                                                                                   8      1800                                                                                     120000

                                                                                                                                                                                               90000
                                                                                               6      1200
          80
                                                                                                                                                                                               60000
                                                                                               4
                                                                                                       600
          40                                                                                                                                                                                   30000
                                                                                               2
                                                                                                         0                                                                                     0

                                                                                                               2015-16

                                                                                                                             2016-17

                                                                                                                                        2017-18

                                                                                                                                                        2018-19

                                                                                                                                                                    2019-20

                                                                                                                                                                                 2020-21
            0                                                                                  0
                    2015-16

                              2016-17

                                              2017-18

                                                         2018-19

                                                                       2019-20

                                                                                  2020-21

                                                                                                                                                  US$    Rs.
                                        US$ billion     Rs. trillion

   The net state domestic product (NSDP) of Karnataka was recorded                                  The state’s per capita NSDP in 2019-20 was Rs. 226,796 (US$
    at ~Rs. 15.11 trillion (US$ 205.06 billion) in 2020-21.                                           3,077.70).

   The state’s NSDP expanded at a CAGR of 9.71% between 2015-16                                     The per capita NSDP (in Rs.) increased at a CAGR of 8.90%
    and 2020-21.                                                                                      between 2015-16 and 2020-21.

 Note: Exchange rates used are averages of each year, provided on page 53
 Source: Directorate of Economics & Statistics of Odisha, Central Statistics Office, Economic Survey 2019-20

 12
Economic snapshot – Percentage distribution of GSVA

   In 2019-20, the tertiary sector contributed 66.53% to the state’s                                          Visakhapatnam
                                                                                                                     GSVA composition
                                                                                                                             port trafficby
                                                                                                                                         (million
                                                                                                                                            sectortonnes)
    GSVA at current prices, followed by secondary (19.79%) and
    primary (13.68%) sectors.
                                                                                                     100%
                                                                                                                                         CAGR*
   At a CAGR* of 11.52%, primary sector was the fastest growing
                                                                                                       90%
    among the three sectors between 2015-16 and 2020-21.

   Tertiary sector rose at a CAGR* of 10.50 % between 2015-16 and                                     80%
    2020-21. This was driven by trade, hotels, real estate, finance,
                                                                                                       70%
    insurance, transport, communications and other services.                                                              64.04%         10.50%       66.53%

   Secondary sector increased at a CAGR* of 6.05% between 2015-16                                     60%
    and 2020-21. This was driven by manufacturing, construction and
                                                                                                       50%
    electricity, gas and water supply segments.
                                                                                                       40%

                                                                                                       30%
                                                                                                                          23.39%         6.05%        19.79%
                                                                                                       20%

                                                                                                       10%
                                                                                                                          12.57%         11.52%       13.68%
                                                                                                        0%
                                                                                                                         2015-16                      2019-20

                                                                                                                Primary Sector     Secondary Sector   Tertiary Sector

 Note: *CAGR in Rs. term
 Source: Directorate of Economics & Statistics of Karnataka, Central Statistics Office, Sector-wise %, share of GSDP

 13
Economic snapshot – FDI inflow & investments

   Investment intentions in terms of IEMs filed, LOIs/DILs issued in                                                  FDI Inflow to Karnataka (US$ billion)
                              Karnataka
                                                                                                    50                                                                              8.94 46.61
    300.0
                                                                                                    40                                                                      6.73
                              285

    250.0                                                                                                                                                           8.57

                                                                        251
                                                                                                                                                            6.45
    200.0                                                                                           30
                                                                                                                                              4.12 2.13
                                            194
    150.0                                                                                           20                                3.44
                                                                                                                              1.89

                                                          142
    100.0                                                                                                             2.55
                                    23.93

                                                  23.50

                                                                                            22.42
                                                                                      120
                                                                                                          8.23

                                                                13.25

                                                                              11.95
                 106

                                                                                                    10
                       4.84

      50.0
       0.0                                                                                            0

                                                                                                                       FY12

                                                                                                                               FY13

                                                                                                                                       FY14

                                                                                                                                              FY15

                                                                                                                                                     FY16

                                                                                                                                                             FY17

                                                                                                                                                                     FY18

                                                                                                                                                                             FY19

                                                                                                                                                                                      FY20
                                                                                                            FY01-11

                                                                                                                                                                                             FY01-20
                  2015         2016          2017          2018          2019          2020

             Number of Investment Intentions         Proposed Investments (US$ Billion)

    Karnataka has a stable political environment and ranked third in terms of attracting private sector investments in India. According to Department
       for Promotion of Industry and Internal Trade (DPIIT), the state’s cumulative FDI inflows stood at US$ 10.66 billion between October 2019 and
       December 2020, the third highest in India after Gujarat and Maharashtra, and accounted for 14% of India’s cumulative FDI inflows.

    In 2020, 120 investment intentions worth Rs. 162,492 crore (US$ 22.42 billion) were filed in Karnataka.

 Source: Department for Promotion of Industry and Internal Trade, Directorate of Economics and Statistics, Government of Karnataka

 14
Economic snapshot – Export

             Merchandise Export from Karnataka (US$ billion)                                                  Principal Commodities Exported in FY21*

        25.00
                                                                                                                                           Iron & Steel
                  23.62
        20.00                                                                                                           8%                 Petroleum products
                               19.26      19.68                                                                              5%
                                                     18.05      17.36                                                          5%
        15.00                                                              16.64                                                           Electronics instruments
                                                                                                                                5%
                                                                                      13.20
                                                                                                                                 5%        RMG cotton including
        10.00
                                                                                                                                           accessories
                                                                                                                                4%
                                                                                                                                           Drug formulations,
          5.00                                                                                              68%                            biologicals
                                                                                                                                           Electronics Components
          0.00
                     2014-15

                                2015-16

                                           2016-17

                                                      2017-18

                                                                 2018-19

                                                                            2019-20

                                                                                       2020-21*
                                                                                                                                           Others

   Iron & steel is the top exported item from Karnataka, accounting for ~8% of the total exports in FY21*, followed by petroleum products (5%) and
      electronics instruments (5%).

   Merchandise exports from the state reached US$ 16.64 billion in 2019-20 and US$ 13.20 billion in 2020-21.

   Karnataka is home to over 5500+ IT/ITES companies and ~750 MNCs which contribute more than Rs. 58 lakh crore (US$ 58 billion) of exports,
      giving direct employment to over 1.2 million professionals and creating over 3.1 million indirect jobs.

 Note: *- until January 2021
 Source: Directorate General of Commercial Intelligence and Statistics, Ministry of Commerce and Industry

 15
PHYSICAL INFRASTRUCTURE

16
Physical infrastructure – Roads

                                                                                                 Road infrastructure in Karnataka (km)

                                                                                            Road type                                    2019-20

                                                                                            National highways
                                                                                                                                          7,335
                                                                                            (March 2019)
                                                                                            State highways*                              27,163

                                                                                            Major district roads*                        55,515

                                                                                            Municipal roads*                              8,366

                                                                                            Rural roads*                                 177,542
                                                        Source: Maps of India

       Karnataka provides efficient public transport to people of different income groups across the state as well as in neighbouring states. The state has
         a total of 275,158 km of road area. The national highways run for around 7,335 km and the state highways extend as much as 27,163 km.

       Public Works Department (PWD) of the state is using hi-tech vehicles to help in improvement of roads. The vehicles will be used to check the
         status of 20,000 km of core roads in the state according to the department.

       As per Budget 2020-21, Rs. 519 crore (US$ 70 million) has been allocated towards state highways and Rs. 849 crore (US$ 115 million) towards
         district and other roads.

       On December 19, 2020, the Union Minister for Road Transport & Highways Mr. Nitin Gadkari inaugurated and laid the foundation for 33 national
         highway projects in Karnataka. These projects include 1,197 km long roads worth Rs. 10,904 crore (US$ 1.48 billion).
 Note: * 2016-17
 Source: Ministry of Road Transport & Highways, Government of Karnataka, State Budget, 2020-21

 17
Physical infrastructure – Railways

   Status of Rail projects in Karnataka (2019-20)                                   Status of Bangalore Metro Rail projects (2019-20)

   Railway project             Track Length (kms)             Status
                                                                                    Metro Railway
                                                                                                        Track Length (kms)           Status
                                                              Land acquisition is   project
    Chikkamagalur-
                                          46.0                in
    Sakaleshpura
                                                              progress

                                                              Land acquisition is                                                    Completed on
    Bagalkot-Kudachi                     144.0                in                    Phase - 1                    42.3
                                                                                                                                     17.06.2017
                                                              progress

                                                              Land acquisition is
    Tumkur-Rayadurga                     102.6                in                    Phase - 2                    72.1                Under progress
                                                              progress

                                                              Land acquisition is   Phase - 3               105 (Proposed)           Under preparation
    Gadag-Wadi                           252.5                in
                                                              progress

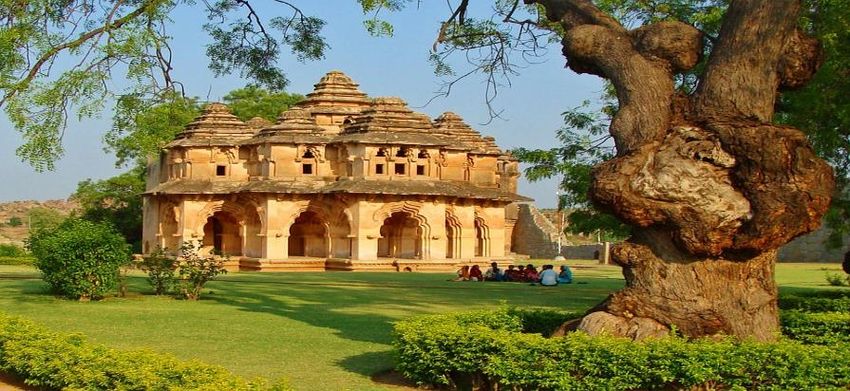
    Karnataka is well connected to other parts of the country through the railways. The state has a railway network of 3,540 kms.

    In Union Budget 2018-19, the Government approved for 160 kms rail network sum of Rs. 17,000 crore (US$ 2.53 billion) for the growth of
      Bengaluru metropolis and was to be executed by both State and Central Government in 50:50 ratio.

    In Budget 2019-20, a feasibility study to develop 105.55 kms new metro lines (Phase-3) has been proposed.

    In January 2021, Union Minister of Road Transport & Highways Mr. Nitin Gadkari laid the foundation stone for two national highway projects in the
      Hubli-Dhadwad district. The new road projects are to be built at a cost of Rs. 323 crore.

 Source: Economic Survey of Karnataka, 2019-20, State Budget 2018-19

 18
Physical infrastructure – Airports

                                                                                     Karnataka airport statistics (FY21*)

                                                                                                    Passenger          Aircraft            Freight
                                                                                       Airport
                                                                                                    traffic (No.)   movement (No.)        (tonnes)

                                                                                     Bangalore       4,847,588              54,830         197,530

                                                                                     Mangalore        206,211               2,523           1,541

         The state has five domestic airports. These are located in Bengaluru, Mangalore, Hubli, Mysore and Belgaum. In March 2017, the
            Government gave ‘in principle’ approval for construction of an airport at Shimoga.

         International flights operate from the airports at Bengaluru (Kempegowda International Airport), the country’s first greenfield international
            airport, has been developed at Devanahalli in Bengaluru as a passenger and cargo department hub and Mangalore (Mangalore International
            Airport).

         In December 2019, the New South Parallel Runway (NSPR) at Kempegowda International Airport became operational. This will enable the
            airport to handle around 35 million passengers per year. The airport became the first in country to operate independent parallel runways,
            enabling aircraft to land and take off simultaneously on both runways.

 Note: * Till November 2020
 Source: Airport Authority of India

 19
Physical infrastructure – Ports

    There are 13 ports in Karnataka, of which New Mangalore is a major port. New Mangalore Port is the ninth major port in India with the
      deepest inner harbour on the west coast.

    The state Government has initiated the work on development of Pavinakurve port, under PPP mode, in the district of Uttar Kannada. The
      draft concessional agreement and pre-feasibility report preparations related to the port are under process.

    The work on development of the second stage of Karwar port has been initiated under the concept of D-BOOST in PPP mode.

   Ports
                                                                                     Cargo handled by new port in Mangalore (in ‘000 tonnes)
        Major ports                  New Mangalore Port
                                       Karwar
                                                                                   50000
                                       Belekeri
                                       Tadri                                      40000

                                                                                                                     42,055
                                                                                                          39,940

                                                                                                                                         39,145
                                                                                                                               38,487
                                       Honavar

                                                                                               35,590
                                                                                   30000
                                       Bhatkal
        Minor ports

                                                                                                                                                   25,790
                                       Kundapur                                   20000
                                       Hangarkatta                                10000
                                       Malpe
                                                                                        0
                                       Padubidri
                                                                                              FY16      FY17        FY18      FY19      FY20      FY21
                                       Old Mangalore

  Source: Indian Port Association

 20
Physical infrastructure – Power

    Karnataka was one of the first Indian States to implement power                         Installed Power Capacity (GW)
       sector reforms. The Karnataka Electricity Regulatory Commission
       (KERC) was established as a regulatory authority of the State's       35.00
       Power Sector.
                                                                             30.00

                                                                                                                                30.06
    As of February 2021, the state had an installed power generation

                                                                                                                        29.85
                                                                                                              28.10
       capacity of 30,056.48 MW. Of this, central utilities contributed

                                                                                                   26.70
                                                                             25.00
       4,047.70 MW, private utilities (17,208.30 MW) and state utilities
                                                                             20.00

                                                                                     21.31
       (8,800.49 MW).

    Of the total installed power generation capacity, 10,343.40 MW was      15.00

       contributed by thermal power, followed by nuclear (698.00 MW),
                                                                             10.00
       renewable power (15,428.48 MW) and hydropower (3,586.60 MW).

                                                                              5.00
    As per State Budget 2020-21, Rs. 9,115 crore (US$ 1,245 million)
      has been allocated towards subsidies to Karnataka Electricity Board.
                                                                              0.00

                                                                                     FY17

                                                                                                    FY18

                                                                                                              FY19

                                                                                                                        FY20

                                                                                                                                FY21*
 Note: MW- Megawatt, * Until February 2021
 Source: Central Electricity Authority, News Articles

 21
Physical infrastructure – Renewable Energy

   Karnataka Renewable Energy Development Limited (KREDL) was established in 1996 to promote the development of renewable energy sources
    in the state

   Karnataka is endowed with high renewable energy potential such as wind, hydro, solar, tidal & geothermal energy resources. It is now India’s top
    solar photovoltaic (PV) state as it crossed the 5GW mark in the first quarter of 2018.

   By November 2020, installed wind energy capacity was recorded at 4,859.54 MW. Wind energy accounted for 32.42% of the total installed
    capacity recorded in this period.

   The state has a solar energy potential of 10,000 MW. Karnataka Solar Policy 2014-2021 plans to add solar generation of minimum 2,000 MW by
    2021. The total capacity installed for solar energy stood at 7315.87 MW as of November 2020.

  Progress in Renewable Energy as of November 2020

        No.            Renewable energy source                                Capacity allotted (MW)                             Installed capacity (MW)
         1                          Wind                                              18,540.57                                         4859.54
         2                          Hydro                                              3010.25                                           903.46
         3                       Synergistic                                           2,212.65                                         1,731.16
         4                  Chemistry Biological                                        395.13                                           139.03
         5                      Solid Waste                                             51.00                                             0.00
         6                        SolarGrid                                            9,820.95                                         7,354.03
                                Grand total                                           34,030.55                                        14,987.22

 Source: KREDL, Central Electricity Authority, Karnataka Renewable Energy Policy, Ministry of New and Renewable Energy (MNRE),

 22
Physical infrastructure – Telecom

 Telecom Infrastructure (as of January 2021)                                              Performance status of Bharat Net Project

  Wireless subscribers                                             67,446,937             No. of GPs (service ready) (as of November
                                                                                                                                          6,247
                                                                                          2020)
  Wireline subscribers                                              2,150,628

  Internet subscribers (as of June 2020)
                                                                      46.11
  (million)

  Teledensity (in %)                                                  104.19

       Karnataka is the seventh largest wireless telecom market in India. The entire state is networked through optical fibre cables (OFCs) of the
         state-owned company, Bharat Sanchar Nigam Limited (BSNL), as well as private companies such as Bharti, Reliance, VSNL and TATA
         Tele Services. The state Government is planning to provide technology at the gram panchayat level by providing free Wi-Fi to the youth.

       According to the Telecom Regulatory Authority of India (TRAI), there were 67.45 million wireless and 2.15 million wireline subscribers in
         Karnataka, as of January 2021.

       By January 2021, 46.63 million subscribers had submitted requests for mobile number portability in Karnataka.

 Source: Telecom Regulatory Authority of India, Bharat Broadband Network Limited (BBNL)

 23
Physical infrastructure – Urban Infrastructure

   Karnataka is among the top ten most urbanised states in India. Seven
                                                                                         Fund classification under each component of AMRUT for
                                                                                         Karnataka (as on January 2019) (US$ million)
      cities of Karnataka have been selected under the Smart Cities Mission
      to be developed as smart cities. IT has ten city corporations, 57 city               Total allocation      Committed             Sanctioned         Central
                                                                                            for projects*         Central                Central        Assistance
      municipal councils, 113 town municipal councils, 90 town panchayats &
                                                                                                                 Assistance            Assistance     released since
      4 notified area committees.                                                                                                                          2015

   In 2019-20, under Vajpayee Housing Scheme 5,705 houses have been                            686.47              321.38               196.80           162.77
      completed (as of November 2019), while 233 and 3,005 houses have
                                                                                           Water supply                                Sewerage system
      been constructed (as of November 2019) as part of Devarajurs Housing
                                                                                            The Karnataka Urban Water
      Scheme and Dr. B.R. Ambedkar Nivasa Yojane, respectively.
                                                                                             Supply and Drainage Board
                                                                                             (KUWSDB) has implemented                   The Bengaluru Water Supply
   The state is projected to reach an urban population proportion of 50%
                                                                                             surface-based drinking water                and Sewerage Board
      by 2026. Some of the key areas of development are roads and flyovers,                  supply schemes in 231 urban                 (BWSSB) is responsible for
      water supply, storm-water drainage, sewerage and urban transport. As                   areas to provide assured safe               providing water supply,
      per budget 2020-21, Rs. 13,749 (US$ 1.87 billion) has been proposed                    drinking water.                             sewerage system & sewage
                                                                                                                                         disposal in the Bengaluru
      for water supply, sanitation, housing and urban development.                          KUWSDB is implementing five
                                                                                                                                         Metropolitan area.
                                                                                             schemes at Malur, Bangarpet,
   Under the State Budget 2020-21, sectors such as irrigation and flood                     Gajendragad, Naregal and                   In 2019-20, there were 49
                                                                                             Anekal to shift their water                 ongoing underground drainage
      control (29%), rural development (23%) and water supply, sanitation,
                                                                                             source from ground water to                 (UGD) schemes at a budget of
      housing and urban development (13%) saw the highest increase in                        the assured surface water                   Rs. 520.18 crore (US$ 74
      budget allocations.                                                                    source. All these schemes will              million).
                                                                                             be completed by December
                                                                                             2020.
 Note: * Including state share
 Source: JNNURM, Ministry of Urban Development, Economic Survey of Karnataka 2019-20, PRS Legislative Research, State Budget 2020-21

 24
SOCIAL INFRASTRUCTURE

25
Social infrastructure – Education

  In terms of the number of universities, Karnataka ranks fifth among
   all Indian states and union territories, with 65 universities. Of these,      Karnataka education statistics (2019-20)
   28 are state public universities and 11 are private deemed
   universities.                                                                                                    Lower primary: 24,316
                                                                                  Number of schools                 Higher primary: 38,003
  The state has 4,519 pre-university colleges to impart general                                                    Secondary schools: 16,808
   education. There are more than 1 million students in the
                                                                                                                    Lower primary: 1.93
   pre-university colleges.                                                       School dropout rate (in %)
                                                                                                                    Higher primary: 2.94
  The state has a literacy rate of 75.6%, the male literacy rate is 82.8%                                          Average: 23.18:1
   and the female literacy rate is 68.1%.                                         Pupil-teacher ratio               Private Aided schools: 55.48:1
                                                                                                                    Unaided schools: 31.61:1
  Under the State Budget 2020-21, Rs. 371 crore (US$ 50 million) has
   been allocated to child welfare and Rs. 179 crore (US$ 25 million)            Educational infrastructure (2019-20)
   towards women’s welfare.

  In January 2021, the Karnataka education department announced                 Institute type                         Number        Enrolments
   that for 2020-21 school year, tuition fees will be reduced to 70%
                                                                                 Medical colleges                         52               6,753
   across school boards and no other fees (such as term fees or school
   development fees) will be charged by schools.                                 Ayurvedic colleges                       58               4,085

                                                                                 Homoeopathic colleges                    15               1,190
  Karnataka is home to several premier institutions:
                                                                                 Unani colleges                           04                240
   Indian Statistical Institute.
                                                                                 Naturopathy & Yogic Sciences
                                                                                                                          08                600
   Indian Institute of Science.                                                 (BNYS)

   Indian Institute of Management.                                              Dental colleges                          38               2,487

   National Law School of India University.                                     Pharmacy colleges                        61               4,784

   Institute for Social and Economic Change                                     Nursing colleges                        323               19,415

 Source: Economic Survey of Karnataka 2019-20, Census 2011, State Budget 20-21

 26
Social infrastructure – Health

                                                                                             Health Indicators, 2018 (As per SRS Bulletin May 2020)
   Karnataka has made tremendous effort in improving the health status of
      its people in the last few decades. The State has made substantial                                1
                                                                                             Birth rate                                                    17.2
      progress in building credible health infrastructure with a wide                                       1
                                                                                             Death rate                                                      6.3
      institutional network providing health services both in urban and rural
                                                                                                                    2
      areas.                                                                                 Infant mortality rate                                           23

                                                                                             Natural Growth Rate                                           10.9
   The State has 63 district Hospitals, 555 sub district Hospitals and 31
      Autonomous and Teaching Hospitals and 146 Taluk / General
                                                                                             Life expectancy at birth (years)
      Hospitals in the state.

                                                                                             Male (2015)                                                   63.6
   According to the State Budget 2020-21, Rs. 1,433 core (US$ 195
                                                                                             Female (2015)                                                 67.1
      million) has been allocated towards urban health services and Rs.
      1,413 crore (US$ 193 million) towards rural health services.
                                                                                             No of institutions                          Total Facilities (May 2020)
   Programmes under AYUSH health care services:
                                                                                             Sub Centers                                              9,613
    AYUSH Health camp.
                                                                                             Community Health
                                                                                                                                                       321
    District and Taluk Seminars / Workshop.                                                 Centres

    Home remedy and Ayush awareness.                                                        Primary Health Centres                                   2,649

    Diabetic control programme.                                                             Sub District Hospitals                                    555

    School health programme.                                                                District Hospital                                          63

    AYUSH health expo.                                                                      Total Institutions                                      13,201

 Source: Economic Survey of Karnataka 2019-20,Ministry of Health & Family Welfare, Sample Registration System (SRS) Bulletin May, 2020, 1Per thousand persons,2Per thousand live
 births.

 27
INDUSTRIAL INFRASTRUCTURE

28
Industrial infrastructure: SEZs and industrial estates

                                                                                    Sector-wise Operational SEZs In Karnataka
   As of February 2020, the state has 32 operational, 52 notified SEZs
                                                                                              (as of February 2020)
      and 63 formally approved SEZs. The Karnataka Industrial Areas
      Development Board has developed 141 industrial areas spread
                                                                                                             IT/ITeS
      across the state. The state plans to develop and upgrade eight
      clusters around Bengaluru with an investment of US$ 348.4 million in                                   Biotechnology
                                                                                          3%
      coming years.
                                                                                   3%                        Hi-tech Engineering Products
                                                                              3%              3%             and related services
   The Karnataka State Industrial & Infrastructure Development                          3%
                                                                                    3%                       Electronics Hardware and
      Corporation has promoted more than 135 start-up ventures in the                                        Software/ITES
                                                                                   3%
      state through equity participation and has provided debt to core             4%                        Aerospace and Industry
      industries such as steel, cement, mining and textiles, as well as new
                                                                                                             Pharmaceuticals
      sectors such as IT, aerospace and telecom.
                                                                                                   75%
                                                                                                             Textile
   Karnataka is the first in the country to provide bespoke policy
      ecosystem for automobile sector .The state has introduced a                                            Multi Product
      comprehensive and well-designed Electric Vehicle and Energy
                                                                                                             Precision Engineering Product
      Storage Policy.

 Source: Department of Commerce, Ministry of Commerce & Industry

 29
KEY SECTORS

30
Key sector – IT and IT- enabled services…(1/2)

     Karnataka has emerged as an information technology (IT) hub of           Electronics and software exports from Karnataka (US$ billion)
      India. Bengaluru is the fourth largest technological cluster in the
      world after Silicon Valley, Boston and London.

     About 50% of the world's SEI CMM Level 5 certified companies are
                                                                                 90.00
      located in Bengaluru.
                                                                                 80.00
     The state is India’s largest software exporter, with electronics and
      computer software exports totalling to US$ 77.9 billion in 2018-19                                                    77.9
                                                                                 70.00
      and reached US$ 42.5 billion during 2019-20 (till November 2019).
                                                                                 60.00                62.7
     Karnataka has 47 IT/ ITeS SEZs and dedicated IT investment                          60.5                   61.4
      regions. There are 3,500 IT companies in the state. The state houses       50.00
      550,000 IT professionals or 1/3rd of the total IT professionals in the
      country.                                                                   40.00                                                 42.5
     In November 2020, the Government of Karnataka launched the                 30.00
      ‘Beyond Bengaluru’ initiative to build innovation and technology
      ecosystem beyond the capital city.                                         20.00

     In November 2020, the government announced eight MoUs with                 10.00
      various organisations from the Global Innovation Alliance (GIA)
      partner countries across the AI, IoT, cybersecurity, biotech and            0.00

                                                                                            2015-16

                                                                                                       2016-17

                                                                                                                  2017-18

                                                                                                                             2018-19

                                                                                                                                        2019-20
      semiconductor sectors.

 Source: : Economic Survey of Karnataka 2019-20

 31
Key sector – IT and IT- enabled services…(2/2)

                          Wipro has presence in areas such as IT services, product engineering, technology infrastructure services, BPO
                           and other consulting solutions. Based in Bengaluru, the company has 72 plus global delivery centres and 50 plus
                           industry-specific centres of excellence in more than 54 countries. In September 2009, the company launched its
                           centre of excellence at its Electronic City campus to work with other leading IT firms for developing innovative IT
                           solutions.
         Wipro Ltd

                          Infosys Technologies Ltd was set up in 1981. The company operates in areas such as IT consulting, modular
                           global sourcing, process re-engineering and BPO services. The company has 11 operation centers at multiple
          Infosys          locations in Bengaluru, Mangalore and Mysore.
      Technologies Ltd

                          Genpact was set up in 1997 in India. Formerly known as GE Capital International Services. The company provides
                           a wide range of business process, technology and knowledge services including finance and accounting,
                           collections and customer relations, insurance, procurement and supply chain, analytics, software and IT
                           infrastructure. The company has one office in Bengaluru in Karnataka.
          Genpact

                          Accenture is a global management consulting, technology services and outsourcing company with approximately
                           275,000 people serving clients in more than 120 countries.

         Accenture

 32
Key sector – Metals and mining

                                                                                    Mineral Production in Karnataka
                Iron & Steel Exports from Karnataka (US$ million)

                                                                                    Mineral                          2018-19         2019-20**
         2000

         1500                                                                       Iron Ore (total) (‘000
                                                     1,536                                                            29,796          29,961
                                                                                    tonnes)
         1000     1,169                                             1,203
                                                                            1,088
                                                                                    Gold (total) (kgs)                1,661           1,572
          500                             745
                                                             600
                              341                                                   Silver (kgs)                       204             172
            0
                  FY15       FY16        FY17        FY18    FY19   FY20    FY21*   Limestone (‘000
                                                                                                                      34,303          31,716
                                                                                    tonnes)

       Karnataka is rich in mineral resources, which are spread over 1.92 lakh sq. kms and has >40,000 sq. kms. of green stone belt, which is a
         treasure trove of several mineral deposits and indicates occurrence of polymetallic deposits, diamonds and gold.

       In 2019-20**, Karnataka was the third-largest producer of iron ore in India, followed by Maharashtra and Chhattisgarh

       Total value of all minerals produced (excluding fuel & atomic minerals) was Rs. 8,741 crore (US$ 1.24 billion) in 2018-19.

       In 2019-20, the total export value of iron & steel in Karnataka was US$ 1,202.77 million and reached US$ 1,088.21 between April 2020 and
         January 2021.

 Note: * Until January 2021; ** till February 2020
 Source: Indian Bureau of Mines

 33
Key sector – Engineering…(1/2)

                                                                                 Engineering products exports (US$ billion)
   The engineering industry in Karnataka has positive prospects, given
                                                                                          (Up to November 2019)
      its performance.
                                                                          6.00
   The state exported engineering products worth US$ 4.78 billion in
      2018-19 and reached US$ 2.75 during April-November 2019.
                                                                                                        5.40
                                                                          5.00
   The state is exporting engineering products to Germany, China,                                                4.78
      South Korea, Brazil, USA, Malaysia, Thailand, South Africa and
                                                                          4.00
      Singapore. Most of the exporters in state are based in Bengaluru,                      4.09

      Hubli, Mysore, Belgaum, Mangalore, and Shimoga
                                                                          3.00
                                                                                  3.08
   Exports include machine tools, industrial machinery, cutting tools,
                                                                                                                               2.75
      castings, automotive components, electrodes, welding equipment,
                                                                          2.00
      construction and earthmoving equipment, and helicopter spares.

                                                                          1.00

                                                                          0.00
                                                                                 2015-16    2016-17   2017-18    2018-19      2019-20

 Source: : Visvesvaraya Trade Promotion Centre, Government of Karnataka

 34
Key sector – Engineering…(2/2)

                            BEML Limited (formerly Bharat Earth Movers Limited) was established in 1964. BEML manufactures a wide range
                             of earth moving and other heavy industrial equipment for the mining and civil engineering industries.

                            BEML has a registered office in Bengaluru and units in Kolar Gold Fields, Mysore and Bengaluru.
        BEML Limited

                            HMT was established in 1953. The company manufactures various types of machine tools including watches,
                             tractors, printing machinery, metal forming presses, die casting & plastic processing machinery, CNC systems &
                             bearings.
          HMT Ltd

                            Saint-Gobain India was established in India in 1996. The group has eight manufacturing plants in India (including
                             Bangalore) for various products ranging from glass to engineering products.

                            In 2019, the company registered sales worth US$ 1.1 billion.
      Saint-Gobain India

 35
Key sector – Automotive and aerospace…(1/2)

      Automotive

       Karnataka has a huge local market with over 14 million registered vehicles. Over 400 R&D centres and 200 engineering colleges are
        driving innovation in the state.

       The state is the fourth-largest automobile producer in India, contributing 8.5% to the total national automobile output. The state has
        presence of auto clusters at Dharwad, Belagavi, Shivamogga, Ramanagara and Bengaluru Rural.

       The state is also home to Reva Mahindra, the first indigenously built electric car in the country, and key OEMs such as Toyota, Volvo,
        Honda, Scania and TVS.

       In February 2021, Tesla announced that it would be setting up a manufacturing plant in Karnataka for production of electric cars.

      Aerospace

       Karnataka is known as the pioneer in the Indian aerospace industry after the establishment of Hindustan Aeronautics Limited (HAL) in
        Bangalore in 1940. Karnataka produces more than a quarter of India’s aircrafts and space crafts. The state is exporting aerospace
        products to US, UK, Germany, Russia Mauritius, Malaysia, Nepal, Oman and Ecuador.

       The state contributes 65% to aerospace-related exports from India. Last year, Karnataka Government has given approval for investment
        of Rs. 480 crore (US$ 68.67 million) to Goodrich Aerospace Service Pvt Ltd to establish a unit in Bengaluru.

       India’s first aerospace SEZ of 300 acres is operational at Belgaum. Aerospace Technology Centre (ATC) in Bengaluru would be
        established under the PPP model.

       It is the first state in the country to introduce a dedicated Aerospace policy (2017-23). Furthermore, it contributes to 67% of country’s
        helicopter and aircraft for Defence Services.

 Source: : Invest India, Invest Karnataka, Economic Survey of Karnataka 2019-20

 36
Key sector – Automotive and aerospace…(2/2)

                           Volvo India has a state-of-the-art bus manufacturing unit near Bengaluru. The Volvo Group has ~104,000
                            employees worldwide, production facilities in 18 countries and sales activities in more than 190 countries.

                           The Hoskote plant at Bengaluru has an installed production capacity of 1,500 buses per annum .It has strong
                            association with Karnataka.
         Volvo India

                           Delphi India was incorporated in 1995 as a wholly owned subsidiary of Delphi. The company is a leading global
                            supplier of electronics & technologies for automotive, commercial vehicles and other market segments.

      Delphi Automotive    Delphi India has a technical centre in Bengaluru, which is the largest technical centre outside the US.
       Systems Pvt Ltd

                           In India, Boeing is represented through its wholly owned subsidiary, Boeing International Corporation India Private
                            Limited (BICIPL).

                           Boeing established its first R&D centre in India - the Boeing Research & Technology Centre - in Bengaluru in
                            2009. The centre develops high-end technology solutions, particularly in the areas of aero structures and avionics.
           Boeing

                           Hindustan Aeronautics Limited (HAL) is ranked 40th in Flight International's list of the World’s Top 100 aerospace
                            companies in 2008.

                           HAL, headquartered in Bangalore, has 20 production units and 11 R&D centres in eight locations across the
                            country.
            HAL

 37
Key sector – Agro and food processing

               Coffee exports from Karnataka (US$ million)                                      Production of major crops in Karnataka (‘000 tonnes)

      600                                                                                        Crop                                2018-19    2019-20**
      500                                                                                        Rice                                 3458        3,463
                507
      400                                                    443                                 Wheat                                163          143
      300                                     360
                               320                                          310                  Nutri/Coarse Cereals                 9200       10,203
      200
                                                                                                 Pulses                               1,846       1,737
      100
                                                                                                 Total Food Grains                   11,046      11,940
        0
                 2016-17

                                2017-18

                                               2018-19

                                                              2019-20

                                                                             2020-21*
                                                                                                 Total Oilseed                        792         1,073
                                                                                                 Sugarcane^                          42,411      39,600

    Karnataka, with a good agricultural base including various food crops, offers immense scope for the development of food processing industries.
       Karnataka is the largest producer of coffee & cocoa in the country.

    In 2019-20**, the total oilseed production in the state was ~1 million tonnes. Production of cereals and pulses in the state was estimated to be
       10.2 million tonnes and 1.7 million tonnes, respectively, during the same period

    In 2019-20, the total production of sugarcane in the state was 39.6 million tonnes.

    Karnataka is the first state to go online mandis, which would integrate 150 mandis on a single online platform.

 Note: ^sugarcane production for the harvested area during the year, ,*- until March 2021,**2019 - 20 As per 2ndAdvance Estimates.
 Source: : Economic Survey of Karnataka 2019-20, Directorate General of Commercial Intelligence and Statistics

 38
Key sector – Agro and food processing…(2/2)

                              Hindustan Unilever Limited (HUL) is India's largest fast-moving consumer goods (FMCG) company, with
                               leadership in home & personal care products and foods & beverages. The company recorded revenue worth US$
                               5.4 billion in 2019-20, with >18,000 employees nationwide.

                              The company has a manufacturing plant and an R&D centre at Bengaluru.
  Hindustan Unilever Ltd

                              Nestle has been in India for almost a century, with seven production facilities across the country, including one at
                               Nanjangud, Karnataka. The company produces chocolates and confectionaries, prepared dishes and cooking
                               aids, beverages and milk products and nutritional supplements.
          Nestle India

                              Britannia is a leading food processing company in India. The company manufactures food products such as
                               biscuits, cheese and bread. Based in Bengaluru.
           Britannia
         Industries Ltd

                              United Breweries Limited (UBL) is a flagship company of the UB Group. The company is also referred to as the
                               beer division of the UB Group and is based in Bengaluru.

                              The company has around 2,489 employees and manufactures products primarily under the Kingfisher, London
                               Pilsner and UB Premium Ice brands.
      United Breweries Ltd

 39
KEY PROCEDURES AND POLICIES

40
Contact list

               Agency                                  Contact information

                                                       No 49, South Block, Khanija Bhavan
                                                       Race Course Road
                                                       Bengaluru - 560 001
               Department of Industries and Commerce
                                                       Phone: 91-80 2238 9901-08
               (DIC)
                                                       Fax: 91-80-2238 9909
                                                       E-mail: commissioner@karnatakaindustry.gov.in
                                                       Website: www.karnatakaindustry.gov.in

                                                       No 49, South Block, Khanija Bhavan
                                                       East Entrance, Race Course Road
                                                       Bengaluru - 560 001
               Karnataka Udyog Mitra                   Phone: 91-80-2228 2392/5659,
               (KUM)                                   Fax: 91-80-2226 6063
                                                       E-mail: md@kumbangalore.com
                                                       Website: www.kum.karnataka.gov.in

 41
Key investment promotion offices

  Agency                                   Description

  District Level Single Window Clearance    Functions under the chairmanship of respective Deputy Commissioners for industrial projects for
  Committee (DLSWCC)                         investments less than US$ 0.65 million.

  State Level Single Window Clearance       Functions under the chairmanship of Minister for Large and Medium Industries for investments
  Committee (SLSWCC)                         that range between US$ 0.65-10.9 million.

  State High Level Clearance Committee      Functions under the chairmanship of the Chief Minister for projects involving investment of more
  (SHLCC)                                    than US$ 10.9 million.

                                            Nodal agencies for approval of projects at the district level.
  District Industries Centres
                                            Primary focus is to promote small scale, village and cottage industries.

                                            Various sector specific departments such as Department of Tourism, Department of Information
  Other departments                          Technology and Biotechnology, Department of Food Processing, Department of Textiles and
                                             Department of Mines and Geology.

 42
Key approvals required…(1/2)

                 Approvals and clearances required                              Departments to be consulted

      Registration, Industrial Entrepreneurs Memorandum              Department of Industries and Commerce Department,
                                  (IEM), Industrial Licenses           Karnataka Udyog Mitra (Single Window Agency)

             Allotment of Land/Shed in Industrial Estates or
                                                                        Karnataka Industrial Areas Development Board
                                           Industrial Areas

                                                                   State Department of Industries, Department of Town and
                                         Permission for land use
                                                                                     Country Planning

                                                                   State Pollution Control Board and Ministry of Environment
                                     Site environmental approval
                                                                                           and Forests

           No objection certificate under Water and Air Act                Karnataka State Pollution Control Board

      Approval for construction activity and building plan                 Development Authority/Urban Local Body

                                              Sanction of power                     State Electricity Board

 Source: Commissionerate of Industries

 43
Key approvals required…(2/2)

                 Approvals and clearances required                              Departments to be consulted

                                         No objection certificate   Fire Department and Directorate of Factories and Boilers

                             Provisional trade tax registrations             Central and State Excise Departments

                     Registration under Central Sales Tax Act                Central and State Excise Departments

                              Permanent Trade Tax registration               Central and State Excise Departments

             Registration under Central Sales Tax Act, 1956                  Central and State Excise Departments

                                                                    Department of Industries and Commerce and respective
                                                    Registration
                                                                        sector departments such as IT/BT/Tourism etc.

 Source: Commissionerate of Industries

 44
Cost of doing business in Karnataka

  Cost parameter                          Cost estimate

  Industrial land (US$ per hectare)         129,191.51

                                      Metropolitan area: 12.13
  Power cost (US cents per kWh)
                                       Non metro area: 8.7

  Labour (US$/man year)                        1,522

  Occupation costs (US$/sq ft/year)            16.44

  Employee cost (US$/ man year)

  Software developers                          6,383

  Team leads                                  14,893

  Architects                                 21,276.5

  Project managers                            31,915

 45
Electronics systems design and manufacturing policy 2017–22

   Electronic Systems Design and Manufacturing (ESDM) is the fastest growing segment of the Information and Communications Technology (ICT)
    sector.

   According to Ministry of Electronics and Information Technology (MeitY), ESDM to be a part of national IT policy to encourage state to come up
    with more productive policy which could attract more private investment in ESDM sector.

   As per the National Electronics Policy - 2012 (NEP-2012), ESDM is expected to grow to US$ 400 billion by the year 2020 and will generate a total
    employment of over 28 million.

   The objective of the Karnataka ESDM Policy is to facilitate, promote and develop the “ESDM” sector in the State of Karnataka and make
    Karnataka a preferred destination for investment in Telecommunications, Defense, Medical, Industrial, Automotive, Consumer Products,
    applications and components, parts, and accessories required for the aforesaid products and applications. The following targets are set for
    Karnataka ESDM Policy:
      •   Emerge as the leading contributor to India's ESDM sector by accounting for at least 10% of the US$ 400 billion by 2020
      •   Generate over 20% of the country's total ESDM exports target of US$ $80 billion by 2020.
      •   Develop core competencies in specific ESDM verticals such as telecom, defence electronics, avionics and energy.
      •   Make Karnataka the country's preferred destination for investments in ESDM.
      •   Generate at least 240,000 new jobs, 25% of India's PhDs and 5000 patent filings in ESDM sector in Karnataka by 2020.
   Several incentive options have been designed for enterprises, start-ups and MSMEs to avail reimbursements and grants under the following
    schemes:
      •   Patent registration incentive, international marketing incentive and PF/EDI incentive
      •   Capital subsidy, ETP set-up subsidy and Interest subsidy
      •   R&D grant, concession on registration charges and power tariff concession
      •   Reimbursement of quality certification costs, prototyping costs and land conversion fee
      •   Exemption from stamp duty

 46
Karnataka startup policy 2015-20

       A Karnataka Startup Cell has been set up to address the needs and demands of the rapidly expanding Startup Community and promote
        Karnataka's Startup Ecosystem.

       Following are the highlights of the startup policy:

         •   Capacity Building through New Age Incubation Network

         •   Technology Based Incubators: Fostering links between R&D and Commercialization of Technologies.

         •   IDEA2PoC Fund: Taking ideas to Proof of Concept.

         •   Startup Fund of Funds.

         •   Incentives and Concessions: VAT/CST and ST, Patent and Marketing Reimbursements

         •   ‘Elevate 100’ scheme to identify 100 innovative start-ups and support them till the next level of success.

         •   Capacity Building Through Exposure Visits and Workshops

         •   Creating incubation infrastructure through PPP

 47
State acts & policies…(1/4)

                      NRI Policy 2017

      1
                      The policy was introduced in January 2017, to attract investments from non-resident
                      Kannadigas. The policy aims at helping improve the privileges and speedy services to NRKs,
                      through a card.

                      Karnataka State Electric Vehicle and Energy Storage Policy 2017

      2
                      To make Karnataka a preferred investment destination for manufacturing of electric vehicles,
                      promote a conducive manufacturing ecosystem in the industry and develop human capital
                      required by the industry.

                     IT Policy 2020-2025

      3              The policy is focused on continued development of infrastructure, markets, ecosystem, talent
                     and ease of doing business to support growth of the IT industry in the state.

                      Karnataka Tourism Policy 2020-25
                      To position Karnataka as the most preferred tourism destination that provides a safe and

      4               memorable experience for tourists through diverse high-quality tourism offerings developed
                      in collaboration with tourism stakeholders and local communities to create sustainable and
                      inclusive socioeconomic development for all.

 48
State acts & policies…(2/4)

                      AVGC Policy 2017-22

      5               Encourage and support appropriate manpower development, infrastructure development
                      and business development in the AVGC sector.

                      Solar Policy 2014-21
                      To add solar generation of at least 2,000 MW by 2021 in a phased manner.

      6               To encourage PPP model and R&D and innovation in the sector.
                      To promote Roof Top Generation and Technologies.
                      To transform Karnataka into an investor friendly state.

                     Karnataka Industrial Policy 2020-25
                     To retain Karnataka’s position as a global manufacturing hub and achieve higher and

      7              sustainable industrial growth through capital infusion, technology transfer, world-class
                     industrial infrastructure, skill upgrade and benchmarking of policies and practices to the best
                     global standards.

                      ESDM Policy 2013

      8               To facilitate, promote and develop the ESDM sector in Karnataka and make Karnataka a
                      preferred destination for investment in this sector.

 49
State acts & policies…(3/4)

                      Aerospace Policy 2013-23
                      To position Karnataka as a vibrant aerospace hub of Asia and a globally recognized

      9               aerospace destination by enabling the environment for holistic and sustained growth of the
                      aerospace sector. Increase the contribution of the aerospace sector towards enhancing the
                      share of industry in the state’s GSDP from 28.0% to 32.0% by 2022.

                      Integrated Agribusiness Development Policy 2011
                      To position Karnataka on a sustained growth path in the field of agricultural and allied

      10              sectors through global technologies and innovative tools by creating enabling frameworks
                      and state-of-the-art infrastructure facilities, thereby generating higher returns for farming
                      communities.

                     Information and Communication Technology Policy 2011
                     To maintain Karnataka’s leadership in outsourced IT services.

      11             To retain Karnataka’s position as the state with the largest skilled workforce in India for IT
                     services, products and R&D. To enable Karnataka to be the most preferred destination for
                     MSMEs (micro, small and medium enterprises).

                      Energy Conservation and Energy Efficiency Policy 2020-25

      12
                      To outline an overarching framework for identification, development, implementation,
                      monitoring and verification of energy efficiency programmes to be undertaken in the state
                      to tap huge energy savings potential.

 50
State acts & policies…(4/4)

                      Karnataka start-up policy 2015-20

      13              A Karnataka start-up cell has been set up to address needs and demands of the rapidly
                      expanding start-up community and promote Karnataka's start-up ecosystem.

 51
APPENDIX

52
Sources

                       Data                                                                 Sources

 GSDP (state)                                  Economic Survey 2019-20 (Karnataka), Directorate of Economics & Statistics of Karnataka

 Per capita GSDP figures                       Economic Survey 2019-20 (Karnataka), Directorate of Economics & Statistics of Karnataka

 GSDP (India)                                  Economic Survey 2019-20 (India)

  Installed power capacity (MW)                Central Electricity Authority

  Wireless subscribers (No)                    Telecom Regulatory Authority of India

  Internet subscribers (million)               Telecom Regulatory Authority of India

  National highway length (km)                 NHAI, Roads and Building Department-Government of India

  Major and minor ports (No)                   India Ports Association

  Airports (No)                                Airports Authority of India

  Literacy rate (%)                            Economic Survey 2019-20 (Karnataka)

  Birth rate (per 1,000 population)            Economic Survey 2019-20 (Karnataka)
 Cumulative FDI equity inflows (US$ billion)   Department for Promotion of Industry and Internal Trade
  Operational PPP projects (No)                DEA , Ministry of Finance, Government of India

  Operational SEZs (No)                        Ministry of Commerce & Industry, Department of Commerce

 53
Exchange rates

  Exchange Rates (Fiscal Year)                                                 Exchange Rates (Calendar Year)

                    Year                           Rs. Equivalent of one US$               Year                 Rs. Equivalent of one US$
                  2004-05                                   44.95                          2005                          44.11

                  2005-06                                   44.28                          2006                          45.33
                  2006-07                                   45.29                          2007                          41.29
                  2007-08                                   40.24                          2008                          43.42
                  2008-09                                   45.91                          2009                          48.35
                  2009-10                                   47.42                          2010                          45.74
                  2010-11                                   45.58                          2011                          46.67
                  2011-12                                   47.95                          2012                          53.49
                  2012-13                                   54.45                          2013                          58.63
                  2013-14                                   60.50                          2014                          61.03
                  2014-15                                   61.15                          2015                          64.15
                  2015-16                                   65.46                          2016                          67.21
                  2016-17                                   67.09                          2017                          65.12
                  2017-18                                   64.45                          2018                          68.36
                  2018-19                                   69.89                          2019                          69.89
                  2019-20                                   70.49                          2020                          74.18
                  2020-21                                   72.59                         2021*                          73.69

 Note: As of February 2021
 Source: Reserve Bank of India, Average for the year

 54
Disclaimer

  India Brand Equity Foundation (IBEF) engaged Sutherland Global Services private Limited to prepare/update this presentation.

  All rights reserved. All copyright in this presentation and related works is solely and exclusively owned by IBEF, delivered during the course of
  engagement under the Professional Service Agreement signed by the Parties. The same may not be reproduced, wholly or in part in any material
  form (including photocopying or storing it in any medium by electronic means and whether or not transiently or incidentally to some other use of this
  presentation), modified or in any manner communicated to any third party except with the written approval of IBEF.

  This presentation is for information purposes only. While due care has been taken during the compilation of this presentation to ensure that the
  information is accurate to the best of Sutherland Global Services’ Private Limited and IBEF’s knowledge and belief, the content is not to be construed
  in any manner whatsoever as a substitute for professional advice.

  Sutherland Global Services Private Limited and IBEF neither recommend nor endorse any specific products or services that may have been
  mentioned in this presentation and nor do they assume any liability, damages or responsibility for the outcome of decisions taken as a result of any
  reliance placed on this presentation.

  Neither Sutherland Global Services Private Limited nor IBEF shall be liable for any special, direct, indirect or consequential damages that may arise
  due to any act or omission on the part of the user due to any reliance placed or guidance taken from any portion of this presentation.

 55
You can also read