PUNJAB - SRI HARMANDIR SAHIB IN AMRITSAR, PUNJAB March 2021 For updated information, please visit www.ibef.org - IBEF Presentataion
←
→
Page content transcription
If your browser does not render page correctly, please read the page content below
PUNJAB

         SRI HARMANDIR SAHIB IN AMRITSAR, PUNJAB
                                                     March 2021
                   For updated information, please visit www.ibef.org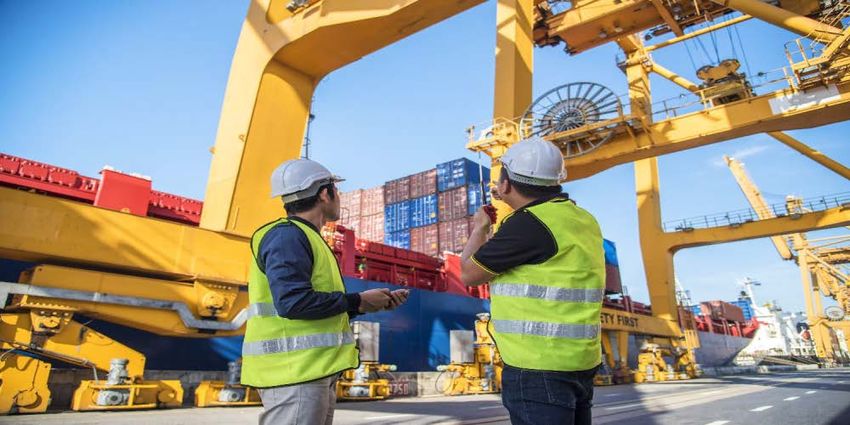
Table of Contents

        Executive Summary           3

        Introduction                4

        Economic Snapshot           9

        Physical Infrastructure     15

        Social Infrastructure       22

        Industrial Infrastructure   25

        Key Sectors                 28

        Key Procedures & Policies   38

        Appendix                    50

 2
Executive summary

                    Textile hub
                         •   Punjab has emerged as a key hub for textile-based industries including yarn, readymade garments & hosiery.

      1                  •
                             With the development of apparel parks, favourable textile policies & other incentives for the creation of textile
                             infrastructure, the state offers opportunities for investment.
                             State is the source of 95% of India’s Woollen Knitwear production, 85% of India’s sewing machine production
                             and 75% of India’s sports goods production.

                    Good infrastructure facilities
      2                  •
                         •
                             Punjab has been ranked first in India in terms of infrastructure facilities offered.
                             Punjab’s road, rail and air transport network, connectivity, construction of bridges and infrastructure facilities are
                             among the best.

                    Strong agriculture production
      3                  •

                         •
                             Punjab has a strong agriculture base with the huge production of principal crops such as rice, maize, sugarcane &
                             barley.
                             Total food grain production in the state stood at 29.99 million tonnes in 2019-20 (as per fourth advance estimates).

                    Increased focus on renewable energy
                         •   The state Government of Punjab is increasing its focus on using renewable sources of energy.
      4                  •

                         •
                             By 2022, the state has to achieve 4,772 megawatt (MW) of capacity from solar power, 50 MW from small hydro
                             projects and 244 MW from biomass.
                             The total investment potential for renewable energy is expected to reach US$ 6 billion by 2022.

 Source: Department of Agriculture, Government of Punjab, Central Electricity Authority, As per Punjab Investor Summit 2015, Punjab Economic Survey, MNRE

 3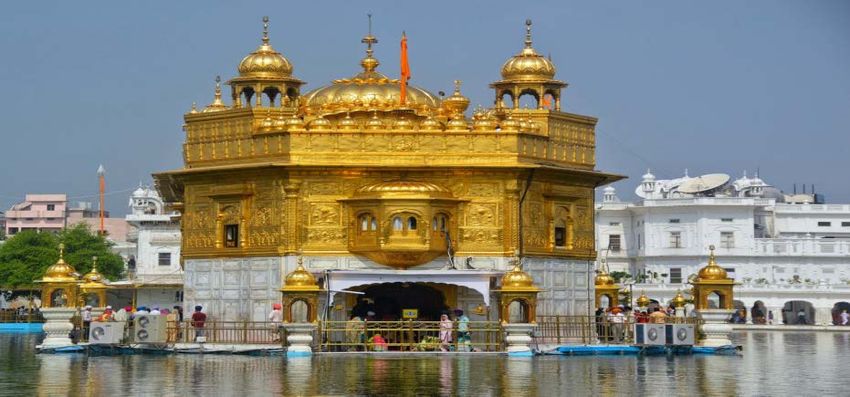
INTRODUCTION

4

Punjab fact file

                                                        Chandigarh
                                                               Capital            551 persons per sq km                       31.4 million
                                                                                      Population density                     total population

                                                           50,362 sq.km
                                                           geographical area               13.1 million                    14.6 million
                                                                                        female population                  male population

                                                                                                                                 895
                                                                                                                               Sex ratio
                                                            75.84%               administrative districts:   22      (females per 1,000 males)
     Key Insights                                           literacy rate

     • The state is bordered by the Pakistani province of Punjab to its west, Jammu & Kashmir in the north, Himachal Pradesh in the northeast, Haryana
       in the south and southeast, and Rajasthan in the southwest.
     • The most commonly spoken language of the state is Punjabi. Hindi and English are the other widely used languages.
     • Amritsar, Ludhiana, Jalandhar, Bhatinda, Mohali, Pathankot and Patiala are some of the major cities in the state.
     • The state has three major seasons - summer (April-June), rainy season (July-September) and winter (October-March). Due to the presence of
       large rivers, most of the state is a fertile plain. The state has three major rivers flowing through it: Ravi, Beas and Satluj.

 Source: Census 2011

 5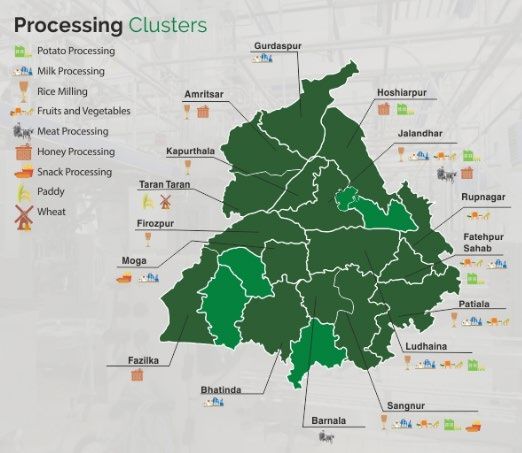
Advantage Punjab
Fertile and productive land Policy and fiscal incentives
The confluence of five rivers makes Punjab offers industries with a wide range of fiscal
Punjab’s agricultural land rich and and policy incentives under the Industrial and
productive. Approximately 82% of the state’s Business Development Policy, 2017.
land is under cultivation compared with the In order to improve the current cropping pattern and
national average of 40%. restructure the incentives, the state Government
Punjab is one of the largest wheat and rice introduced Agriculture Policy for Punjab 2013.
producers in India. It is also a leading
exporter of rice, including the well-known
Basmati variety.
High economic growth Strong infrastructure
Punjab has a well developed social
The state’s GSDP (in Rs.)
and industrial infrastructure. Its
increased at a compound annual
transport network is one of the best
growth rate (CAGR) of 6.78%
in India, with easy access to key
between 2015-16 and 2020-21.
markets such as the Delhi-NCR
The state provides investment region.
opportunities in sectors such as
Punjab has witnessed impressive
textiles, agro-based industries,
growth in the number of clusters
IT & ITeS, automotive and auto
and hubs, with the establishment of
components, sports goods and
several PPPs.
light engineering goods.
Source: Punjab economic survey, Department Of Industries & Commerce
6
State vision
1. EDUCATION 8. TRANSPORT
Provide quality education to all people, Connect all major towns by developing
even in rural areas, by building one four-lane and six-lane highways.
school after every 2 km. Establish Bus Rapid Transport Systems
Aim to provide education with practical (BRTS) in all major cities in the state.
1 8
knowledge through workshops and
industrial visits.
7. HEALTHCARE
2. INDUSTRIES Establish PHCs and specialty
Encourage SMEs through adequate hospitals covering wider areas.
2 7
financing and policy initiatives to Establish medical and nursing
increase employment. institutions to produce qualified
Set up an SEZ in each region and healthcare professionals
develop backward and border areas.
6. INVESTMENT
3. ENVIRONMENT
3 6
PROMOTION
Check the diversion of agriculture/forest Computerise Government departments
land for urbanisation and and adopt e-governance to enhance the
industrialisation. ease of doing business.
Ensure that industries adopt eco-friendly Attract investments from agro-based
and service sector industries.
4
technologies and rainwater harvesting.
5
4. INFRASTRUCTURE
Adopt a mix of energy Sources for power 5. AGRICULTURE
generation and at least one captive nuclear Diversify into other crops after considering their
power plant. global market demand.
Build international airports in each of the Adopt technology in all areas of agriculture and
regions of Majha, Malwa and Doaba. encourage organic farming..
7
Punjab in figures

     Punjab’s Contribution to Indian Economy (2019-20)                                            Physical Infrastructure in Punjab

 GSDP      GSDP as a percentage of all states’ GSDP                                                       Installed power capacity (MW) (February 2021)
           India: 100.0 | Punjab: 2.72
                                                                                                          India: 379,130.41 | Punjab: 14,376.29
           GSDP growth rate** (%)
           India: 9.80 | Punjab: 10.17                                                                    Wireless subscribers (million) (as of September 2020)
                                                                                                          India: 1,148.58 | Punjab: 37.18
           Per capita GSDP* (US$)
           India: 1,956 | Punjab : 2,651.05                                                               Internet subscribers (in September 2020) (million)
                                                                                                          India: 776.45 | Punjab: 27.96
     Social Indicators
                                                                                                          National highway length (km) (as of September 2019)
          Literacy rate (%)                                                                               India: 136,440 | Punjab: 4,099.12
          India: 74.04 | Punjab: 75.84

          Birth rate (per 1,000 population)                                                               Airports (No.)
          India: 20.4 | Punjab: 14.8                                                                      India: 125 | Punjab: 5

     Industrial Infrastructure                                                                     Investments (as of December 2020)

          Number of PPP projects (No.) (December 2019)                                                     Cumulative FDI equity inflows (from October
          India: 1,824 | Punjab: 62                                                                        2019 to December 2020) (US$ million)
                                                                                                           India: 75,351.56 | Punjab: 147.70
          Exporting SEZs (October 2020)
          India: 262 | Punjab: 3

 Note: *in Rs. terms, GSDP, per capita GSDP figures are taken at current prices, Exchange Rate used is average of 2017-18, i.e. 2018-19, i.e. US$ = Rs. 69.89, ** operational, Refer to
 Annexure for sources

 8
ECONOMIC SNAPSHOT

9

Economic snapshot – GSDP
GSDP of Punjab at Current Prices Per Capita GSDP of Punjab at Current Prices
90 CAGR (in Rs.) 6.78% 6 3,000 210,000
CAGR (in Rs.) 5.40%
80
5.56
180,000
5.42
5 2,500
78.84
5.25
179,163
2,541.67
70
75.16
74.61
172,340
2,454.66
171,556
73.05
2,417.08
2,374.16
4.71 150,000
155,781
60 4 2,000
2,133.31
4.27
63.64
143,124
2,023.63
59.59
3.90
120,000
132,467
50
3 1,500
40 90,000
30 2 1,000
60,000
20
1 500 30,000
10
0 0 0 0
2015-16
2016-17
2017-18
2018-19
2019-20
2020-21
2015-16
2016-17
2017-18
2018-19
2019-20
2020-21
US$ billion Rs trillion US$ Rs
At current prices, Punjab’s gross state domestic product The state’s per capita GSDP in 2020-21 was Rs. 172,340
(GSDP) reached Rs. 5.42 trillion (US$ 74.61 billion) in 2020-21. (US$ 2,374.16).
The state’s GSDP (in Rs.) increased at a CAGR of 6.78% The per capita GSDP (in Rs.) increased a CAGR of 5.40%
between 2015-16 and 2020-21. between 2015-16 and 2020-21.
Note: exchange rates used are averages of each year, BE- Budget Estimate
Source: Economic & Statistical Organisation of Punjab, MOSPI
10Economic snapshot – NSDP
NSDP of Punjab at Current Prices Per Capita NSDP of Punjab at Current Prices
CAGR (in Rs.) 6.86% CAGR (in Rs.) 5.47%
80 6 2,500 180,000
70
2,285.18
5 150,000
161,083
70.89
2,202.61
2,168.74
2,000
155,157
153,940
2,137.44
67.44
67.17
5.00
65.55
60
4.88
4.71
139,775
1,919.52
4 120,000
1,815.73
57.27
128,780
4.22
50
53.47
1,500
118,858
3.84
3.50
40 3 90,000
30 1,000
2 60,000
20
500
1 30,000
10
0 0 0 0
2015-16
2016-17
2017-18
2018-19
2019-20
2020-21
2015-16
2016-17
2017-18
2018-19
2019-20
2020-21
US$ billion Rs trillion US$ Rs
At current prices, Punjab’s net state domestic product (NSDP) The state’s per capita NSDP in 2020-21 was US$ 2,137.44.
reached Rs. 4.88 trillion (US$ 67.17 billion) in 2020-21.
The per capita NSDP (in Rs.) increased at a CAGR of 5.47%
The state’s NSDP (in Rs.) increased at a CAGR of 6.86% between 2015-16 and 2020-21.
between 2015-16 and 2020-21.
Note: exchange rates used are averages of each year,
Source: Economic & Statistical Organisation of Punjab, MOSPI
11Economic snapshot – Percentage distribution of GSVA
With a CAGR (in Rs.) of 7.88% between 2011-12 and 2020-21, the GSVA Composition by Sector at Current Prices
tertiary sector has been the fastest growing sector and was the
largest contributor to Punjab’s economy in 2020-21, with a 45.74% 100%
43.79% CAGR 45.74%
share in the state’s GSVA. This growth was driven by air transport, 90%
storage, financial services, real estate, ownership of dwelling &
80% 7.88%
professional services, public administration and other services.
70%
The primary sector contributed 31.58% to Punjab’s GSVA in 2020-21
60%
and increased at an 8.01% CAGR between 2011-12 and 2020-21;
25.39%
and the secondary sector rose at a 6.03% CAGR in the same period 50% 22.69%
and contributed 22.69% to Punjab’s GSVA in 2020-21. 40%
6.03%
30%
30.82% 31.58%
20%
10%
8.01%
0%
2011-12 2020-21
Primary Secondary Tertiary
Note: GSVA - Gross State Value Added
Source: Economic & Statistical Organisation of Punjab, MOSPI
12Economic snapshot – FDI inflow & investments
FDI Inflow in Punjab1 in April 2000-March 2020 (US$ million) Proposed Investments
Proposed
3,400 1,141 3,231
Year IEMs filed investments
2,900 (in US$ million)
2,400 618
2016 49 868.3
1,900
108
1,024 91 39 27 6
1,400 130 47
2017 34 280.4
900
400 2018 41 2,979.2
FY12
FY13
FY14
FY15
FY16
FY17
FY18
FY19
FY20
FY01-11
FY01-20
2019 57 263.70
According to the Department for Promotion of Industry and Internal Trade (DPIIT), cumulative FDI inflows in the state stood at US$ 147.70 million
between October 2019 and December 2020.
During 2019, Punjab Government received 57 IEMs with proposed investments of Rs. 1,843 crore (US$ 263.70 million). 838.01
Note: 1Includes Chandigarh, Punjab, Himachal Pradesh and Haryana, IEMs - Industrial Entrepreneur Memorandum Intentions
Source: Department for Promotion of Industry and Internal Trade (DPIIT), Invest Punjab
13Economic snapshot – Export
Merchandise Export from Punjab (US$ billion) Major Commodities Exported in 2020-21*
Basmati Rice
8.00
7.00 13% Cotton Yarn
6.78
6.00 Products of Iron and
6.03 8% Steel
5.61 5.79 5.61
5.00 5.28 Industrial Machinery for
Dairy etc.
4.00 7%
4.25 50% Bulk Drugs, Drugs
3.00 Auto Componets/Parts
6%
2.00
6% Cotton Fabrics
1.00 4% Buffalo meat
3% 4%
0.00
FY15 FY16 FY17 FY18 FY19 FY20 FY21* Others
Total merchandise exports from Punjab stood at ~US$ 5.61 billion in FY20 and US$ 4.25 billion in 2020-21*.
Basmati Rice, Cotton Yarn, Products of iron and steel and Industrial Machinery account for most of the share in the overall export from the state.
In 2020-21*, total exports of basmati rice from the state stood at US$ 535.77 million (~13%).
Note: *- Until January 2021
Source: Department of Industries and Commerce, Government of Punjab, DGCIS Analytics
14PHYSICAL INFRASTRUCTURE 15
Physical infrastructure – Roads
Punjab is well connected to its four neighbouring states and the rest Road type Road length (km)
of India through 15 national highways. Total length of the road Total Road Network 72,212
network in the state was 1,39,493 as per the state’s economic survey
National highways (March 2019) 3,274
2019-20.
State highways 1,503
As of March 2019, the state had 3,274 km of national highways. Rural roads 58,688
Under the State Budget 2021-22, Rs. 2,449 crore (US$ 337.46
million) has been allocated for roads and bridges, of which funds
worth Rs. 575 crore (US$ 79.23 million) were allocated to upgrade,
construct and repair 560 kms of roads and bridges in FY22. Total
funds worth Rs. 160 crore (US$ 22.05 million) were proposed for
improvement of 124 rural roads. A total of Rs. 250 crore (US$ 34.45
million) has been set aside, under the Central Road Fund (CRF)
scheme, for various works on 308 kms of road.
In September 2020, the state government initiated 12 major projects
to improve road connectivity in the state under the Central Road and
Infrastructure Fund (CRIF) at a cost of Rs. 211.22 crore (US$ 28.86
million).
Source: Ministry of Road Transport & Highways, State Budget 2021-22, Ministry of Road Transport and Highways, Maps of India
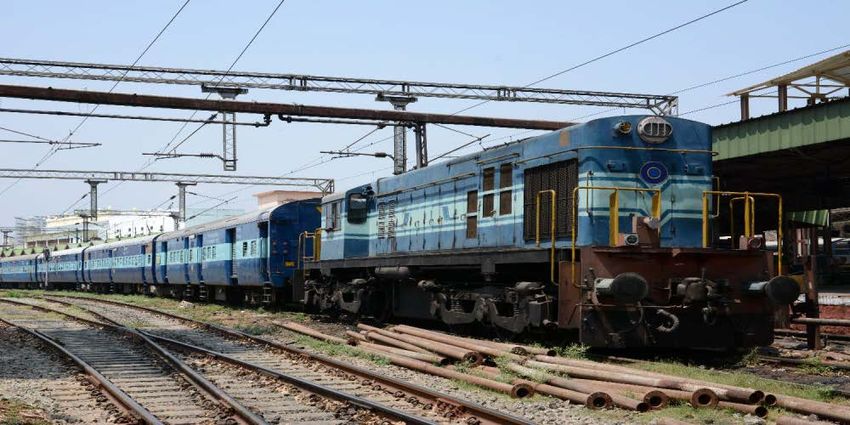
16Physical infrastructure – Railways
The railways play a major role in the state, connecting major
industrial units in the oil refining, cement, fertiliser, thermal power
and manufacturing sectors to suppliers and markets.
Punjab’s railway network is more than two times that of the country’s
average rail density. In 2018-19, commissioning of 4,100 km of
railway tracks is targeted which includes 1,000 km of new lines,
1,000 km of gauge conversion and 2,100 km of doubling.
As per Punjab Economic Survey 2019-20, the state had a railway
track network of 2,765 kms.
Indian railways have built freight corridors—Eastern Freight Corridor
from Ludhiana to Dankuni (1,856 km) under its arm Dedicated
Freight Corridor Corp. of India Ltd (DFCCIL).
As of August 2019, tenders have been allotted for the doubling of
railway track between Rajpura and Bathinda under a project that will
cost Rs. 1,769.24 crore (US$ 253.14 million).
Source: Maps of India
Source: Punjab Bureau of Investment Promotion, Punjab Economic Survey, Ministry of Railways, Government of India
17Physical infrastructure – Airports
Punjab has four operational airports; two domestic airports and two
international airports. Non-operational airports are expected to be
started under the Government of India’s regional connectivity
scheme of UDAN - Ude Desh ka Aam Naagrik.
International flights operate from the “Sri Guru Ram Dass Jee
International Airport” at Amritsar and Chandigarh airport.
In 2019-20, Amritsar Airport handled 2.45 million passengers and
2,180 metric tonnes of freight, while Chandigarh Airport handled 2.44
million passengers and 8,939 metric tonnes of freight. International airport
Domestic airport
In December 2019, Government announced development of MRO
facility at Patiala Aviation Complex. Airport indicators
Airport indicators (From April 2020 to January 2021)
Airport Statistics
Aircraft movements Passengers Freight
Airport (in no) (in no.) (in MT)
2019-20 2020-21 2019-20 2020-21 2019-20 2020-21
Amritsar 1,921 1,032 20,99,571 5,84,965 14,459 5,745
Chandigarh 7,812 6,198 20,47,447 9,06,122 15,103 8,782
Note: ^- until November 2020
Source: Airport Authority of India, News Articles
18Physical infrastructure – Power
Installed Power Capacity (MW) Break-up of Installed Capacity (FY20)
10% 1%
14,376
14,265
14,205
14,162
13,432
12,000
Thermal Power
8,000 Hydropower
27%
Renewable Power
62%
4,000 Nuclear Power
0
FY17 FY18 FY19 FY20 FY21*
As of February 2021, Punjab had a total installed power generation capacity of 14,376.29 MW, of which 4,214.54 MW was under the central
sector, state utilities (3,281.20 MW) and private sector (6,880.55 MW). Of the total installed power generation capacity, 8,765.51 MW was
contributed by thermal power, 3,809.12 MW by hydropower and 1,604.85 MW by renewable energy.
Punjab Energy Development Agency (PEDA) is the nodal organisation for renewable energy development in the state.
The Government of Punjab is continuously focusing on usage of renewable Sources of energy. Total investment potential for a target renewable
energy generation capacity of 5,400 MW is projected to be US$ 6 billion by 2022. The state Government aims to achieve a target of 4,200 MW
capacity additions in solar energy by 2022. and 300 MW of power generation using biomass by 2022.
Energy requirement in the state was 50,598 million units in 2019-20.
Note: MW- Megawatt ; *- Until February 2021
Source: Central Electricity Authority, Punjab Bureau of Investment Promotion
19Physical infrastructure – Telecom
Telecom Infrastructure (as of September 2020)
Wireless subscribers (million) 38.83
Wireline subscribers (million) 0.68 Performance status of Bharat Net Project
Service-ready GPs (November 2020) 12,795
Internet subscribers (million) 27.96
Teledensity (in %) 125.66
As of September 2020, Punjab had 38.83 million wireless and 0.68 wireline subscribers.
The number of internet subscribers in the state stood at 27.96 million, as of September 2020.
Punjab had a total teledensity of 125.66%, as of September 2020.
Note: GP - Gram Panchayat
Source: Telecom Regulatory Authority of India; Department of Telecommunications- Ministry of Communications & Information Technology
20Physical infrastructure – Urban
Selected smart cities in Punjab
There are 167 towns and cities in Punjab and the state has 40% of
its population in urban areas. Cities Population Area (sq km) Literacy rate
Under the Urban Infrastructure and Governance (UIG) programme, Amritsar 2,490,656 2,683 76.27%
five additional projects have been sanctioned and are in the transition Jalandhar 2,193,590 2,624 82.48%
phase. Some of the key areas of development are roads and
Ludhiana 3,498,739 3,578 82.20%
flyovers, water supply, sewerage and solid-waste management.
Out of 100 smart cities to be created across India, Punjab has three
Chandigarh - The original planned city
smart cities for the state, which include Amritsar, Jalandhar and
Chandigarh, the joint capital city of Haryana and Punjab, was
Ludhiana.
developed as a planned city. It is also a union territory.
As of December 2018, work on Jalandhar’s Integrated Command Today, it has expanded in terms of industry as well as population.
and Control Centre (ICCC) had been started as a part of making it a Chandigarh still remains a model for many other Indian cities in
smart city. terms of civic amenities.
It has one of the best electricity distribution systems in India. The
Under the State Budget 2021-22, Rs. 1,600 crore (US$ 220.47 Union Ministry of Power selected it as one of the few model
million), Rs. 1,400 crore (US$ 192.91 million) and Rs. 114 crore distribution centres in the country.
(US$ 15.71 million) have been allocated for Smart Cities, AMRUT The Municipal Corporation of Chandigarh is responsible for its urban
and Swachh Bharat Mission (Urban), respectively. infrastructure facilities including water supply, sewerage, roads, slum
development, fire service, environment, city beautification and house
tax.
Source: Ministry of Urban Development, Government of India; Department of Planning, Government of Punjab, State Budget 2021-22
21SOCIAL INFRASTRUCTURE 22
Social infrastructure – Education
Higher Education Infrastructure (2018-19) School Education Statistics (September 2017)
Government Colleges 199 Schools 28,898
Government Universities 10
Enrolment in Schools 19.16
Private Aided Colleges 179
College 1,063
Private Universities 15
Deemed Universities 1 Enrolment in College 549,972
Punjab has a literacy rate of 76.7%; male literacy rate is 81.5% and female literacy rate is 71.3%. Literacy rate in Punjab’s urban areas is 83.2%
and in rural areas it is 71.4%.
Under the Rashtriya Uchchatar Shiksha Abhiyan (RUSA), ten new degree colleges have been proposed for Rs. 50 crore (US$ 3.56 million).
In March 2021, Union Education Minister Mr. Ramesh Pokhriyal ‘Nishank’ announced opening of a new Kendriya Vidyalaya in Punjab.
Under the State Budget 2021-22, the government has allocated Rs. 11,861 crore (US$ 1.63 billion) for school education. Of the total, the
government allocated the following funds to selected categories:
• Rs. 350 crore (US$ 48.23 million) for mid-day meals.
• Rs. 50 crore (US$ 6.89 million) for procuring computers in primary schools.
• Rs. 140 crore (US$ 19.29 million) for digital education.
• Rs. 100 crore (US$ 13.78 million) for smart phones.
Source: Economic Survey of Punjab, Census 2011, UDISE, AISHE 2017-18
23Social infrastructure – Health
Health Infrastructure (as of May 2019) Health indicators (SRS Bulletin September 2018)
Sub-Centres 4,069 Population served per hospital bed* 1,100
Primary Health Centres 566 1
Birth rate 14.8
Community Health Centres 369
1
Death rate 6.6
Sub District Hospitals 55
2
District Hospitals 31 Infant mortality rate 20
Total 5,090
The public healthcare infrastructure of the state has a 3-tier structure comprising hospitals, primary health centres and sub-centres, health units &
community health centres. Around 90% of non-hospital healthcare & 67% of hospital care cases are handled by private healthcare services.
Under Budget 2021-22, Rs. 3,822 crore (US$ 526.65 million) has been allocated for health and family welfare to strengthen health infrastructure
of the state.
The state Government is implementing the Integrated Disease Surveillance Programme (IDSP) to identify outbreaks of communicable diseases
and respond to them in an effective manner.
Source: Economic Survey of Punjab, State Budget 2021-22; Punjab Bureau of Investment Promotion; 1Per thousand persons; 2Per thousand live births, * As of 2016
24INDUSTRIAL INFRASTRUCTURE 25
Industrial infrastructure…(1/2)
Punjab State Industrial Development Corporation Ltd (PSIDC) and Punjab Small Industry and Export Corporation (PSIEC) are responsible for
developing industrial infrastructure in the state. Punjab Agro Industries Corporation (PAIC) is responsible for developing agro-based units.
In 2017-18, the state Government announced plans to develop 16 specific industrial parks. There is also a plan to set up MSME Facilitation
Councils at regional level at Ludhiana, Jalandhar, Amritsar and Patiala for providing effective facilitation services to MSME units.
Name/Developer Area Primary industry
Operational SEZ
Ranbaxy Laboratories Ltd. Mohali Pharmaceuticals
Quarkcity India Pvt. Ltd. Mohali IT/ITeS
Infosys Ltd. Mohali, Punjab IT/ITeS
Formal approved SEZ
Lark Projects Private Limited Mohali, Punjab Electronic hardware and software
Sukhm Infrastructure Pvt Ltd. Mohali IT
Quarkcity India Pvt. Ltd. Mohali, Punjab IT
Ranbaxy Laboratories Ltd. Mohali, Punjab Pharmaceuticals
Infosys Ltd. Mohali, Punjab IT/ITeS
Notified SEZ
Quarkcity India Pvt. Ltd. Mohali, Punjab IT
Ranbaxy Laboratories Ltd. Mohali, Punjab Pharmaceuticals
Infosys Limited Mohali, Punjab IT/ITes
Source: Department of Planning, Government of Punjab, Ministry of Commerce & Industry
26Industrial infrastructure…(2/2)
Name and location Primary industry Description
Electronics Township Set up by Punjab Information and Communication Technology Corporation Limited
Electronics
(ELTOP), Mohali (Punjab Infotech) for the promotion and growth of the electronics industry in the state.
Clusters identified for bicycles and bicycle parts (Ludhiana), steel re-rolling (Mandi
Industry clusters Industry specific Gobindgarh), textiles (Ludhiana), sports and leather goods (Jalandhar), and woollens
(Amritsar).
Joint initiative of a Non-Resident Indian (NRI) group and Punjab Agro Industries
Food Park Project, Corporation; spread over 25 acres and one of India's largest and most sophisticated
Sirhind, Fatehgarh Agro-processing integrated vegetable and fruit processing complexes with support facilities for an annual
Sahib District capacity of over 5,000 million tonnes (MT) frozen storage facility and 5,000 MT cold
storage facility.
Apparel Park, Doraha, Integrated textile park with 115 plots jointly developed by Punjab Small Industry and
Textiles
Ludhiana Export Corporation Limited and the Association of Textile Industry.
Biotech Park, Dera Has all the basic facilities including water, electricity, R&D lab and sewage treatment
Biotech
Bassi, Chandigarh facility, etc.
IT and electronics; SEZ status granted to QuarkCity in Mohali to promote IT and electronics sectors and to
SEZ, Mohali
pharmaceuticals Ranbaxy’s SEZ at SAS Nagar, Mohali.
Source: Department of Planning, Government of Punjab, Ministry of Commerce & Industry
27KEY SECTORS 28
Key sector – Agricultural and allied industries…(1/3)
Area and production of horticulture crops (2019-20)
Year Area (‘000 Ha) Production (‘000 MT)
Fruits 98.73 2106.12
Vegetables 264.59 5537.82
Spices 34.66 121.87
Aromatics &
13.20 2.79
Medicinal
Honey - 15.80
In 2019-20, the total production of horticulture crops in the state was expected to be 413.30 thousand metric tonnes and area under
production was 7,797.65 thousand hectares. In 2019-20, the total production of vegetables and fruits was estimated at 5,537.82 thousand
metric tonnes and 2,106.12 thousand metric tonnes, respectively.
In the state, Basmati rice is the most exported commodity and exports reached US$ 535.77 million in between April 2020 and January
2021.
Total food grain production during 2018-19 stood at 31.54 million metric tonnes as per state’s economic survey 2019-20. Horticulture
production in the state reached 7,342.12 thousand metric tonnes in 2018-19, as per the third advance estimates.
Note: *3rd advance estimates
Source: Department of Agriculture, Government of Punjab, Punjab Economic Survey, Department of Agriculture Cooperation and farmers Welfare
29Key sector – Agricultural and allied industries…(2/3)
In Union Budget 2021-22, the government announced that over the next
three years, a new umbrella programme, Kamyab Kisan Khushaal Punjab,
with a budget of Rs. 3,780 crore (US$ 520.86 million), will be
implemented. Further, funds worth Rs. 1,104 crore (US$ 152.12 million)
have been allocated for FY22. While additional Rs. 200 crore (US$ 27.56
million) has been allocated for crop diversification under the Krishi Vikas
Yojana to ensure more inclusive and effective development of agriculture
and allied services.
The government will set up two new agricultural colleges at Gurdaspur
and Balachaur with the initial allocation of Rs. 14 crore and the Agricultural
Marketing Innovation Research and Intelligence Centre (AMIRIC) in
Mohali under PAU, Ludhiana.
By 2025, it is expected that the state will be among the leading producers
of non-food grains as well as exporter of various agri-products.
Three mega food parks and one food park in Punjab have been notified by
the Ministry of Food Processing Industries out of which one mega food
park is operational and second is partially operational as of April 2019.
Government plans to make third mega food park at Phagwara operational
by 2020.
Source: Ministry of Food Processing Industries
30Key sector – Agricultural and allied industries…(3/3)
Key players
A subsidiary of Nestle SA, Switzerland, the company started milk collection in Moga, Punjab, in 1961 and has
expanded operations to a network of more than 85,000 farmers.
The company has its processing unit in Moga.
Nestle India
MILKFED (The Punjab State Cooperative Milk Producers' Federation Ltd) was formed in 1973 with the objectives
of providing remunerative prices to milk producers in the state, marketing their produce and providing technical
inputs for the enhancement of milk production.
The company has a strong network of about 7,370 milk producers’ cooperative societies at the village level, 12
milk plants and two cattle-feed factories.
MilkFed
Punjab Markfed is a marketing federation of over 3,069 societies. The cooperative has won recognition and many
awards from the Government of India in several areas of excellence; Markfed represents the interests of over a
million farmers in the state.
Markfed
31Key sector – IT, electronics and light engineering goods…(1/2)
Punjab’s IT policy and the incentives offered to the IT industry are Light Engineering Goods Exports from Punjab
(US$ million)
aimed at promoting Punjab as an attractive destination for the industry.
Mohali has been developed as an IT and ITeS hub in the state. 250
The light engineering goods industry in Punjab includes bicycle and
229
bicycle parts, machine tools/hand.
200
Hand tools such as wrenches, hand drills, pullers, vices, hammers, 199
195
188
screw drivers, pliers, spanners, etc., are manufactured mainly in 182
Ludhiana and Jalandhar. Sewing machines and their parts are mostly 169
150
manufactured in Jalandhar. 151
146 146
141
The machine tools industry comprising lathes, shapers, milling
machines, drilling machines and special purpose machines for different 100 107 103
industries is mainly concentrated in Batala and Ludhiana. 97
91
The state received investments worth Rs. 605 crore in the IT and ITeS
50
sectors in FY20.
Target EveryOne IT Private Limited, Aeren IT Solutions, Vertex Infosoft
Solutions, Mark Software Systems, Entella Private Limited, Miran
0
Informatics and EON Infotech are among firms (including some start- FY15 FY16 FY17 FY18 FY19 FY20 FY21*
ups) that have set up their software development units and IT services Hand Tools, Cutting Tools of Metals Bicycle and Parts
facilities in the state.
Note: STPI - Software Technology Parks of India, Data is as per latest available information, *- Until January 2021
Source: Department of information and Technology, Government of Punjab
32Key sector – IT, electronics and light engineering goods…(2/2)
Key players
Infosys, which recorded consolidated revenues of US$ 2.69 billion in Q3 FY18, has thirty two development centres
across the country, with one in Mohali, set up in 2001. The Mohali centre is equipped with the latest technology
and solutions for enterprise networking, office productivity, collaborative software engineering and distributed
project management.
Infosys Ltd In 2014, Infosys started work from at its IT unit at Mohali.
APLAB Ltd is a public enterprise incorporated in 1962 to provide solutions to business sectors such as
telecommunication, IT, retail banking, retail fuel-dispensing as well as power control and conditioning. The
company has four independent product divisions: test and measurement equipment, power conversion and
Uninterrupted Power Systems (UPS), self-service terminals for banking, and self service terminals for petroleum
sectors. In Punjab, the company has presence in Chandigarh, Ludhiana, Amritsar and Jalandhar.
APLAB Ltd
A part of the Hero Group and among the world’s largest producers of bicycles, the company‘s annual bicycle
production is 19,500 cycles per day. It started exporting to Africa and the Middle East in 1963. Today, more than
50% of its bicycle exports are to Europe and the US. It has tied up with National Bicycle Industries, a part of the
Matsushita Group, Japan, to manufacture high-end bicycles. It has a manufacturing unit in Ludhiana.
Hero Cycles
Swaraj Engines Ltd Pabla is a leading manufacturer and exporter of superior quality bearings, agricultural machinery bearings, home
appliances bearings, auto bearings, two-wheeler auto bearings, four-wheeler auto bearings, etc. The company is
based in Ludhiana, Punjab. Its major markets include India, Indonesia, Sri Lanka, Egypt, Europe, Middle East,
PABLA Bearings Ltd Bangladesh, Thailand and Singapore.
33Key sector – Textiles…(1/2)
Current projects in Punjab
Textiles Exports from Punjab (US$ million)
Name of textile
Location Area Key activity
park 800
Circular knitting, flat 700
Ludhiana 690
knitting- manual and 600
Integrated Ludhiana 60
computerized 594
Textile Park 500
garmenting 511
400 464
Rhythm Textile Shaheed Bhagat
20 Garmenting & knitting 300 333
& Apparel Park Singh Nagar 349 324
291
Production of towels, 200
181 206
Lotus Integrated melange yarn, 100
Barnala 100 121 124
Textile Park bathrobes and training 0
center FY16 FY17 FY18 FY19 FY20 FY21*
Punjab Apparel Production of Cotton Yarn Ready Made Garments of Manmade Fibres
Ludhiana 85
Park readymade garments
The textile sector in the state is strong on all aspects of the value chain, i.e., from the raw material stage to the finished products (garments) stage.
Punjab is among the largest producers of cotton and blended yarn as well as mill-made fabrics in India. Ludhiana is often referred to as the
‘Manchester of India.
In 2019-20, cotton production in the state is estimated at 13.00 lakh bales.
In FY21*, Punjab exported cotton yarn worth US$ 323.66 million and ready-made garments (man-made fibres) worth US$ 123.55 million.
Note: *- Until January 2021
Source: Ministry of Textiles, Government of India, Central Silk Board , Department of Agriculture Cooperation And Farmers Welfare, Punjab Economic Survey, DGCIS Analytics
34Key sector – Textiles…(2/2)
Key players
The Nahar Group of companies is also known as the OWM Group. The group’s portfolio comprises spinning,
knitting, fabrics and hosiery garments. It operates seven firms: Oswal Woollen Mills Ltd, Nahar Spinning Mills Ltd,
Nahar Industrial Enterprises Ltd, Nahar Poly Films Ltd, Monte Carlo Fashion Ltd, Cotton County Retail Ltd and
Nahar Group of Nahar Capital & Financial Services Ltd. Most of its manufacturing facilities are located at Ludhiana and Mohali.
Companies
Vardhman Textiles Limited, formerly Mahavir Spinning Mills Limited, is a large textile producer in India. The
company operates in five segments: yarn, sewing thread, steel, fibre and fabric. The yarn segment comprises
production of various types of yarns (cotton, manmade fibres and blends) and yarn processing activities.
The company has its corporate office at Ludhiana, yarn manufacturing units at Ludhiana, Hoshiarpur and
Malerkotla and dyeing units at Ludhiana and Hoshiarpur. The company recorded total revenues of US$ 244.3
million in Q3 FY18.
Vardhman Group
JCT Limited, one of the leading manufacturers of textiles and filament yarn, is the flagship company of the Thapar
group. It has operations in two distinct businesses: cotton, synthetic and blended textiles, and nylon filament yarn.
The company has an integrated textile facility at Phagwara, Punjab.
JCT Ltd
35Key sector – Petrochemicals and fertilizers…(1/2)
Industrial activity in the petrochemicals and fertiliser categories Fertiliser Requirement and Sales in Punjab (for November 2020)
includes refining, petrochemicals, chemicals, fertilizers and other
Requirement Sales
related products and distribution. Type
(MT) (MT)
Under “Soil Health Management (SHM), various initiatives have been Urea 400,000 217,507.74
taken by the Government. One of the major initiatives in the fertiliser
sector is strengthening the existing quality control procedures for Diammonium Phosphate (DAP) 180,000 78177.3
fertilisers in laboratories.
Muriate of Potash (MOP) 15,000 4547.55
Nitrogen-Phosphorus-Potassium
15,000 2230.4
(NPK)
Some of the key players
Hindustan Petroleum Corporation Ltd
National Fertilisers Ltd
Punjab Chemicals and Crop Protection Ltd
Punjab Alkalies & Chemicals Ltd
Source: The Fertilisers Association of India, Department of Fertilizers
36Key sector – Petrochemicals and fertilisers…(2/2)
HPCL is a Fortune 500 company.
HPCL-Mittal Energy Limited (HMEL), a joint venture company of HPCL with Mittal Energy Investments Pte
Hindustan Petroleum Limited, has set up a state-of-the-art, 9 million metric tonnes per annum (MMTPA) refinery at Bathinda in Punjab.
Corp Ltd (HPCL)
NFL is one of the largest producers of nitrogenous fertilisers in the country. It is actively promoting the use of bio-
fertilisers in the state and produces neem-coated urea at its facility in Bhatinda.
National Fertilizer Ltd
Punjab Chemicals and Crop Protection Limited is engaged in the business of agrochemicals; it manufactures
technical grade pesticides, herbicides, fungicides and biocides, as well as their formulations. The company has
presence in both domestic and international markets. It has its registered office in Chandigarh.
Punjab Chemicals and
Crop Protection Ltd
Swaraj Engines Ltd
Punjab Alkalies & Chemicals Limited’s three principal products include caustic soda lye, chlorine and hydrochloric
acid. Its plant is located at Naya Nangal in Punjab.
Punjab Alkalies &
Chemicals Ltd
37KEY PROCEDURES AND POLICIES 38
Three-tier single-window clearance mechanism…(1/2)
The Single-Window Clearance Mechanism (SWM) has been Single-Window Clearance Mechanism in Punjab
established under the Punjab Industrial Facilitation Act, 2005, with
the following three-tier structure to grant exemption/relaxation from
any of the provisions/rules of the act:
Chief Minister of State
• District Single-Window Clearance Committee: Instituted in Punjab Board
each district of the state, the committee is chaired by the Deputy
Commissioner and has the senior-most officers of district
departments as its members. Chief Secretary Empowered Committee
• Empowered Committee: This committee is chaired by the Chief
Secretary to the Government of Punjab and has the principal
secretaries of state departments as its members. Deputy District Single Window Clearance
Commissioner Committee
• State Board: The board has the Chief Minister of Punjab as its
chairman and ministers of state departments as its members.
Source: Department of Industry, Government of Punjab
39Three-tier single-window clearance mechanism…(2/2)
Level Nodal agency Composition & role
The agency members include officers from the Punjab State Electricity Board (PSEB),
Punjab Pollution Control Board (PPCB), Punjab Infotech, PSIDC, PFC, PSIEC,
Department of Labour, PAIC and the Directorate of Industries.
State-level Udyog Sahayak The agency handles the composite application forms received from entrepreneurs and
assists in obtaining clearances from various departments within the stipulated time
period. It also provides guidance and information to investors about policies and
programmes; it is monitored by an empowered committee.
The DIC is headed by the general manager at the district level and includes the
environmental engineer of the PPCB, the superintending engineer/executive engineer
District-level DIC of PSEB, the district officer of the Housing and Urban Development Authority and the
assistant director of factories from the Directorate of Factories. The DIC provides
sanctions and clearances for setting up small scale industrial units in the state.
Source: Department of Industry, Government of Punjab, PSIDC: Punjab State Industrial Development Corporation Ltd, PFC: Punjab Financial Corporation, PSIEC: Punjab Small Industries
& Export Corporation Limited, PAIC: Punjab Agro Industries Corporation Limited
40Key investment promotion offices
Agency Description
Punjab Small Industry and Export
Focuses on the development of SSI units and promotion of exports.
Corporation Limited
(PSIEC) Responsible for setting up industrial focal points.
Punjab Finance Corporation
(PFC) Provides medium and long term loans for setting up new industrial units, expanding existing units and
reviving sick units in the state (loan limits set by the State Financial Corporation Act, 1951).
Punjab Agro Industries Corporation Acts as the promoter for agro-based industries in Punjab and provides inputs such as fertilisers,
(PAIC) machinery, seeds and pesticides to farmers.
Assists investors in obtaining all necessary approvals for new projects and facilitates contract farming.
Promotes large- and medium-scale projects in the state.
Punjab State Industrial Development
Corporation Limited Provides escort services, especially for industrial ventures, and has been instrumental in facilitating the
(PSIDC) projects of Godrej-GE (white goods), Century Textiles (pulp and paper), Gujarat Ambuja (cement), ICI
(paints) and HPCL-Saudi Aramco (mega project for gas).
Acts as an infrastructure developer and financial facilitator.
Source: Department of Industry, Government of Punjab
41Contact list
Agency Contact information
Udyog Bhawan
18, Himalaya Marg, Sector-17/A
Punjab Small Industry and Chandigarh-160017
Export Corporation Limited Phone: 91-172-2704756, 2704865, 2702751, 2702656
(PSIEC) Mob: 09814700407
Fax: 91-172-2702039
E-mail: psiec_chd@yahoo.co.in
Udyog Bhawan
Punjab State Industrial 18, Himalaya Marg, Sector-17
Development Corporation Chandigarh-160 017
-
Limited Phone: 91-172-2704040, 2702881-84, 2702 791
(PSIDC) Fax: 91-172-2704 145
E-mail: psidc@rediffmail.com, psidcltd@yahoo.co.in
42Key approvals required
Service or facility Agency Timelines
Industrial License/Sponsorship for raw
materials and inputs/Land allotment 2 weeks/4 weeks/4 weeks
Department of Industries
• Sales tax exemption: 1 week
Incentives Udyog Sahayak • Investment incentive: 4 weeks
• Other incentives: 2 weeks
Sanction of loan PFC/PSIDC 8 weeks
• Load up to 20 kW: 8 weeks
• Load from 21-100 kW: 12 weeks
Release of power connection PSEB
• Load from 101-500 kW: 12 weeks
• Load above 500 kW: 90 days
Site approval/environmental clearance 60 days
Adequacy certificate Department of Environment,
30 days
No-objection certificate Pollution Control Board
Green category: 15 days
Red category: 30 days
Source: Department of Industry, Government of Punjab
43List of approvals – Punjab bureau of investment promotion
Regulatory Authority Power vested with PBIP (Punjab Bureau of Investment Promotion)
Consent to establish
Consent to operate (under Water Act & Air Act)
Authorization under Hazardous Waste Rules
Registration for Recycling of Hazardous Waste Rules
Punjab Pollution Control Board (PPCB) CSA Clearance
Authorization under E-waste Rules, 2011
Registration under Plastic Rules
Authorization for Bio Medical Waste Disposal
Site appraisal/approval
Excise & Taxation VAT Incentives
Labour Shop Registration
Permission for engaging contractor for labour
Annual returns under Labour Laws
Factories Department Factories License
Annual Filling under Factories Act
Factory Building Plan approval
Industries Registration under Boilers Act
Housing and Urban Development Change of land use and approvals of building plans
Source: Punjab Bureau of Investment Promotion
44Cost of doing business in Punjab
Cost parameter Cost estimate
Industrial land (per sq mt) Mohali: US$ 35.42, Ludhiana: US$ 17.71, Amritsar: US$ 11.10
Office space rent (per sq ft per month) US 17 cents to US 32 cents
Residential rent (2,000 sq m house per month) US$ 287-US$ 478.72
5-star hotel room (per night) US$ 57.45- US$ 80.43
Electricity (per kWh) US 8.6 cents
Water Commercial and industrial: US 14.0 cents per 1,000 litres
Source: Ministry of Labour and Employment, Government of India, Punjab State Electricity Regulatory Commission, Industrial Sources, Municipal Corporation Mohali
45State acts and policies…(1/2)
Tourism Policy, 2018
1
To promote tourism and to double the annual tourist visits in the State from 25 million
to 50 million in the next five years by creating new infrastructure and improving the
existing one.
Promotion of Agricultural Mechanisation for In-Situ Management of Crop
Residue
2
• Central Sector Scheme on ‘Promotion of Agricultural Mechanisation for In-Situ
Management of Crop Residue in Punjab, Haryana, Uttar Pradesh and NCT of
Delhi’
Between FY19 and FY21, Rs. 1,726.67 crore (US$ 237.42 million) have been
provided to the following states—Punjab, Haryana, Uttar Pradesh and NCT of
Delhi.
SPIRE Punjab 2016
3
Develop 10 top class start up hubs and bring in place 3 world class accelerators to
support the efforts by 2021.
To make available 50,000 sq. ft. incubation space for startups.
46State acts and policies…(2/2)
One Nation One Ration Card system reform
In February 2021, Punjab became the 13th state in the country to successfully
4 undertake ‘One Nation One Ration Card’ reform, making it eligible to mobilise
additional funds worth Rs.1,516 crore (US$ 208.90 million) through open market
borrowings.
Agriculture Policy for Punjab, 2013
The State Agriculture Policy aims to address various interlinked concerns of
5
sustainability of the current cropping pattern and stagnating farm incomes through a
simultaneous and multi-pronged action with an emphasis on improvement in
production technology and infrastructure, pushing up capital formation, restructuring
the incentives and streamlining the institutions.
New and Renewable Sources of Energy (NRSE) Policy, 2012
6 To maximise and improve the share of new and renewable Sources of energy to
10% of the total installed power capacity in the state by 2022.
47Investment promotion…(1/2)
Industry Type Investment Promotion
Food Park - Kapurthala: Aid in meeting current and future market requirements
Agro and food processing Food Park - Ladhowal: Provide modern infrastructure facilities for food processing
Mega Food Park - Fazilka: multi-dimensional food processing infrastructure facility
Excellent infrastructure in terms of availability of power and connectivity
Light engineering
Good record of industrial relations
Punjab accounts for 14% of the total cotton yarn production in India
Textile South western region of the state, comprising of Mansa, Muktsar, Bathinda and Faridkot, is the main cotton
producing area in Punjab.
Area of 1,700 acres is available for immediate development, located in the vicinity of the Sri Guru Ram Dass
Information technology Jee International Airport (Amritsar) and the railway station
40 acres of land in the IT City has been earmarked for electronics and hardware companies
Medicity comprises 260 acres for the development of world class hospitals, pharmaceutical and bio-
Bio-Science and health care technology institutions, research centres and a medical college.
Phase I of development of Medicity is underway with the setting up of Tata Cancer & Research Hospital.
Ensure availability of quality power to industrial and domestic users at competitive prices
Bus Rapid Transit Systems (BRTS) have been planned in the major cities of the state to augment the urban
Infrastructure and renewable
infrastructure
energy
State has plans to further augment the road infrastructure with four and six lane expressways to connect all
the major towns of Punjab
Source: Punjab Bureau of Investment Promotion
48Investment promotion…(2/2)
Industry Type Investment Promotion
In the next four years, Punjab plans to provide all its 147 cities and towns with planned development
Housing and real estate including 24 x 7 availability of quality power, 100% coverage for sewerage, solid waste management facilities
and projects to ensure smooth traffic flow
Land measuring 1,500 acres is under acquisition for development of an Integrated Knowledge/ Education city
Education and skills development Land is available for setting up of universities, higher education institutes, R&D institutions and colleges in
various disciplines.
Major cities like Amritsar, Jalandhar, Ludhiana connected via the corridor
Major expansion of infrastructure using the Public-Private Partnership (PPP) approach
Amritsar-Kolkata Industrial
Access to north and north eastern markets regions, which house 40% of India’s population
Corridor
Easy movement of freight across states
Push for industrialization and job creation
Source: Punjab Bureau of Investment Promotion
49APPENDIX 50
Sources

                       Data                                                                     Sources

 GSDP (state)                                   Economic & Statistical Organisation of Punjab

 Per capita GSDP figures                        Directorate of Economics & Statistics of Punjab, Central Statistics Office

 GSDP (India)                                   Central Statistics Office

  Installed power capacity (MW)                 Central Electricity Authority

  Wireless subscribers (No)                     Telecom Regulatory Authority of India

  Internet subscribers (million)                Telecom Regulatory Authority of India

  National highway length (km)                  NHAI, Roads and Building Department-Government of India

  Airports (No)                                 Airports Authority of India

  Literacy rate (%)                             Census 2011

  Birth rate (per 1,000 population)             SRS Bulletin September 2018

  Cumulative FDI equity inflows (US$ billion)   Department for Promotion of Industry and Internal Trade

  Operational PPP projects (No)                 DEA , Ministry of Finance, Government of India

 51
Exchange rates
Exchange Rates (Fiscal Year) Exchange Rates (Calendar Year)
Year Rs. Equivalent of one US$ Year Rs. Equivalent of one US$
2004-05 44.95 2005 44.11
2005-06 44.28 2006 45.33
2006-07 45.29 2007 41.29
2007-08 40.24 2008 43.42
2008-09 45.91 2009 48.35
2009-10 47.42 2010 45.74
2010-11 45.58 2011 46.67
2011-12 47.95 2012 53.49
2012-13 54.45 2013 58.63
2013-14 60.50 2014 61.03
2014-15 61.15 2015 64.15
2015-16 65.46 2016 67.21
2016-17 67.09 2017 65.12
2017-18 64.45 2018 68.36
2018-19 69.89 2019 69.89
2019-20 70.49 2020 74.18
2020-21 72.59 2021* 73.69
Note: As of February 2021
Source: Reserve Bank of India, Average for the year
52Disclaimer India Brand Equity Foundation (IBEF) engaged Sutherland Global Services private Limited to prepare/update this presentation. All rights reserved. All copyright in this presentation and related works is solely and exclusively owned by IBEF, delivered during the course of engagement under the Professional Service Agreement signed by the Parties. The same may not be reproduced, wholly or in part in any material form (including photocopying or storing it in any medium by electronic means and whether or not transiently or incidentally to some other use of this presentation), modified or in any manner communicated to any third party except with the written approval of IBEF. This presentation is for information purposes only. While due care has been taken during the compilation of this presentation to ensure that the information is accurate to the best of Sutherland Global Services’ Private Limited and IBEF’s knowledge and belief, the content is not to be construed in any manner whatsoever as a substitute for professional advice. Sutherland Global Services Private Limited and IBEF neither recommend nor endorse any specific products or services that may have been mentioned in this presentation and nor do they assume any liability, damages or responsibility for the outcome of decisions taken as a result of any reliance placed on this presentation. Neither Sutherland Global Services Private Limited nor IBEF shall be liable for any special, direct, indirect or consequential damages that may arise due to any act or omission on the part of the user due to any reliance placed or guidance taken from any portion of this presentation. 53
You can also read