STATE AIR TRENDS & SUCCESSES - THE STATS REPORT 2021 EDITION
←
→
Page content transcription
If your browser does not render page correctly, please read the page content below

State Air Trends
& Successes

            The StATS Report
            2 0 2 1   E D I T I O N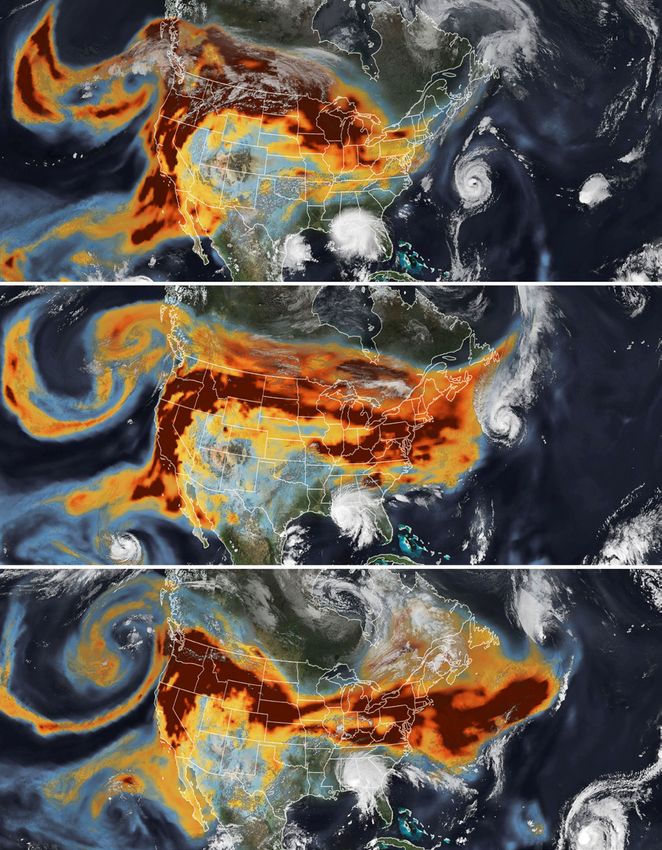
The Association of Air Pollution Control Agencies, or AAPCA, is a national, non-profit, consensus-driven organization focused on assisting
state and local air quality agencies and personnel with implementation and technical issues associated with the federal Clean Air Act. Cre-
ated in 2012, AAPCA represents 48 state and local air pollution control agencies, and senior officials from 22 state environmental agencies
currently sit on the AAPCA Board of Directors. AAPCA is housed in Lexington, Kentucky as an affiliate of The Council of State Governments.
More information about AAPCA can be found on the Association’s website: www.cleanairact.org.

   State Environmental Agencies Currently Represented on the AAPCA Board of Directors

                                                                                                    Alabama          Missouri
                                                                                                    Arizona          North Carolina
                                                                                                    Arkansas         North Dakota
                                                                                                    Florida          Ohio
                                                                                                    Georgia          Oklahoma
                                                                                                    Hawaii           South Carolina
                                                                                                    Indiana          Tennessee
                                                                                                    Kentucky         Texas
                                                                                                    Louisiana        Utah
                                                                                                    Maine            West Virginia
                                                                                                    Mississippi      Wyoming

Footprint of AAPCA Member States
State members of the AAPCA Board of Directors have primary responsibility for protecting air quality for a
significant portion of the country, reflected in the following statistics:

                                                ALMOST           of U.S. Gross
a n e s t i m at e d                                                                                In 2018, 65% of total energy
                                                40%              Domestic Product                   production in the United
151.5 million                                                    in 2019.                           States, as well as:

americans,                                       Nearly 47% of U.S. Total
                                                                                                       74%
                                                                                                                   of crude oil
                                                                                                                   production in Dec. 2020
                                                 Manufacturing Output in 2019,
about 46% of the nation’s                        and 5.6 million manufacturing
total population.                                jobs as of December 2020.                             56%         of total net electricity
                                                                                                                   generation in Dec. 2020

                                                                                                       47%
FROM 2000 TO 2019, AN
                                                 An estimated             About 66%                                of wind generation

                                                 50%
average population growth of 24%,                                                                                  in 2020
                                                                          of the nation’s
COMPARED TO
                                                                          operable
national population growth of 17%                of vehicle miles         petroleum                    76%         of coal production
                                                                                                                   in 2019
FOR THE SAME TIME PERIOD.                        traveled in the          refining capacity
                                                 United States.           in 2019.
                                                                                                       67%         of natural gas
                                                                                                                   production in 2019

                                                                   STATE AIR TRENDS & SUCCESSES: THE StATS REPORT | 2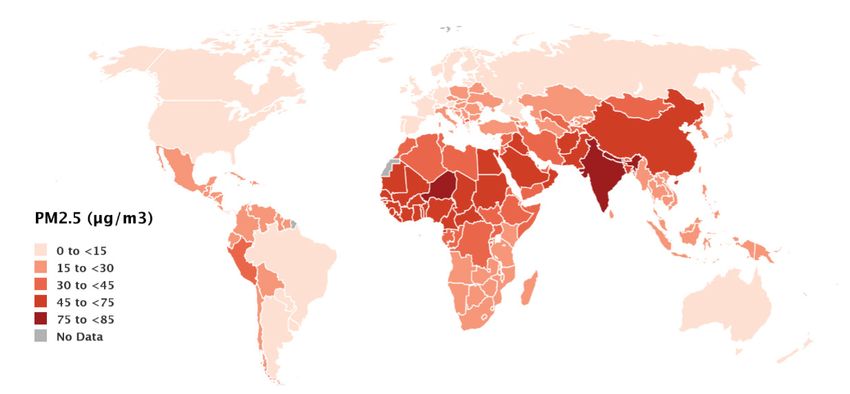
the association of air pollution control agencies

Table of Contents

           Footprint of AAPCA Member States . . . . . . . . . . . . . . . . . . . . . . . . . . . . . . . . . . . . . . . . . . . . . . .                                          2
           Foreword. . . . . . . . . . . . . . . . . . . . . . . . . . . . . . . . . . . . . . . . . . . . . . . . . . . . . . . . . . . . . . . .                                 4
           Introduction . . . . . . . . . . . . . . . . . . . . . . . . . . . . . . . . . . . . . . . . . . . . . . . . . . . . . . . . . . . . .                                  5
           Types of Air Quality Data and Metrics . . . . . . . . . . . . . . . . . . . . . . . . . . . . . . . . . . . . . . . . . . . . . .                                       6
         AAPCA Member State Air Trends and Successes
                                                   . .                            .  .  .  .  .  .  .  .  .  .  .  .  .  .  .  .  .  .  .  .  .  .  .  .  .  .  .  .  .  .  .  .   7
           Economic Growth and Air Quality in AAPCA Member States. . . . . . . . . . . . . . . . . . . . . . . . . . . . . . . . 8
             Air Quality . . . . . . . . . . . . . . . . . . . . . . . . . . . . . . . . . . . . . . . . . . . . . . . . . . . . . . . . . . . . . .                                9
             Fine Particulate Matter . . . . . . . . . . . . . . . . . . . . . . . . . . . . . . . . . . . . . . . . . . . . . . . . . . . . . . . .                                9
             Ozone . . . . . . . . . . . . . . . . . . . . . . . . . . . . . . . . . . . . . . . . . . . . . . . . . . . . . . . . . . . . . . . . 11
           Emissions Reductions in the Electricity Sector . . . . . . . . . . . . . . . . . . . . . . . . . . . . . . . . . . . . . . .  14
           Greenhouse Gases and Energy . . . . . . . . . . . . . . . . . . . . . . . . . . . . . . . . . . . . . . . . . . . . . . . . . 16
           Regional Haze | Visibility Progress in Canyonlands National Park . . . . . . . . . . . . . . . . . . . . . . . . . . . . . 17
           Local Program Case Study | Mecklenburg County, NC . . . . . . . . . . . . . . . . . . . . . . . . . . . . . . . . . . .  19
           State Compliance and Enforcement Activity . . . . . . . . . . . . . . . . . . . . . . . . . . . . . . . . . . . . . . . . 20
           Section Notes | AAPCA Member State Air Trends and Successes . . . . . . . . . . . . . . . . . . . . . . . . . . . . . 21
         American Air Quality in an International Context.  .                        .  .  .  .  .  .  .  .  .  .  .  .  .  .  .  .  .  .  .  .  .  .  .  .  .  .  .  .  .  .      22
           Air Quality and Growth Indicator Trends in the United States                           . . . . . . . . . . . . . . . . . . . . . . . . . . . . . .                      23
             International Trends . . . . . . . . . . . . . . . . . . . . . . . . . . . . . . . . . . . . . . . . . . . . . . . . . . . . . . . .  24
             Fine Particulate Matter . . . . . . . . . . . . . . . . . . . . . . . . . . . . . . . . . . . . . . . . . . . . . . . . . . . . . . .  24
             Ozone . . . . . . . . . . . . . . . . . . . . . . . . . . . . . . . . . . . . . . . . . . . . . . . . . . . . . . . . . . . . . . . . 24
           World Trends     . . . . . . . . . . . . . . . . . . . . . . . . . . . . . . . . . . . . . . . . . . . . . . . . . . . . . . . . . . . .                                25
             Carbon Dioxide Emissions . . . . . . . . . . . . . . . . . . . . . . . . . . . . . . . . . . . . . . . . . . . . . . . . . . . . .  25
           Global Energy-Related CO2 Emissions in 2020 . . . . . . . . . . . . . . . . . . . . . . . . . . . . . . . . . . . . . . .  25
           Section Notes | American Air Quality in an International Context . . . . . . . . . . . . . . . . . . . . . . . . . . . . . 26
         Air Quality Trends in the United States .              .  .  .  .  .  .  .  .  .  .  .  .  .  .  .  .  .  .  .  .  .  .  .  .  .  .  .  .  .  .  .  .  .  .  .  .  .      27
           Criteria Air Pollutants . . . . . . . . . . . . . . . . . . . . . . . . . . . . . . . . . . . . . . . . . . . . . . . . . . . . . . .                                   28
             Concentration Trends . . . . . . . . . . . . . . . . . . . . . . . . . . . . . . . . . . . . . . . . . . . . . . . . . . . . . . . . 28
             Emissions Trends . . . . . . . . . . . . . . . . . . . . . . . . . . . . . . . . . . . . . . . . . . . . . . . . . . . . . . . . . . 28
             Emissions Sources . . . . . . . . . . . . . . . . . . . . . . . . . . . . . . . . . . . . . . . . . . . . . . . . . . . . . . . . .  29
             Criteria Air Pollutant Trends . . . . . . . . . . . . . . . . . . . . . . . . . . . . . . . . . . . . . . . . . . . . . . . . . . . .  30
             Fine Particulate Matter . . . . . . . . . . . . . . . . . . . . . . . . . . . . . . . . . . . . . . . . . . . . . . . . . . . . . . .  30
             Coarse Particulate Matter . . . . . . . . . . . . . . . . . . . . . . . . . . . . . . . . . . . . . . . . . . . . . . . . . . . . .  31
             Nitrogen Dioxide . . . . . . . . . . . . . . . . . . . . . . . . . . . . . . . . . . . . . . . . . . . . . . . . . . . . . . . . . .  32
             Ozone . . . . . . . . . . . . . . . . . . . . . . . . . . . . . . . . . . . . . . . . . . . . . . . . . . . . . . . . . . . . . . . . 32
             Ozone Precursor Emissions . . . . . . . . . . . . . . . . . . . . . . . . . . . . . . . . . . . . . . . . . . . . . . . . . . . .  33
             Sulfur Dioxide . . . . . . . . . . . . . . . . . . . . . . . . . . . . . . . . . . . . . . . . . . . . . . . . . . . . . . . . . . . . 34
             Carbon Monoxide . . . . . . . . . . . . . . . . . . . . . . . . . . . . . . . . . . . . . . . . . . . . . . . . . . . . . . . . . . 35
             Lead . . . . . . . . . . . . . . . . . . . . . . . . . . . . . . . . . . . . . . . . . . . . . . . . . . . . . . . . . . . . . . . . . 36
           Hazardous Air Pollutants . . . . . . . . . . . . . . . . . . . . . . . . . . . . . . . . . . . . . . . . . . . . . . . . . . . . . 36
           Visibility Improvements . . . . . . . . . . . . . . . . . . . . . . . . . . . . . . . . . . . . . . . . . . . . . . . . . . . . .  37
           Exceptional Events in 2020 | Wildfires, Hurricanes, and Saharan Dust . . . . . . . . . . . . . . . . . . . . . . . . .  38
           Greenhouse Gas Trends . . . . . . . . . . . . . . . . . . . . . . . . . . . . . . . . . . . . . . . . . . . . . . . . . . . . . . 39
             Energy-Related Carbon Dioxide Emissions . . . . . . . . . . . . . . . . . . . . . . . . . . . . . . . . . . . . . . . . . . . .  41
           Section Notes | Air Quality Trends in the United States . . . . . . . . . . . . . . . . . . . . . . . . . . . . . . . . . . .  42
           Other Air Quality Resources . . . . . . . . . . . . . . . . . . . . . . . . . . . . . . . . . . . . . . . . . . . . . . . . . . . 43

                                                                   STATE AIR TRENDS & SUCCESSES: THE StATS REPORT | 3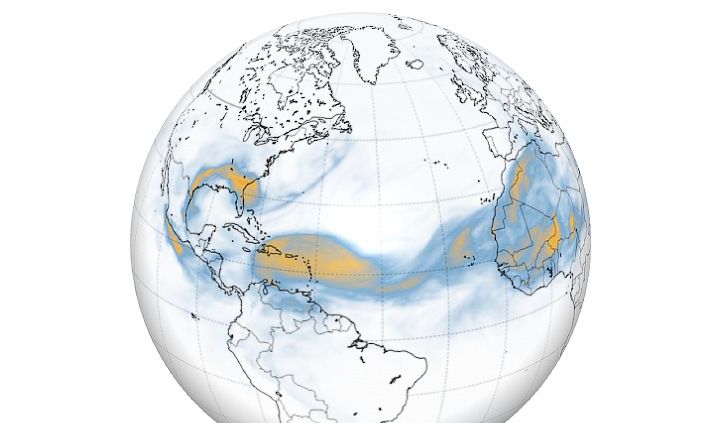
the association of air pollution control agencies

Foreword

Dear Readers,
The past year has been a challenge and transition for the entire country, including air quality agencies. Without a reference manual, all of
our organizations needed to learn to operate during a pandemic. Not only did we have the challenge of quickly converting most of our
office staff to a remote working environment, we needed to develop protocols for our monitoring personnel to continue mission critical
work while minimizing risk to staff. The pandemic has modified the manner in which we operate, but we continue our function of protect-
ing air quality.

We continue to make progress in the nation’s air quality, where state and local agencies, including the membership of Association of Air Pol-
lution Control Agencies (AAPCA), have dedicated significant time and resources to their missions. AAPCA is a consensus-driven organization
of 48 state and local air agencies focused on assisting members with implementation of technical issues associated with the federal Clean
Air Act. Comprised of senior officials from 22 state environmental agencies, AAPCA’s Board of Directors is geographically diverse, providing
a unique forum of perspectives to engage as we work to improve air quality for the more than 150 million Americans we represent. AAPCA’s
Member States also guide the Association on a consensus-basis, seeking to engage our federal co-regulator partners on common principals
as we implement the federal Clean Air Act.

Importantly, state and local air agencies are responsible for developing strategies for air pollution control while accommodating local eco-
nomic and social factors. I am excited to unveil the 2021 edition of AAPCA’s State Air Trends & Successes: The StATS Report, which highlights
the significant progress that has been achieved in air quality in the United States. A few statistics from this year’s report:

• From 1970 through 2019, the United States reduced by 77 percent the combined emissions of the six criteria air pollutants.
• R
   eported toxic air releases declined 325 million pounds (35 percent) from 2009 to 2019, with AAPCA Member States overseeing nearly 60
  percent of the overall reductions.
• I n the electricity sector from 1990 to 2019, emissions of sulfur dioxide were down 14.7 million tons (94 percent) and nitrogen oxide emis-
   sions were down 5.5 million tons (86 percent). AAPCA Member States were responsible for almost 70 percent of sulfur dioxide emissions
   reductions and 64 percent of nitrogen oxide emissions reductions.
• N
   ationally, energy-related carbon dioxide emissions were reduced nearly 10 percent from 1998 through 2018, a period in which total ener-
  gy production grew 34 percent.
• In the two-decade period from 1999 to 2019, AAPCA Member States reduced the aggregate emissions of the six criteria air pollutants by 50
  percent, while experiencing a 49 percent increase in Gross Domestic Product, a 28 percent increase in population, and a 48 percent increase
  in energy production (through 2018).
As Air Directors, we are proud of the progress that has been made and is highlighted in The StATS Report. We also look forward to continuing
our important work as we engage federal partners and other stakeholders to improve air quality across the nation.

Thank you for reading.

                                                                                 ROBERT HODANBOSI
                                                                                 Chief, Division of Air Pollution Control
                                                                                 Ohio Environmental Protection Agency
                                                                                 President, AAPCA

                                                                     STATE AIR TRENDS & SUCCESSES: THE StATS REPORT | 4
the association of air pollution control agencies

Introduction

State Air Trends & Successes: The StATS Report is an annual report            Environmental Data and Communicating
by the Association of Air Pollution Control Agencies (AAPCA) that             with the Public
catalogues important air quality metrics and trends. In the fifth year        Transparency is critical when communicating with the public about
of publication, The StATS Report continues to center on two core com-         the environment. Often, the public only reads or a hears a story
ponents: first, that the nation’s air pollution control efforts are largely   about the environment when the news is concerning, such as when a
a story of success that has seen air quality improve in virtually every       community is being alerted to an issue that may affect the local pop-
measure over the past half-century; and, second, that this progress           ulace. These reports likely have an impact on public perceptions of
has been achieved due to the Clean Air Act’s reliance on collaboration        the environment, which may be reflective in recent polling data. For
between federal, state, local, and tribal agencies. Taken together,           example, Gallup’s most recent poll on the environment, conduct-
these components provide both historical context and an informa-              ed in March 2021, shows that a majority (75 percent) of Americans
tional foundation for continued progress.                                     personally worry a ‘Great deal’ (46 percent) or a ‘Fair amount’ (29
                                                                              percent) about the quality of the environment, and 52 percent think
The 2021 edition of State Air Trends & Successes: The StATS Report
                                                                              the quality of the environment in the country as a whole is ‘Getting
looks at U.S. air quality in three primary sections. The first, “AAPCA
                                                                              worse’ (running somewhat counter to at least a portion of the March
Member State Air Trends and Successes,” details trends in AAPCA’s
                                                                              2020 respondents, with 82 percent stating that a ‘Great deal’ or ‘Only
22 Member States, which are responsible for protecting air quality for
                                                                              some’ progress has been made in dealing with environmental prob-
more than 150 million Americans. These states have seen above-av-
                                                                              lems over the past 50 years).
erage growth and economic activity while continuing to improve air
quality, often outperforming national metrics. The second section,            In terms of air pollution, 41 percent of respondents indicated they
“American Air Quality in an International Context,” provides insight          worry a ‘Great deal’, 32 percent a ‘Fair amount’, 20 percent ‘Only a lit-
into the remarkable air quality progress that the United States has           tle’, and 8 percent ‘Not at all’. Coupled with the aforementioned poll-
made in comparison to its global peers. The final section, “Air Quality       ing data implying the public think the quality of the environment is
Trends in the United States,” catalogues some of the key air quality          getting worse, these public concerns run counter to readily available
trends – all of which show marked and sustained progress resulting in         data and reports. This gap makes evident an opportunity for better
cleaner, clearer air.                                                         communication about air quality – and environmental – trends.
State and Local Air Agencies                                                  The StATS Report relies on publicly accessible data from agencies like
As noted, state and local air agencies are central to the United States’      the U.S. EPA to provide information on the Clean Air Act’s cornerstone
environmental goals and progress. In its current strategic plan, the          national ambient air quality standards, or NAAQS, program as well as
U.S. Environmental Protection Agency (EPA) states that, “The idea             toxic air releases, visibility information for national parks and wilder-
that environmental protection is a shared responsibility between              ness areas, compliance and enforcement activities, and greenhouse
the states, tribes, and the federal government is embedded in our             gases (see page 6 of this report, “Types of Air Quality Data and Met-
environmental laws,” and that “Local governments also have a unique           rics”). Further, air quality has improved substantially while the United
relationship with EPA as partners and often as innovative problem             States has experienced significant economic and social growth over
solvers. EPA works with local governments to build stronger and               the past several decades. When applicable, this report also provides
more robust partnerships and bring local concerns forward into                several economic and social indicator trends, such as Gross Domestic
Agency decision making.” U.S. EPA’s recognition of these vital part-          Product (GDP), to provide additional context.
nerships acknowledges the role of state and local agencies in helping         The Work Continues
the Agency fulfill its mission.                                               By highlighting the historical work and success of air agencies, The
In addition to Clean Air Act-delegated permitting, planning, en-              StATS Report aims to help bridge the gap between air quality data
forcement, and regulatory efforts, state and local agencies are often         and public perception. Despite evolving budget priorities, state and
the first point of contact with citizens. Regular interaction with their      local agencies continue to meet their mission of protecting air quality
communities provides these agencies with a deep knowledge – and               and public health through proven methods and procedures as well as
early starting point – when communicating about new problems                  collaboration with U.S. EPA, community stakeholders, and regulated
and developing solutions. Understanding and improving strategies              entities. As outlined in this report, state and local air agencies are also
around issues like environmental justice, local air toxics issues, and        innovative, developing creative programming and best practices
wildfires requires the exact type of community engagement and                 that improve processes and air quality outcomes and meet demands
public information campaigns that state and local agencies are adept          on limited resources. While work continues to reduce emissions and
at undertaking.                                                               improve air quality, state and local air quality agencies have an estab-
                                                                              lished history as leaders that are adept at strategizing for emergent
Air agencies are also well positioned to understand the complex,
                                                                              issues and meeting the needs of their communities.
often multi-layered impacts of decision-making, and able to bring
to bear informed technical and process expertise that helps improve
citizen input.

                                                                          STATE AIR TRENDS & SUCCESSES: THE StATS REPORT | 5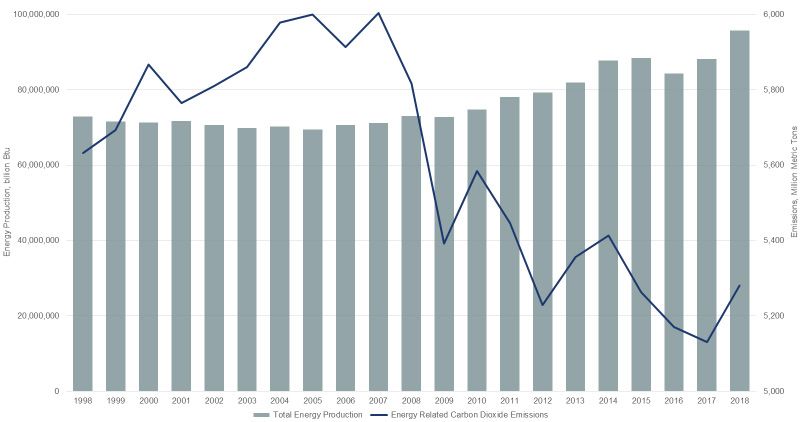
the association of air pollution control agencies

Types of Air Quality Data and Metrics

This report primarily relies on data from the U.S. Environmental Protec-                                  U.S. EPA reports on long-term air quality trends by preparing data anal-
tion Agency (EPA) and other federal agencies, such as the U.S. Energy                                     yses that show the overall trend lines for pollutant concentrations and
Information Administration (EIA), to evaluate air quality trends. These                                   emissions. Primary sources that inform this report include:
trends include metrics for criteria air pollutants, air toxics and hazard-                                • Criteria air pollutant concentration data that are pulled from EPA’s
ous air pollutants, visibility progress in National Parks and wilderness                                    analysis of the AQS that looks at long-term trends in air quality.6
areas, and greenhouse gases, with sources provided below each chart
or graph and in the notes for each section. Also included in this report                                  • Data showing emissions trends of the criteria pollutants are pulled
are case studies and short excerpts from other relevant analyses, which                                     from U.S. EPA’s Air Pollutant Emissions Trends Data,7 which relies on
include links to their source and data.                                                                     the National Emissions Inventory (NEI). The NEI is “a comprehensive
                                                                                                            and detailed estimate of air emissions of criteria pollutants, criteria
Criteria Air Pollutant Data                                                                                 precursors, and hazardous air pollutants from air emissions sources
Trends and indicators of air quality can be measured in a variety of                                        … released every three years based primarily upon data provided
ways, but an important group of data to analyze is that of the air pollut-                                  [to the Emissions Inventory System (EIS)] by State, Local, and Tribal
ants that are regulated under the federal Clean Air Act. Section 109 of                                     air agencies for sources in their jurisdictions and supplemented by
the Clean Air Act requires EPA to establish both primary and secondary                                      data developed by the US EPA.”8
national ambient air quality standards, or NAAQS. Primary NAAQS are
“standards the attainment and maintenance of which in the judgment                                        • Design values, which are computed and published annually by U.S.
of the Administrator, based on such criteria and allowing an adequate                                       EPA and defined as “a statistic that describes the air quality status
margin of safety, are requisite to protect the public health,” while                                        of a given location relative to the level of the NAAQS … typically
secondary NAAQS “specify a level of air quality the attainment and                                          used to designate and classify nonattainment areas, as well as to
maintenance of which … is requisite to protect the public welfare from                                      assess progress towards meeting the NAAQS.”9
any known or anticipated adverse effects associated with the presence                                     Other Air Quality Data
of such air pollutant in the ambient air.”1                                                               In addition to tracking criteria air pollutants, U.S. EPA also maintains
NAAQS have been set for six “criteria” pollutants: carbon monoxide                                        data and develops analyses on multiple other federal air quality pro-
(CO), sulfur dioxide (SO₂), ground-level ozone (O₃), particulate matter                                   grams, including:
(PM), lead (Pb), and nitrogen dioxide (NO₂). Individual NAAQS may                                         • The Toxic Release Inventory (TRI), which provides a consistent set
differ in form (for example, annual fourth-highest daily maximum                                            of data over time for hazardous air pollutants (or air toxics).10
8-hour concentration average over three years, for ozone), level2 (often
measured in parts per billion or micrograms per cubic meter), and                                         • Visibility progress is tracked as part of the Regional Haze Program,
averaging time (from one hour up to one year).3 U.S. EPA and the Clean                                      with long-term trends available in U.S. EPA’s annual air quality
Air Scientific Advisory Committee, or CASAC, review the adequacy of                                         trends report.11
                                      4
the NAAQS according to the statute.                                                                       • In an annual progress report, the U.S. EPA publishes power sector
Nationally, ambient air pollution data from thousands of monitors                                           emissions data for SO₂, nitrogen oxides (NOX), and hazardous air
across the United States is collected by U.S. EPA and state, local, and                                     pollutants, as well as carbon dioxide (CO₂).12
tribal air pollution control agencies and provided to the Air Quality                                     Additionally, greenhouse gas data are pulled primarily from U.S. EPA’s
System, or AQS. These data are used to “assess air quality, assist in                                     annual Inventory of U.S. Greenhouse Gas Emissions and Sinks13 and U.S.
attainment/non-attainment designations, evaluate State Implementa-                                        EIA reports, such as the Annual Energy Outlook, which includes CO₂
tion Plans [SIPs] for non-attainment areas, perform modeling for permit                                   emissions data from energy sources.14
review analysis, and prepare reports for Congress as mandated by the
Clean Air Act.”5

NOTES
1  42 U.S.C. §7409(b).                                                                                    9    U.S. EPA, Air Quality Design Values.
2  U.S. EPA states: “Units of measure for the standards are parts per million (ppm) by volume,           10  U.S. EPA, Toxics Release Inventory (TRI) Program. Annual TRI National Analysis here.
    parts per billion (ppb) by volume, and micrograms per cubic meter of air (µg/m3).”                         EPA notes that the TRI “is a resource for learning about toxic chemical releases and pollution preven-
3 A chart of the primary and secondary NAAQS by pollutant, which includes averaging time, level,              tion activities reported by industrial and federal facilities. TRI data support informed decision-mak-
     and form, can be found here.                                                                              ing by communities, government agencies, companies, and others. Section 313 of the Emergency
4 42 U.S.C. §7409(d).                                                                                        Planning and Community Right-to-Know Act (EPCRA) created the TRI Program.”
5 U.S. EPA, Air Quality System. U.S. EPA notes that the AQS “also contains meteorological data,          11 U.S. EPA, National Air Quality: Status and Trends of Key Air Pollutants. See also: U.S. EPA,

    descriptive information about each monitoring station (including its geographic location and its          Our Nation’s Air: EPA Celebrates 50 Years!, June 2020 (Section: “Visibility Improves in Scenic
    operator), and data quality assurance/quality control information.”                                       Areas”).
6 Links to data summary files for national criteria pollutant trends can be found here.                   12 U.S. EPA, Power Sector Programs—Progress Report.

7 Data can be found here. U.S. EPA notes: “The latest version of the 1970 – 2020 data show the           13 U.S. EPA’s annual Inventory of U.S. Greenhouse Gas Emissions and Sinks is released April each

     trends for Tier 1 categories which distinguish pollutant emission contributions among major source       year. See also: U.S. EPA’s Greenhouse Gas Inventory Data Explorer.
    types … As inventory methods are improved over time, for some emission sources and improved           14 U.S. EIA, Annual Energy Outlook 2021, February 3, 2021.

    estimation method may be applied ‘backwards’ to previous year trend estimates.”
8 More information on the NEI can be found here. U.S. EPA states that “The NEI is built using the

    Emissions Inventory System (EIS) first to collect the data from State, Local, and Tribal air
    agencies and then to blend that data with other data sources.”

                                                                                                    STATE AIR TRENDS & SUCCESSES: THE StATS REPORT | 6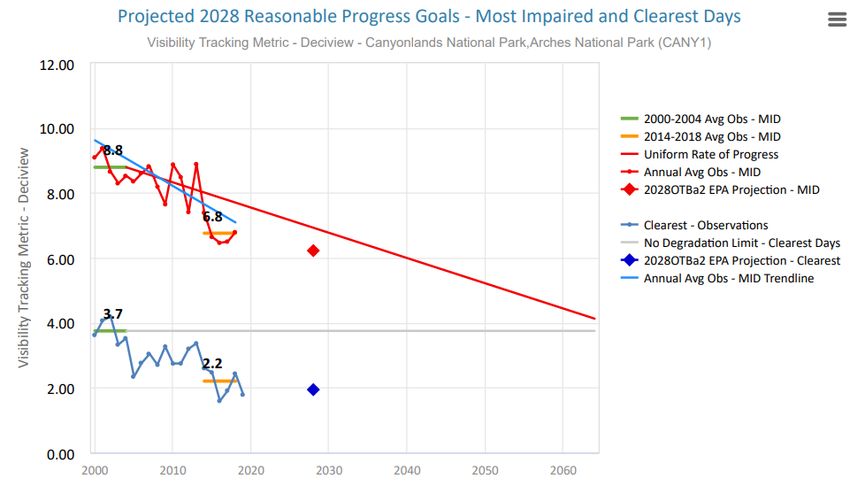
AAPCA Member State
Air Trends and Successes
the association of air pollution control agencies

Economic Growth and Air Quality in AAPCA Member States

Over the past two decades, AAPCA Member States have overseen a 50 percent reduction in the combined emissions of the pollutants (or
pollutant precursors) for which there are national ambient air quality standards, or NAAQS.1 These significant decreases have improved air
quality during the following trends in economic and social growth indicators:

• A 49 percent increase in Gross Domestic Product (GDP) from 1999 through 2019, accounting for nearly 40 percent of total U.S. GDP in 20192;
• A 28 percent increase in vehicle miles traveled in from 1999 to 20183; and,
• A population increase of 28 percent in the 20 years from 1999 to 2019, representing 46 percent of the total U.S. population in 2019.4
Further, states in AAPCA’s membership saw a 48 percent increase in energy production from 1999 through 2018, and produced nearly 65
percent of total U.S. energy in 2018.5 During the same period, AAPCA Member States were also responsible for a 5 percent reduction in
energy-related carbon dioxide (CO2) emissions.6

                 AAPCA Member States: Comparison of Growth Indicators and Emissions Trends
                                                      1999–2019
                          AAPCA Member States: Comparison of Growth Indicators and Emissions Trends
                                                                                  1999 – 2019
 60%
                                                                                                                                                             Gross Domestic Product
                                                                                                                                                                     49%

                                                                                                                                                   Energy Production
                                                                                                                                                         48%

 40%
                                                                                                                                                                 Vehicle Miles Traveled
                                                                                                                                                                          28%

                                                                                                                                                                           Population
                                                                                                                                                                             28%
 20%

  0%
         1999    2000    2001    2002     2003    2004    2005    2006    2007     2008    2009    2010    2011    2012     2013    2014    2015      2016      2017     2018      2019

                                                                                                                                                         Energy-related CO2 Emissions
                                                                                                                                                                      -5%

 -20%

                                                                                                                                                        Aggregate Emissions of Criteria
                                                                                                                                                                  Pollutants
 -40%                                                                                                                                                               -50%

 -60%

Sources: U.S. Bureau of Economic Analysis, data available here; U.S. Energy Information Administration, State Energy Data System (SEDS): 1960–2018; U.S. Office of Highway
Policy Information, data available here; U.S. Census Bureau, data available here; U.S. EIA, Energy-Related CO2 Emission Data Tables. Table 2. State energy-related carbon dioxide
emissions by year, adjusted (1990–2018); U.S. EPA, Air Pollutant Emissions Trends Data (data file: “State Tier 1 CAPS Trends”).

“It makes sense for state and local air pollution agencies to take the lead in carrying out the Clean Air Act.
They are able to develop solutions for pollution problems that require special understanding of local indus-
tries, geography, housing, and travel patterns, as well as other factors … State, local, and tribal governments
also monitor air quality, inspect facilities under their jurisdictions and enforce Clean Air Act regulations.”
                                                                                                                  U.S. EPA, The Plain English Guide to the Clean Air Act, April 2007.

                                                                                     STATE AIR TRENDS & SUCCESSES: THE StATS REPORT | 8
the association of air pollution control agencies
Air Quality | Fine Particulate Matter
U.S. EPA’s online Green Book “provides detailed information about area [NAAQS] designations, classifications and nonattainment status.”7
According to the online database, a total of 39 areas were designated non-attainment or maintenance for the 1997 fine particulate matter
(PM2.5) NAAQS of 15 micrograms per cubic meter (μg/m3), measured by the three-year average annual mean concentration.8
U.S. EPA develops design values9 based on monitoring data from the Agency’s Air Quality System.10 The table below lists the percent change
in design values from 1999 to 2019 for the 24 designated areas that are partially or completely within AAPCA Member States, which over-
saw an average reduction in PM2.5 concentrations of nearly 50 percent.11
Percent Change in PM2.5
Designated Area
Concentrations, 1999 to 2019
Atlanta, GA -53.77%
Birmingham, AL -53.70%
Canton-Massillon, OH -49.18%
Charleston, WV -57.07%
Chattanooga, TN-GA-AL -53.44%
Chicago-Gary-Lake County, IL-IN -48.57%
Cincinnati-Hamilton, OH-KY-IN -38.86%
Cleveland-Akron-Lorain, OH -45.81%
Columbus, OH -48.89%
Dayton-Springfield, OH -42.14%
Evansville, IN -47.34%
Greensboro-Winston Salem-High Point, NC -48.84%
Hickory-Morganton-Lenoir, NC -50.89%
Huntington-Ashland, WV-KY-OH -65.91%
Indianapolis, IN -38.59%
Knoxville, TN -57.50%
Louisville, KY-IN -43.35%
Macon, GA -48.30%
Martinsburg-Hagerstown, WV-MD -46.88%
Parkersburg-Marietta, WV-OH -55.11%
Rome, GA* -45.90%
St. Louis, MO-IL -40.80%
Steubenville-Weirton, OH-WV -49.45%
Wheeling, WV-OH -44.24%
*Data through 2014–2016.
Source: U.S. EPA, Air Quality Design Values (Data file: “PM2.5 Design Values, 2019”).
STATE AIR TRENDS & SUCCESSES: THE StATS REPORT | 9the association of air pollution control agencies
Air Quality | Fine Particulate Matter
AAPCA Member States: Design Value History for Areas Previously
AAPCA Member States:
Designated Design Value
Nonattainment orHistory for Areas for
Maintenance Previously Designated
the 1997 PM2.5 NAAQS
Nonattainment or Maintenance for the 1997 PM2.5 NAAQS
1999–2019
1999 – 2019
22
20
AAPCA Member State Average
18
16 1997 & 2006
PM2.5 NAAQS
Concentration (µg/m 3)
14
2012 PM2.5 NAAQS
12
10
8
6
Source: U.S. EPA, Air Quality Design Values (Data file: “PM2.5 Design Values, 2019”). For further details, please see AAPCA’s 2020 StATS Report Interactive Webpage.
STATE AIR TRENDS & SUCCESSES: THE STATS REPORT | 10the association of air pollution control agencies
Air Quality | Ozone
According to U.S. EPA’s Green Book, 47 areas in the United States were designated nonattainment or maintenance for the 2008 ozone NAAQS
of 0.075 parts per million (ppm), determined using the annual fourth-highest daily maximum 8-hour concentration, averaged over three
years.12
Of the designated areas, 14 are located partially or fully in AAPCA Member States, with the chart below detailing the percent change in
design values from 1998 to 2019, a period in which AAPCA Member States averaged a 27 percent reduction in ambient concentrations of
ozone.13
Percent Change in
Designated Area Ozone Concentrations,
1998 to 2019
Atlanta, GA -39.67%
Baton Rouge, LA -26.04%
Charlotte-Rock Hill, NC-SC -32.69%
Chicago-Naperville, IL-IN-WI -19.35%
Cincinnati, OH-KY-IN -25.25%
Cleveland-Akron-Lorain, OH -23.16%
Columbus, OH -28.42%
Dallas-Fort Worth, TX -24.51%
Houston-Galveston-Brazoria, TX -27.68%
Knoxville, TN -37.50%
Memphis, TN-MS-AR -28.87%
Phoenix-Mesa, AZ -12.50%
St. Louis-St. Charles-Farmington, MO-IL* -24.47%
Upper Green River Basin, WY 0.00%**
*For design value years 1998–2000, 1999–2001, and 2000–2002, this area was listed as St. Louis, MO-IL. Following 2001–2003, it was listed as St. Louis-St.
Charles-Farmington, MO-IL.
** Upper Green River Basin, WY is calculated from the first year that data was available, design value year 2005–2007. This area is excluded from average
calculations.
Source: U.S. EPA, Air Quality Design Values. Data file: “Ozone design values, 2019.”
STATE AIR TRENDS & SUCCESSES: THE StATS REPORT | 11the association of air pollution control agencies
Air Quality | Ozone
AAPCA Member States: Design Value History for Areas Previously Designated
Nonattainment or Maintenance for the 2008 Ozone NAAQS
0.12 1998–2019
0.11
AAPCA Member State Average
0.10
Concentration (ppm)
0.09
0.08
2008 Ozone NAAQS
0.07
0.06
0.05
Source: U.S. EPA, Air Quality Design Values. Data file: “Ozone design values, 2019.” For further details, please see AAPCA’s 2020 StATS Report Interactive Webpage.
STATE AIR TRENDS & SUCCESSES: THE STATS REPORT | 12the association of air pollution control agencies
AAPCA Best Practices
in Air Pollution Control
Each year, AAPCA awards Best Practices that identify ground-breaking technology, innovative approaches, and exemplary operations in
the field of air pollution control, with particular focus on activities that are directly transferable to the operation of an air pollution control
agency. Below are recipients of AAPCA Best Practices since 2015:
2020 2017
Georgia PSD Emissions Inventory National Ambient Air Quality Standards
Georgia Environmental Protection Division (NAAQS) Exceedance Reports
Georgia Environmental Protection Division,
Air Protection Branch
2019 Pollutants of Concern Table
Implementation
Data Verif ication Procedures Kentucky Division for Air Quality
Georgia Environmental Protection Division
Standardization of an Engineer ’s Notebook
Ozone Design Value Predictor Tool for Title V Permitting
North Carolina Division of Air Quality Wyoming Department of Environmental Quality,
Air Quality Division
Louisville Community Workshop Series
(Local Government Best Practice)
Louisville Metro Air Pollution Control District 2016
Air Protection Branch 101 Training
Georgia Environmental Protection Division,
2018 Air Protection Branch
Georgia State Implementation Plan
Processing Procedures
2015
Georgia Environmental Protection Division, AirCom: Florida Division of Air Resource
Air Protection Branch Management’s New Compliance and
Toxicity Factors Database Enforcement Database and Field
Texas Commission on Environmental Quality Inspection Tool
Florida Department of Environmental Protection
Inventory, Monitoring, Permitting, FAIR: Florida Air Inspector Reference
and Compliance Tracking (IMPACT) Florida Department of Environmental Protection
Web-based Data System
Wyoming Department of Environmental Quality, Promoting Energy Eff iciency at
Air Quality Division Commercial and Industrial Facilities in
North Carolina
North Carolina Division of Air Quality
S T A T E A I R T R E N D S &State
SUC AirCTrends
ESSES & :Successes:
T H E S T The
A T SStATS
R E PReport
ORT | 13the association of air pollution control agencies
Emissions Reductions in the Electricity Sector
In 2018, AAPCA Member States produced nearly 57,700,000 billion British thermal units (Btus) of energy, a more than 43 percent increase
from 1998.14 During the same 20-year period, AAPCA Member States oversaw significant reductions in the emissions of sulfur dioxide (SO2)
and oxides of nitrogen (NOX) from the electricity sector, specifically:
• SO2 emissions decreased 92 percent, from 8,789,000 tons in 1998 to 684,000 tons in 2018; and,
• NOX emissions went from 4,147,000 tons in 1998 to 627,00 tons in 2018, a decline of 85 percent.15
AAPCA Member States: Energy Production
AAPCA Member Compared
States: Energy Production to Electricity
Compared Sector
to SO2 and NOx SO₂ and NOx Emissions
1998–2018
Emissions from the Electricity Sector
1998 – 2018
9,000 60,000,000
SO2
7,500 50,000,000
6,000 40,000,000
Energy Production (billion Btu)
Emissions (thousand tons)
4,500 30,000,000
NOx
3,000 20,000,000
1,500 10,000,000
0 0
1998 1999 2000 2001 2002 2003 2004 2005 2006 2007 2008 2009 2010 2011 2012 2013 2014 2015 2016 2017 2018
Total Energy Production
Sources: U.S. Energy Information Administration, State Energy Data System (SEDS): 1960–2018; U.S. EPA, Air Pollutant Emissions Trends Data (Data file: “State Average Annual Emissions Trend”).
Power Plant Emissions Trends Annual Percent Change of Emissions from Power Plants
In February 2021, U.S. EPA released the 2020 annual data 1995–2020
for power plants, highlighting the following emissions 20%
trends compared to 2019:
0%
• A 19 percent decline in SO2 emissions, a 93 percent
PE RC E NT CH AN G E
reduction from 1995 levels; -20%
• A 16 percent decline in NOX emissions, down 87 per- CO₂ -27%
cent from 1995 levels; and, -40%
• An 11 percent decline in carbon dioxide (CO₂) -60%
emissions, 27 percent below 1995 levels. NOx -87%
Source: U.S. EPA, “EPA: 2020 Power Plant Emissions Continue to -80%
Demonstrate Significant Reductions,” February 16, 2021. Data SO2 -93%
available here. -100%
5 6 7 8 9 0 1 2 3 4 5 6 7 8 9 0 1 2 3 4 5 6 7 8 9 0
199 199 199 199 199 200 200 200 200 200 200 200 200 200 199 201 201 201 201 201 201 201 201 201 201 202
S T A T E A I R T R E N D S &State
SUC AirCTrends
ESSES & :Successes:
T H E S T The
A T SStATS
R E PReport
ORT | 14the association of air pollution control agencies
Emissions Reductions in the Electricity Sector
Alabama (522,207)
AAPCA Member States: Share of Arkansas (29,815)
SO₂ Emissions Reductions in the Arizona (107,804)
Florida (628,056)
Electricity Sector, 1990 – 2019 (tons
of SO₂ reduced) Georgia (862,224)
Other States
Data from U.S. EPA’s Clean Air Markets Programs16 (4,512,423)
show that the United States reduced electricity Indiana (1,451,396)
sector SO₂ emissions 94 percent from 1990 to 2019,
from 15.7 million tons to 969 thousand tons—a
14.7 million ton decline. AAPCA Member States
accounted for nearly 70 percent of these SO₂ emis- Kentucky (855,135)
sions reductions, lowering SO₂ emissions from 10.9
million tons in 1990 to 676 thousand tons in 2019.17 Louisiana (75,015)
Wyoming Maine (11,280)
(52,044)
Missouri (686,810)
Source: U.S. EPA, "State-by-State SO2 Emissions from CAIR and West Virginia
(929,870) Mississippi (115,926)
ARP Sources, 1990-2019," March 2020.
Utah (22,897) North Carolina (314,473)
Texas (313,210) North Dakota (90,533)
Tennessee (785,304)
Oklahoma Ohio (2,142,701)
South Carolina (161,683)
(93,134)
Alabama (168,318)
AAPCA Member States: Share of Arkansas (22,078)
Arizona (45,959)
NOX Emissions Reductions in the Florida (255,873)
Electricity Sector, 1990–2019 (tons of Georgia (207,519)
NOX reduced)
Other States
(2,015,274) Indiana (374,533)
U.S. EPA’s Clean Air Markets Programs data also
reveal a national reduction in NOx emissions from Kentucky (303,740)
the electricity sector of 86 percent from 1990 to
2019, from 6.4 million tons to 877 thousand tons.
Louisiana (56,916)
Of the 5.5-million-ton decrease, AAPCA Member
Maine (3,563)
States accounted for 3.52 million tons (64 percent), Missouri (149,613)
from 4.13 million tons in 1990 to 614 thousand tons Mississippi (34,781)
in 2019.18 North Carolina (174,152)
North Dakota (70,269)
Source: U.S. EPA, “Annual NOX Emissions from CSAPR and ARP Wyoming
Sources, 1990 –2019,” March 2020. (70,280)
Ohio (493,567)
West Virginia
(298,630)
Oklahoma
Utah (40,657) (73,454)
Texas (359,345)
South Carolina (86,556)
Tennessee (228,219)
STATE AIR TRENDS & SUCCESSES: THE StATS REPORT | 15the association of air pollution control agencies
Greenhouse Gases and Energy
From 1998 to 2018, energy-related CO₂ emissions in AAPCA Member States declined 5 percent, from 3,111 million metric tons in 2000 to
2,961 million metric tons in 2018, while energy production increased 45 percent.19
AAPCA Member States:
AAPCA Member Total
States: Total EnergyEnergy Production
Production Compared
Carbon Dioxide Emissions
Compare to
to Energy-Related
Energy-Related CO₂ 2000Emissions,
– 2018 1998–2018
60,000,000 3,400
3,300
50,000,000
3,200
40,000,000
Emissions, Million Metric Tons
Energy Production (billion Btu)
3,100
30,000,000 3,000
2,900
20,000,000
2,800
10,000,000
2,700
0 2,600
1998 1999 2000 2001 2002 2003 2004 2005 2006 2007 2008 2009 2010 2011 2012 2013 2014 2015 2016 2017 2018
Energy Production Energy-related
Energy RelatedCO
CO2
2
Source: U.S. Energy Information Administration (EIA), State Energy Data System (SEDS): 1960–2019; U.S. EIA, Energy-Related CO2
Emission Data Tables, Table 2. State energy-related carbon dioxide emissions by year, adjusted (1990–2018).
Further, states in AAPCA’s membership saw GDP increase 42 percent from 2000 to 2018 while overseeing an average decline in carbon
intensity of the economy by 33 percent, whereas the national average was a 32 percent reduction.20 On average, AAPCA Member States also
reduced energy intensity by 22 percent.21
AAPCA Member States: Carbon Intensity of the Economy, 2000–2018
0%
AL
AZ
AR
FL
GA
HI
IN
KY
LA
ME
MS
MO
NC
ND
OH
OK
SC
TN
TX
UT
WV
WY
AAPCA MEMBER STATE AVERAGE
U.S. AVERAGE
-5%
-10%
-15%
P E RC E N T C HA N G E
-20%
-25%
-30%
-35%
-40%
-45%
-50%
Source: U.S. Energy Information Administration, Energy-Related CO2 Emission Data Tables. Table 8. Carbon intensity of the economy by state (1990–2018).
STATE AIR TRENDS & SUCCESSES: THE StATS REPORT | 16the association of air pollution control agencies
Regional Haze | Visibility Progress in Canyonlands National Park
In 1951, the superintendent of Arches National Park,
Bates Wilson, ventured into a section of the Colorado
Plateau where the Green and Colorado Rivers had
sculpted an expanse of awe-inspiring canyons, mesas,
cliffs, and spires. That year, Wilson started a campaign
to map this area and turn it into a national park, which
was finally established in 1964. Canyonlands National
Park spans over 300,000 acres and is Utah’s largest
national park. One of five Class I areas in Utah, Canyon-
lands is located near the town of Moab and welcomes
over 700,000 visitors a year. The park is also home to
one of the most photographed landforms in the west,
the Mesa Arch.
Haze is one of the most basic forms of visibility-decreas-
ing air pollution. Utah has been at the forefront of haze
improvement and prevention since 1991 when the
Grand Canyon Visibility Transport Commission (GCVTC)
was formed. The GCVTC recognized haze as a regional
issue prior to the creation of the Regional Haze Rule
(RHR) in 1999 and was the first multi-state collaborative
effort to address visual air quality issues. In recognition
of the GCVTC, Section 309 of the RHR provided an early Figure 1: Mesa Arch, National Park Service.
regional haze planning opportunity for states within
the Colorado Plateau region. Utah is one of the five
states to submit a complete §309 regional haze plan
in 2003 and continues to be part of multiple interstate
regional haze planning organizations.
Through the collaborative efforts of state, local, and
federal entities, Canyonlands National Park’s visibility
has improved under the RHR. The rule requires that
each Class I area achieve natural conditions for visibility
by the year 2064 by steadily improving the number of
most impaired days and keeping the number of clear-
est days from decreasing. Since 2005, sources in the re-
gion around Canyonlands National Park have reduced
their SO₂ emissions by over 150,000 tons per year. The
Utah Department of Environmental Quality and Federal
Land Managers have cooperated on a prescribed fire
plan that allows the needed forest rehabilitation to
happen when the fires will have little to no impact on
visibility. The Regional Haze program has been success-
ful as visitors of the park can now enjoy unimpaired
vistas that extend over 120 miles on the most impaired Figure 2: Projected Canyonlands Reasonable Progress Goals Glidepath.
days and nearly 200 miles on the clearest days. That is
an improvement of 22 miles and 27 miles respectively
from 2005 to 2018. As of 2018, Canyonlands is over 10
years ahead of the Uniform Rate of Progress schedule
for most impaired days as defined by EPA guidance.
Source: Utah Division of Air Quality.
STATE AIR TRENDS & SUCCESSES: THE StATS REPORT | 17the association of air pollution control agencies
Toxic Air Releases
AAPCA Member States: Share Total U.S. Reduction:
of Total Reduction of Toxic Air 325.7 Million Pounds
Releases Reported to the Toxic
Release Inventory, 2009–2019 AAPCA Member
Reduction:
U.S. EPA’s 2019 Toxic Release Inventory (TRI) National 194.6 Million Pounds
Analysis revealed a 35 percent reduction in report-
ed toxic air releases compared to 2009, from 925.9
million pounds in 2009 to 600.2 million pounds in
2019.22 Of the more than 325 million pound de-
crease in reported releases over the past 10 years,
AAPCA Member States were responsible for 195
million pounds, nearly 60 percent.23
Source: U.S. EPA Toxic Release Inventory Explorer, 2019 TRI Factsheets.
AAPCA Member States: Annual Share of National Reduction in Reported Toxic Air Releases
2009–2019
2009 2010 2011 2012 2013 2014 2015 2016 2017 2018 2019
0
-50,000,000
Other State Reductions
-100,000,000
-150,000,000
-200,000,000
AAPCA Member State Reductions
-250,000,000
-300,000,000
-350,000,000
Source: U.S. EPA Toxic Release Inventory Explorer, 2019 TRI Factsheets.
STATE AIR TRENDS & SUCCESSES: THE StATS REPORT | 18the association of air pollution control agencies
Local Program Case Study: Mecklenburg County, NC
Analysis of Air Pollution During Stay-at-Home Phase
Air Monitoring staff from Mecklenburg County Air Quality, a local program in Charlotte, North Carolina, analyzed data collected during
the initial “Stay-at-Home” phase of the pandemic. The purpose was to investigate whether measured concentrations of local air pollution
showed expected decreases during the time of reduced traffic.
Measured from March 26, 2020 to April 29, 2020, traffic on Interstate 77 and on Interstate -277/74 declined by approximately 40% when
compared to the previous 4 years. Likewise, declines in air pollution were seen. Concentrations of fine particulate matter (PM2.5), Carbon
Monoxide (CO), Nitrogen Dioxide (NO₂) and Ozone (O₃) were all lower than the average concentrations of the previous 4 years. It was also
noted that near-road monitoring site concentrations exhibited greater declines than the area-wide monitoring site for PM2.5, CO, and NO₂.
The full analysis can be found at AirQuality.MeckNC.gov. Mecklenburg County Air Quality intends to use this analysis in its outreach to the
community to illustrate the significance of reducing single-occupancy vehicle trips as a strategy for improving air quality in the metropoli-
tan area.
Source: Mecklenburg County Air Quality.
STATE AIR TRENDS & SUCCESSES: THE StATS REPORT | 19the association of air pollution control agencies
State Compliance and Enforcement Activity
U.S. EPA’s Enforcement and Compliance History Online (ECHO) documents compliance monitoring activities undertaken by state and local
air quality agencies and U.S. EPA since 2012. U.S. EPA’s ECHO Dashboard shows the following distribution of compliance monitoring activi-
ties related to the Clean Air Act by lead agency24:
• In 2020, states were the lead agency on 69,395 activities, and averaged above 80,000 per year from 2012 through 2020;
• In 2020, local programs were the lead agency for 5,432 activities, with an average of more than 8,000 per year from 2012 through 2020; and,
• U.S. EPA was the lead agency for 1,480 activities, averaging about 2,000 per year since 2012.
Additionally in 2020, AAPCA Member States were the lead agency for a total of 37,088 compliance monitoring activities, or more than 53
percent of the state lead agency total.
Compliance Monitoring Activities by Lead Agency
2012–2020
Compliance Monitoring Activities by Lead Agency
2012 – 2020
120,000
100,000
80,000
Number of Activities
60,000
40,000
20,000
0
2012 2013 2014 2015 2016 2017 2018 2019 2020
EPA Local State
Source: U.S. EPA, Analyze Trends: State Air Dashboard.
“States currently perform the vast majority of environmental protection tasks in America,
including more than 90% of the enforcement and compliance actions and collection of
the environmental quality data currently held by the U.S. EPA.”
Environmental Council of States, “Resolution 00-1: On Environmental Federalism,” March 22, 2021.
STATE AIR TRENDS & SUCCESSES: THE StATS REPORT | 20the association of air pollution control agencies
Section Notes | AAPCA Member State Air Trends and Successes
1 13
U.S. EPA, Air Pollutant Emissions Trends Data. Data file: “State U.S. EPA, Air Quality Design Values (Data file: “Ozone Design
Tier 1 CAPS Trends” (Criteria pollutants State Tier 1 for 1990– Values, 2019”). Data for this chart is based on overlapping
2020). three-year averages beginning with 1998–2000 and ending with
2
2017–2019
U.S. Bureau of Economic Analysis, “Gross Domestic Product
14
by State, 4th Quarter 2020 and Annual 2020 (Preliminary),” U.S. Energy Information Administration, State Energy Data
released March 26, 2021. System (SEDS): 1960–2019.
3 15
U.S. Office of Highway Policy Information, data available here. U.S. EPA, Air Pollutant Emissions Trends Data (Data file: “State
4
Annual Emissions Trend”)
U.S. Census Bureau, Population Estimates 1990–2000; 2000–
16
2010; 2010–2019. More information on U.S. EPA Clean Air Markets Programs can
5
be found here, and include the Acid Rain Program (ARP), the
U.S. Energy Information Administration, State Energy Data Cross-State Air Pollution Rule (CSAPR), and the CSAPR Update.
Systems (SEDS): 1960–2018.
17
6
U.S. EPA, “State-by-State SO₂ Emissions from CAIR and ARP
U.S. EIA, Energy-Related CO2 Emission Data Tables. Table 2. Sources, 1990–2019,” December 2019.
State energy-related carbon dioxide emissions by year, adjusted
18
(1990–2018). U.S. EPA, “State-by-State NOX Emissions from CAIR and ARP
7
Sources, 1990–2019,” December 2019.
U.S. EPA’s Green Book can be found here.
19
8
.S. Energy Information Administration (EIA), State Energy Data
U
.S. EPA’s listing of areas designated nonattainment or mainte-
U System (SEDS): 1960–2019; U.S. EIA, Energy-Related CO2 Emis-
nance for the 1997 annual PM2.5 NAAQS can be found here. In sion Data Tables. Table 2. State energy-related carbon dioxide
2012, the NAAQS for PM2.5 was lowered to 12 µg/m3, based on emissions by year, adjusted (1990–2018).
an annual arithmetic mean averaged over three years (the 2006
20
review maintained the 1997 NAAQS). In 2020, U.S. EPA retained U.S. Energy Information Administration, Energy-Related CO2
the 2012 standard of 12 µg/m3. Emission Data Tables. Table 8. Carbon intensity of the economy
9
by state (1990–2018).
U.S. EPA defines a design value as “a statistic that describes the
21
air quality status of a given location relative to the level of the .S. Energy Information Administration, Energy-Related
U
[NAAQS].” More information is available here. CO2 Emission Data Tables. Table 6. Energy intensity by state
10
(1990–2018).
U.S. EPA’s Air Quality System “contains ambient air pollution
22
data collected by EPA, state, local, and tribal air pollution control U.S. EPA, 2019 Toxic Release Inventory (TRI) National Analysis,
agencies from over thousands of monitors.” January 2021.
11 23
U.S. EPA, Air Quality Design Values (Data file: “PM2.5 Design U.S. EPA Toxic Release Inventory Explorer, 2019 TRI Factsheets.
Values, 2019”). Data for this chart is based on overlapping 24
three-year averages beginning with 1999–2001 and ending with S ee U.S. EPA’s State Air Dashboard, part of Enforcement and
2017–2019. Compliance History Online (ECHO).
12
U.S. EPA’s listing of areas designated nonattainment or mainte-
nance for the 2008 ozone NAAQS can be found here. In 2015,
U.S. EPA lowered the NAAQS for ozone to .070 parts per million
(ppm), based on the annual fourth-highest daily maximum
8-hour average concentration, averaged over three years. In
2020, U.S. EPA retained the 2015 standard of .070 ppm.
STATE AIR TRENDS & SUCCESSES: THE StATS REPORT | 21American Air Quality in
an International Context
S T A T E A I R T R E N D S &State
S U Air
C CTrends
E S S E&
S :Successes:
T H E S t The
A T SStATS
R E PReport
ORT | 22the association of air pollution control agencies
Air Quality and Growth Indicator Trends in the United States
According to U.S. EPA’s June 2020 report, Our Nation’s Air: EPA Celebrates 50 Years!, the United States has reduced aggregate emissions of the
six criteria air pollutants by 77 percent since 1970.1 The substantial, sustained decline in emissions have led to improved air quality in the
United States while Gross Domestic Product (GDP) rose 285 percent, vehicle miles traveled increased 195 percent, the nation's population
grew 60 percent, and energy consumption went up 48 percent.2
Growth Indicators and Emissions Reductions in the United States
1970–2019
Growth Indicators and Emissions Reductions in the United States
1970 – 2019 Gross Domestic Product
300% 285%
250%
Vehicle Miles Traveled
195%
200%
150%
100%
Population Energy Consumption
60% 48%
50%
CO2 Emissions
25%
0%
1970 1980 1990 1995 1996 1997 1998 1999 2000 2001 2002 2003 2004 2005 2006 2007 2008 2009 2010 2011 2012 2013 2014 2015 2016 2017 2018 2019
Aggregate Emissions of Criteria
Pollutants
-50% -77%
-100%
Source: U.S. EPA, Our Nation's Air: EPA Celebrates 50 Years!, June 2020. (Section: “Economic Growth with Cleaner Air”).
Internationally, the United States ranks:
• First in GDP, at $21.43 trillion in 2019,3 representing nearly a quarter of gross world product4 and nearly $7.2 trillion more than China, the
country with the second-highest GDP in 2019.5
• Second in energy production, behind China, according to International Energy Agency (IEA) data.6 From 1960 to 2018, the United States
increased energy production approximately 125-percent7 and, in 2018, was 97 percent energy self-sufficient.8
• Third in total population, behind China and India,9 with a 60-percent increase in population from 1970 to 2019, from 203 million people to
328 million.10
STATE AIR TRENDS & SUCCESSES: THE StATS REPORT | 23the association of air pollution control agencies
International Trends | Fine Particulate Matter
In October 2020, the Health Effect Institute and Institute for Health Metrics published the State of Global Air/2020 report. The report includes
2019 data mapped for average annual population-weighted fine particulate matter (PM2.5) concentrations across the world and shows a U.S.
concentration of 7.7 micrograms per cubic meter (µg/m3) for the year.11
Average Fine Particulate Matter (PM2.5) Concentrations in 2019
Source: Health Effects Institute and the Institute for Health Metrics and Evaluation, State of Global Air/2020, October 2020.
To explore data, see interactive map: “Population-weighted annual average PM2.5 concentrations in 2019.”
International Trends | Ozone
Comparing the top five countries by population, the
interactive dataset accompanying the State of Global
Air/2020 shows that only Indonesia has lower average
seasonal ozone concentrations than the United States.12
Source: Health Effects Institute and the Institute for Health Metrics and
Evaluation, State of Global Air/2020, October 2020. Data available here.
STATE AIR TRENDS & SUCCESSES: THE StATS REPORT | 24the association of air pollution control agencies
World Trends | Carbon Dioxide Emissions
Of the five most populous nations, the United States is the only one to reduce carbon dioxide (CO₂) emissions in the past decade. From
2009 to 2019, data from the IEA show that the United States reduced CO₂ emissions by 963.5 million metric tons (7 percent) while China and
India, the next two most populous nations, increased CO₂ emission by 6.7 billion metric tons (38 percent) and 1.4 billion metric tons (56 per-
cent), respectively.13 Over the same 10-year period, the U.S. also decreased emissions per capita by 24 percent, while both China and India
experienced significant per-person increases.14
CO₂ Emissions Change by Country Five
Carbon Dioxidelargest countries
Emissions Change by Country by population (Baseline 2009)
Five largest counties by population
60%
(Baseline 2009) India
56%
Indonesia
50% 48%
Pakistan
40% 45%
China
38%
30%
20%
10%
0%
2009 2010 2011 2012 2013 2014 2015 2016 2017 2018 2019
-10% United States
-7%
Source: IEA, Data and Statistics (Total CO₂ Emissions per Country).
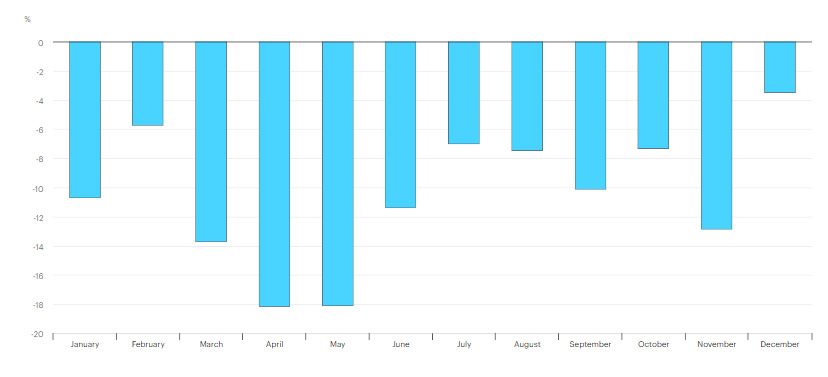
Global Energy-Related CO2 Emissions in 2020
Monthly evolution of CO₂ emissions in selected major economies, 2020 relative to 2019
The IEA report, Global Energy
Review: CO₂ Emissions in 2020,
states that “global energy-re-
lated CO₂ emissions fell by
5.8% according to the latest
statistical data.” The report
charted the monthly change
in CO₂ emissions in 2020
relative to 2019 in the United
States, China, India, and
Brazil.
Source: IEA, Global Energy Review:
CO2 Emissions in 2020, March 2, 2021.
STATE AIR TRENDS & SUCCESSES: THE STATS REPORT | 25the association of air pollution control agencies
Section Notes | American Air Quality in an International Context
1
U.S. EPA, Our Nation's Air: EPA Celebrates 50 Years!, June 2020.
2
U.S. EPA, Our Nation's Air: EPA Celebrates 50 Years!, June 2020.
3
U.S. Bureau of Economic Analysis, data available here.
4
World Bank, GDP Listings by Country, February 2020.
5
World Bank, GDP Listings by Country, February 2020.
6
International Energy Agency, IEA Energy Atlas, 2018.
7
.S. Energy Information Administration, State Energy Data
U
System (SEDS): 1960-2019, June 2020.
8
International Energy Agency, IEA Energy Atlas, 2018.
9
.S. Census Bureau, U.S. and World Population Clock,
U
February 2020.
10
U.S. Census Bureau, Current Population.
11
ealth Effects Institute and the Institute for Health Metrics and
H
Evaluation, State of Global Air/2020, October 2020. For method-
ology, see “How We Estimate PM2.5 Exposure,” which states that
“This method produces a population-weighted annual average
concentration for a given country or region. Population-weighted
annual average concentrations are better estimates of population
exposures, because they give proportionately greater weight to
the air pollution experienced where most people live.”
12
ealth Effects Institute and the Institute for Health Metrics and
H
Evaluation, State of Global Air/2020, October 2020.
Data explorer here. For methodology, see “How We Estimate
Ozone Exposure,” which states that “This method evaluates
human exposure to ozone in terms of the population-weighted
average seasonal 8-hour daily maximum concentration for a
given country or region. Population-weighted annual average
concentrations are better estimates of population exposures,
because they give proportionately greater weight to the air pollu-
tion experienced where most people live.”
13
International Energy Agency, World Energy Balances.
14
International Energy Agency, World Energy Balances.
STATE AIR TRENDS & SUCCESSES: THE StATS REPORT | 26You can also read


