GEOGRAPHY A student's guide to the Independent Investigation - A LEVEL - OCR
←
→
Page content transcription
If your browser does not render page correctly, please read the page content below

Qualification
 Accredited

A LEVEL
Student Guide

GEOGRAPHY
H481
For first teaching in 2016

A student’s guide
to the Independent
Investigation
Version 1

                             www.ocr.org.uk/geography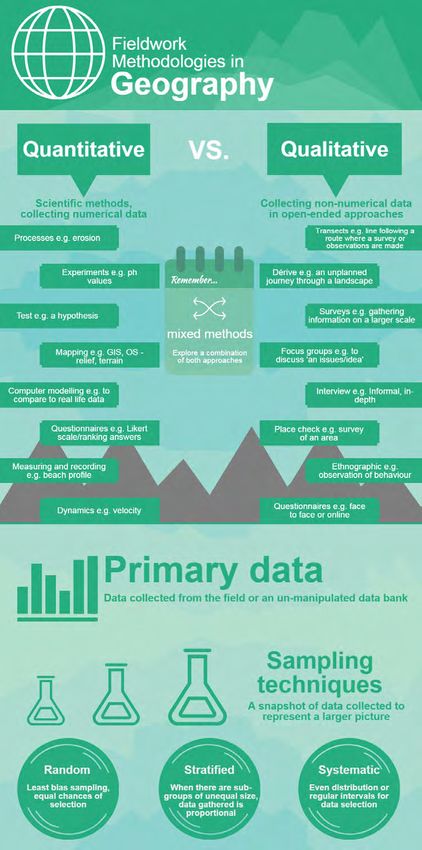
A Level Geography                                                      Student’s Guide

     Contents
     1.0 Introducing the Independent Investigation                     3

     2.0 Developing Individuality: Research, Focus and Title           6

     3.0 Data, Information Collection Methods and Sampling Framework   10

     4.0 Data Presentation Techniques                                  13

     5.0 Data Analysis and Explanation                                 15

     6.0 Conclusions and Investigation Evaluation                      17

     7.0 Overall Quality and Communication of Written Work             19

                                                       2                    © OCR 2017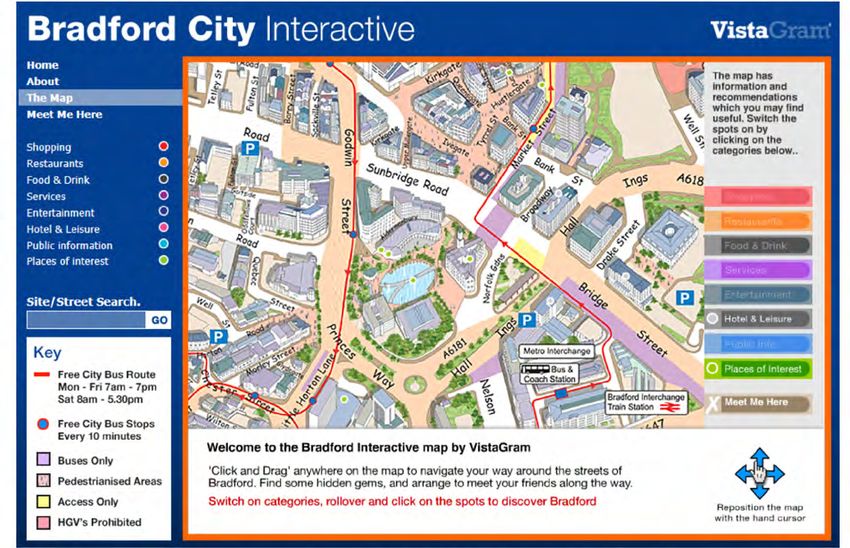
A Level Geography                                                                                                       Student’s Guide

    “Fieldwork is an opportunity to discover, explore and find things as
                   well as test new geographical ideas”

1.0 INTRODUCING THE INDEPENDENT INVESTIGATION
Planning and then undertaking your own independent investigation is a good opportunity to explore an aspect of geography
in more depth that is of interest to you. Your investigation will encourage you to read about a topic in more depth, root out
any geographical theories which are relevant to your investigation and then test some of these ideas / assumptions in the field.
But a personal independent investigation can also present challenges as it requires skills of organisation, motivation as well as
independence. The key to ‘surviving’ the independent investigation comes with good planning as this will support your journey
through this substantial piece of work. It is perfectly normal for your ideas to evolve (change) as you work through your investigation
from the time your title is devised and you get ‘out in the field’ this is because you become more familiar with your chosen topic area,
make sure you write these reflections down as you may want to ‘tweak’ your title, key questions etc.

The independent investigation or NEA (Non-Examined Assessment) is worth 60 marks in total and forms 20% of the total A level
assessment. See Figure 1 below.

Figure 1: Independent investigation in relation to the OCR Geography specification.

As this is a substantial piece of work you should look to spend around 30-40 hours completing the work (but this might vary
according to your school / college). This excludes the time for collecting your fieldwork data.

The independent investigation:
•   Is linked to any area of the specification. This can include topics that are options which you are not studying, although that
    would be unusual and carries a risk as you may be less familiar with the topic content. You could link more than one topic for
    example coastal management and place or hazards and place, this will depend on your chosen title.

•   Is a recommended 3,000 - 4,000 words. You will not be penalised for exceeding the recommended length; however, work
    that significantly differs from the recommended length will might be self-penalising. The ability to write succinctly (keeping to
    the word length), making points sharp and focused especially in the analysis and conclusion will help the reader (your teacher)
    navigate their way through.

•   Includes primary and secondary data collection. Page 10 of this document contains an explanation of the differences.
    Note that there does not need to be a balance of primary and secondary, it will depend on the nature of the topic under
    investigation.

                                                                     3                                                        © OCR 2017
A Level Geography                                                                                                                     Student’s Guide

There are also wider benefits to carrying out your independent investigation which should not be underestimated. Some of these,
for example, are relevant to university or job applications. Figure 2 provides a summary of the benefits of high quality fieldwork. A
good piece of investigative work will likely reinforce some of these embedded skills and competencies.

 Application and evaluation of     •   Develops skills in data handling (using ‘big data’ e.g. Census) and statistical understanding
 knowledge and understanding       •   Helps with skills of literature research and selection of material; can develop synthesis skills
                                   •   Improve technology skills, e.g. spreadsheet manipulation or analysis using GIS
 Developing ‘deeper’ learning      •   Geographical curiosity helps ‘see’ things differently
                                   •   Encourages caution and reflectivity in data analysis, as well as taking geographical meaning
                                   •   Enables critical thinking and the ability to challenge ideas / theories
                                   •   Helps with skills of reasoning particularly with data and analysis
 Social dimensions                 •   Helps foster independent learning
                                   •   Creates an atmosphere for co-operation with peers in problem solving
                                   •   Teaches the skills of planning and procedure which will be transferable to other situations and subjects.
                                   •   Greater awareness of ethical considerations as part of the enquiry process (especially within fieldwork
                                       and data collection)
Figure 2: Benefits of high quality fieldwork. Source: adapted from Lambert and Reiss (2014) http://www.field-studies-council.org/
media/1252064/lambert-reiss-2014-fieldwork-report.pdf
There may be several ideas that go into independent investigations, linked to enquiry:
1) it creates a need to know; as you have a genuine interest in the topic
2) the work uses real-world data and information, gathered by you
3) it requires you to make sense of geographical information
4) it is reflective as your investigation evolves and you learn more about your topic

1.1 The stages of geographical enquiry and links to the marking criteria
You may be familiar with the process of enquiry from geography and science for instance. In this type of enquiry there is an
identifiable start, middle and end. Understanding this pathway is important since it forms the basis and structure of the marking
criteria for your independent investigation. It is important for you to understand the marking criteria as this can be used as a
guide when planning and undertaking your investigation. The full marking criteria can be found on pages 59-64 of the A level
specification. See Figure 3 below.

        Stage of the investigation                    Things to think about from the marking criteria

 1      Planning, purpose and introduction            •    Are you producing a plan and research framework for your investigation?
        (8 marks)                                     •    Have you got a clear idea where (geographical location) you are doing your
                                                           research?
                                                      •    Will you be doing a literature review to learn more about your chosen topic?
 2      Data, information collection methods          •    What quantitative and / or qualitative approaches have you chosen?
        and sampling framework                        •    Do you have a clear idea for your primary data collection and how you
        (7 marks)                                          might record this information?
                                                      •    What secondary data are you using and how will this be recorded?
                                                      •    Have you got a data design framework? What will you collect, where, when
                                                           and how?
                                                      •    When you collect your data, have you consider who this might affect?
                                                           (ethical and socio-political dimensions)
 3      Data presentation techniques                  •    Have you gone through and organised your data?
        (9 marks)                                     •    Have you explored a range of data presentation techniques and selected
                                                           the ones best suited to your data?
                                                      •    Will you plan your data presentation? Consider where your data will appear
                                                           throughout your write up, what it shows and how it links to your title, aims
                                                           or questions or hypotheses.
 4      Data analysis and explanation                 •    Have you understood what it means to analyse data and done some
        (14 marks)                                         reading about the techniques that would support your investigation?
                                                      •    Are you going to do qualitative, or quantitative, or mixed methods analysis?
                                                      •    Does your analysis help to unpack your title or questions / hypotheses?
                                                      •    Will you discuss / compare your findings with your literature review?

                                                                        4                                                                  © OCR 2017
A Level Geography                                                                                                         Student’s Guide

        Stage of the investigation                  Things to think about from the marking criteria

    5   Conclusions and investigation               •    Will you plan your conclusion before writing, so that you are bringing your
        evaluation                                       ideas together?
        (12 marks)
                                                    •    Have you placed your investigation into a wider geographical context?
                                                         Where does it ‘fit’ with what you have read or understood for your chosen
                                                         topic?
                                                    •    Does your evaluation consider the investigation as a whole, your research,
                                                         data collection and the value of your findings?
    6   Overall quality and communication of        •    Have you set your investigation out as clearly as possible with a definite
        written work                                     structure?
        (10 marks)                                  •    Will you re-read your work once it’s completed to ensure its accurate and
                                                         you have expressed yourself as clearly as possible using geographical
                                                         language?
                                                    •    Are you going to keep accurate records and note down (bibliography /
                                                         reference list) what you have read?

Figure 3: Components of geographical enquiry, relevant to the OCR Independent Investigation marking criteria. Many of these are discussed
in more detail in this document.

1.2 Planning your investigation
As this is a substantial piece of work it is important to have a plan as this will help to keep you on track and focused. Your plan gives
you an outline of your investigation and should include your title, a break-down of your title (sub-questions or sub-hypotheses) any
potential aims (if you are including these). Your investigation needs a purpose – what is it you want to find out and why? Your plan
should link all of these things together so you have your investigation purpose and your title, sub-questions etc. Your plan is the first
step in the investigation process and will help you to look at the big picture (your investigation as a whole).

1.3 Developing a research framework
A research framework is an outline of how you will find the information you need and carry out the research for your investigation.
It will help you to narrow down the type of investigation you want to do e.g. quantitative, qualitative or a mixed methods approach.
This will be discussed in more depth in section 3.2. You also need to consider the balance between primary and secondary data
collection. Is one going to be more important in your research or will they be relatively balanced?

Research is a process and therefore needs to be designed and as part of this you need to think about the steps you will take to
gather all the information / data you need to answer your title and aims / key questions / sub-hypotheses. Think about the following
in your research framework:

•        What data do you need and why?

•        Where and how you will obtain the data?

•        How much data do you need and how will you select it?*

•        How will you decide which methods are appropriate to undertake your research?

* This is called sampling and will be discussed in more depth in section 3.3

When you are designing your research for your investigation it is important to consider the validity and reliability of the data you
collect. Validity refers to how sound your research is, have you found out what you said you would through your methods and data
collection? The reliability means that if another student / researcher carried out the investigation again would they find the same
results? This is discussed further in section 3.

                                                                    5                                                          © OCR 2017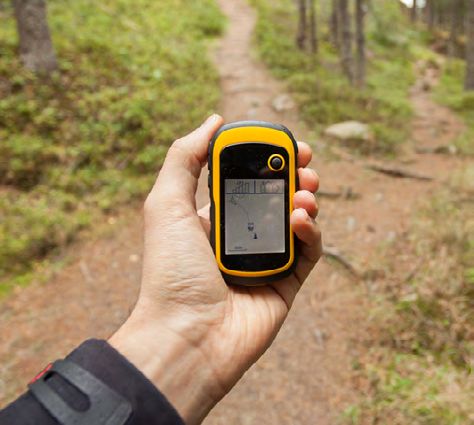
A Level Geography                                                                                                                 Student’s Guide

2.0 DEVELOPING INDIVIDUALITY: RESEARCH, FOCUS AND TITLE
Successful investigations often end-up considering geographical ideas which are linked to changes which occur over space and/or
time. Investigations should carefully consider the following:

1) Is the work geographical and linked in a meaningful way to some area of content within the OCR specification?

2) Is the investigation and planned work manageable in terms of scale, time, equipment, location and transport? Most importantly,
   is it small in scale and achievable?

3) Does the initial topic research indicate there will be sufficient high quality supporting published data and information?

4) Does the work provide links to other geographical topics and issues so that it can be framed within a ‘bigger picture’ or be
   synoptic in nature?

Some people recognise an idea of ‘messy’ geography. This is based on the notion that the real world is often very complex and that
fieldwork data is also often difficult to interpret and take meaning from. In other worlds, fieldwork data and research information
can reject geographical models and assumptions that may exist in school textbooks. You should not be worried that outcomes
generated are controversial or not as you expected, this can give you some interesting aspects to discuss in your analysis and
conclusions.

2.1 Planning, purpose and introduction
Coming up with your own geographical idea or focus can be one of the most challenging aspects of the independent investigation.
Often this will not happen instantly and your ideas and thoughts may change and build as you do more reading. Your geographical
focus might be something that is a topical issue locally for example, or something that you have read or studied previously.
Importantly it must have geographical meaning, purpose and a direction to follow. If you are visiting a field centre for example,
then you might be given opportunities to work in a particular environment away from home and school, but you will still need to
devise your own title independently. Look at Figures 4a and 4b. What different geographical themes could be investigated in these two
environments?

Figures 4a and 4b: These kinds of environments will offer rich pickings in terms of different projects if you can “peel away” the layers of
geography that exist within them.

The focus of your investigation can be a question, aim or title and this depends on the type of investigation you would like to do. It is
a good idea to break this down further through sub-questions or sub-hypotheses as this will help to direct your background reading,
research framework and data collection.

2.2 Background information and literature research
Having developed a geographical idea or focus, the next stage should be to conduct research from literature. The purpose of this is
to get additional background information which may be used in a variety of ways:

•    To get the most up-to-date thinking about a topic or subject (this could include journal articles e.g. Geography Review, Area,
     Geo).

•    To explore geographical models and theories that may be relevant to the idea or focus of your investigation.

•    To help set the context of your investigation, e.g. locational details (geology map, large scale OS maps etc).

                                                                         6                                                              © OCR 2017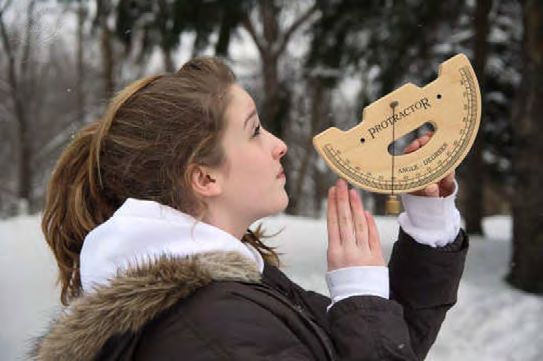
A Level Geography                                                                                                            Student’s Guide

•   To explore similar examples and places.

•   To show local opinions e.g. blogs.

In many respects the background information kick-starts the process of ‘searching for answers’, before you have stepped out and
started to collect any primary or first-hand fieldwork data. Literature research is an important aspect of the investigation, this can be
invaluable when it comes to your analysis and conclusions as you have something ‘concrete’ to compare your findings too and can
help you to debate what you found out.

Literature research means finding the current academic or published information around a topic. Be sure to evaluate any research
information based on age, author, source etc, as well as check whether the research is agreed by other authors.

There is likely to be a spectrum of research that can be used, based on type, reliability and sophistication. Best practice might be to
try and include a mix or blend of different types of documentary evidence.

Figure 5: An example of a different type of research literature such as a local government report or Shoreline Management Plan.

It is going to be very important to keep an accurate record of the sources and to use referencing such as ‘Harvard’ in the
independent investigation. This style of referencing, primarily used in academic writing, to cite (reference) information sources. Each
reference should contain in a sequenced order: (1) Name of the author(s), (2) Year published, (3) Title, (4) Publisher, and (5) Pages
used. This approach is modified for example if you are using a newspaper or internet source.

•   Last name, First initial. (Year published). Article title. Newspaper, [online] pages. Available at: url [Accessed Day Mo. Year].

•   Last name, First initial (Year published). Page title. [online] Website name. Available at: URL [Accessed Day Mo. Year].

http://www.citethisforme.com/harvard-referencing

The introduction to your investigation should include a general discussion of the geographical issue or topic that you are
studying. In other words, this is the opportunity to say how the most up-to-date literature (from your research) gives a context and
background to your investigation focus.

2.3 Setting up workable hypotheses or questions
To make your investigation manageable and to explore your title more deeply

Questions and hypotheses generally fall into two main types: (1) those that focus on spatial or areal or temporal differences and, (2)
those that focus on relationships between variables. Whatever is chosen as a focus for the independent investigation, there must be
a clear geographical element and an obvious linkage to the specification. Figure 6 shows the difference between an aim, question
and hypothesis.

                                                                     7                                                             © OCR 2017
A Level Geography                                                                                                            Student’s Guide

    Aim                                           Question                                       Hypothesis
    A statement of what that investigation        A question that is asked (in a question        A hypothesis is a statement whose
    is setting out to achieve. It must be         format), which often links with the overall    accuracy can be tested objectively using
    geographically sound and achievable.          title and can be used as a way of sub-         scientific methodology.
                                                  dividing the title.
    An investigation into the impacts of water    How and why do cliff profiles vary along a     Biotechnology has successfully improved
    extraction on stores in area X.               stretch of coastline between points X and Y?   food security.
    An investigation into contrasting             To what extent has economic globalisation      Shingle beaches have a steeper gradient
    regeneration initiatives in places X and Y.   influenced people’s sense of place in X?       than sand beaches.

Figure 6: Exploring the difference between an aim, question, and hypothesis.

It is up to you to decide how many questions or hypotheses might be appropriate; it is possible to use a “mix and match approach”,
i.e. a single over-arching aim and then a series of 2-3 sub-questions for example.

Guide to writing your investigation title
The A level Independent Investigation is an opportunity for you to study an aspect of geography in more depth and conduct your
own research and data collection. One of the most challenging activities when starting your investigation is to come up with a title.
A good title makes it clear to the reader what the research topic is and the type of investigation you will be doing.

Assuming you have chosen a particular topic that you are keen to investigate further, you will need to narrow this down through
your investigation title. A good title has both a geographic and location context:

•      Geographic context – what topic, theme or issue in the specification are you keen to investigate further? Whatever you choose
       to investigate this should have a link to the specification content.

•      Location context – where is the investigation, fieldwork and data collection going to take place?

The term ‘context’ here means that your title starts to define what you are looking at and where this is going to take place

The title of your independent investigation needs to be concise and descriptive and can be in the form of a statement, question or
hypothesis e.g.

•      To what extent are groynes the most effective coastal management strategy in Sheringham?

•      Sexuality influences perception of place in Bristol.

Sub questions/hypotheses

It is not just your title that is important as you may also have sub-questions (potentially 2 - 4). These will guide your research and
provide a framework. Your sub-questions enable you to break your title down and look at aspects of it in more depth. It would be
advisable that your sub questions follow a logical sequence. Each sub question/hypothesis should be an answerable question or
testable hypothesis that is clear and well-defined for you to do the research needed within an appropriate time frame.

The information you provide in your proposal form in the investigation title or planned investigation hypothesis or question/sub
questions sections should demonstrate how your investigation is capable of being tested or answered to enable you to analyse your
data and reach substantiated conclusions within an appropriate time frame.

Top tips – thinking more about your title

Is it relevant?

•      To an academic debate or intellectual interest?

•      A topical issue from the news or personal experience?

•      Does your investigation lend itself to meaningful data collection, analysis and evaluation?

•      Does your title enable you to go in search of information and data which enables you to reach conclusions, recognising that
       there might be more than one answer?

Is your title manageable?

•      Your question must be within your ability to tackle it in terms of scope and scale e.g. can you collect all the data you need?

                                                                       8                                                           © OCR 2017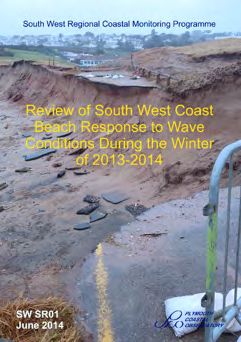
A Level Geography                                                                                                               Student’s Guide

•     Where and how are you going to collect data for your investigation? Is this accessible? Practical? Safe?

•     What are the timescales you have to complete your investigation?

Does it meet the requirements of the assessment?

•     Is your title linked to part of the A Level specification? *

•     Can you access all parts of the mark scheme by using your title? *

•     Does your title enable you to collect sufficient data e.g. primary, secondary, qualitative, and / or quantitative?

* Don’t forget you can look this up on the OCR website (A level geography) specification and talk to your teacher about this.

Is it of interest to you?

•     If your question is of interest to you, this will help you remain motivated and engaged with your investigation.

•     Is your question clear and straight forward? What looks like a simple question could allow the complexity to develop once the
      investigation, research and fieldwork begin.

Final thoughts

Your independent investigation title needs to be clear and concise – what is it you want to investigate, where and why? Your title
can be very specific and narrow in focus or a little broader with focussed sub-questions to break the title down.

There is no definitive way to approach this but remember your initial ideas for your title will be refined as you do some reading
and become more ‘expert’ in your chosen topic area. Your title will evolve and change and as you complete your Independent
Investigation proposal form, you can plan your investigation and think through your ideas. Your teacher will finally sign your form
indicating that your title and investigation is fit for purpose.

Glossary

•     Title – This frames your investigation / enquiry and can be in the form of a question or statement.

•     Hypothesis – A statement which is a prediction and can therefore be tested (through data collection, analysis and evaluations)

•     Sub question – This is a question which addresses an aspect of the title and helps to break it down for the purpose of research
      and data collection.

2.4 Linking the topic focus to a ‘specialised concept’
All the new 2016 GCE Geography specifications will include reference to a number of core or specialised concepts. In total there are
14 of them:

    (1) causality, (2) systems, (3) equilibrium, (4) feedback, (5) inequality, (6) representation, (7) identity,
    (8) globalisation, (9) interdependence, (10) mitigation and adaptation, (11) sustainability, (12) risk,
    (13) resilience and (14) thresholds.

The specialised concepts are included in many of the new topics in AS and A level because of their relevance to 21st century
geography and its associated themes. They are the ‘language’ that is used by both professional geographers and academics. Often
you will see the terminology used in the media as well. As such, sometimes their meaning can be complex, multi-dimensional as
well as sophisticated.

Inclusion of specialised concepts linked to fieldwork could add an extra dimension or layer of complexity that pays dividends in
terms of trying to make your work both more relevant and sophisticated. Although many of the concepts can be linked to either
broadly physical or human topics, there is also considerable overlap. Take the example of threshold for instance. Thresholds in
physical systems are generally (critical) tipping points, after which the system shifts radically and potentially irreversibly into a
different equilibrium state. Could the same idea be applied in human geography – consider its relevance to the subject of ‘place’
and social inequality, could an inequality threshold be reached? Could a tipping point be evidence of extreme inequality with
significant contrasts in where and how people live?

                                                                      9                                                              © OCR 2017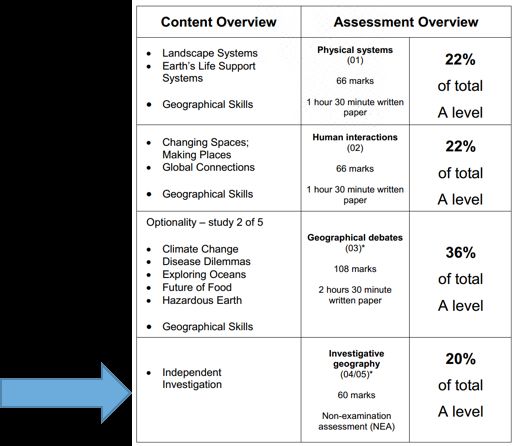
A Level Geography                                                                                                        Student’s Guide

3.0 DATA, INFORMATION COLLECTION METHODS AND SAMPLING
FRAMEWORK
This is part of the independent investigation where you think carefully about how, when and what primary and secondary data can
be collected.

3.1 Initial considerations
Careful thought needs to be given to the timing and location of data collection. Questionnaire surveys in towns or rural areas
for example might want to be timed to maximise the number of potential respondents (visitors or local residents). Similarly, in a
physical geography context, processes will vary from time to time and especially season to season.

3.2 Types of data
At this stage it is useful to reflect on the balance between primary and secondary as well as qualitative and quantitative data.

  Primary data is generally considered to be first hand data collected by a student themselves (or as part of a group). Secondary
  data (which may be part of the research) means information that has already been collected by someone else. In reality there
  is some ‘grey’ between these two ideas and approaches, sufficient to say that you should expect to have a reasonable balance
  between the two types.

  Quantitative data and information is that which includes numbers and numerical data, whereas qualitative data is descriptive
  and can include things such as photographs, or written texts. A mixed methods approach means that you could use a mixture
  of quantitative and qualitative data.

Both qualitative and quantitative approaches are valuable to an enquiry, but the balance between the two will be very dependent
on the choice of topic and its focus. Physical topics may feel like they lend themselves to more ‘counting’ but always try and blend
with some good qualitative information. More human topics are likely to swing towards qualitative, but the quantitative can often
be found in the form of published data and research.

                                                                  10                                                          © OCR 2017
A Level Geography Student’s Guide
11 © OCR 2017A Level Geography Student’s Guide
3.3 Sampling
Good sampling is integral to the research design. Sampling is a snapshot of a larger picture as you cannot collect huge amounts
of data for your investigation. You will need to decide on your ‘sample’ size i.e. how much data represents enough for you to make
a judgement in your analysis and conclusions. There are also three methods for sampling explained below. The more rigorous and
reliable your methods of data collection (having thought through carefully and planned in your sampling), the greater the validity in
the conclusions.
Sampling is the limited number of measurements that you make. This is different to a population which is the total number
of measurements that you could potentially take if you measured everything and / or everyone in the environment. Larger
samples generally mean greater reliability, until a point is reached where increasing samples has very little effect on quality of
outcome.
There are three main aspects of sampling:
1. Deciding on an appropriate sample frame.
2. Choosing an appropriate sample size.
3. Selecting the best sampling method – systematic, stratified and random. There are various places to find out more about these,
but this is a useful starting point http://www.rgs.org/OurWork/Schools/Fieldwork+and+local+learning/Fieldwork+techniques/
Sampling+techniques.htm
Figures 8a and 8b: Choosing the right equipment is important, it can be digital and / or traditional equipment. 8a There are a number of free
apps that can be used to collect data. 8b A clinometer used by the student to measure angles (in slope).
3.4 Managing fieldwork risks
Whilst geography fieldwork mostly is very safe, there is still an element of risk no matter what environment you are working in. Your
job is to anticipate, minimise and manage any possible risks, starting at the planning stage and extending throughout the fieldwork.
Risk assessment is based on three things:
1. Identify the potential hazard e.g. traffic, tide times, sensitive questions in interviews.
2. Assess the risk presented by a particular hazard.
3. Create a plan / management strategy for minimising and reducing the risk.
Your teacher(s) will be able to offer more advice on the risk assessment procedure, but best practice would suggest that the
independent investigation will include a formal risk assessment of some sort.
12 © OCR 2017A Level Geography Student’s Guide
4.0 DATA PRESENTATION TECHNIQUES
In geographical research, the way in which you present your data is key to communicating what you have discovered. Often in
published work the maps, images and graphs are one of the first things a potential reader will look at; they are key to engaging a
reader.
The role of any data presentation is to distil different types of data and information into a few easy, well selected and easy to
interpret figures. Figure 9 shows the preceding processes.
(1) Gather all (2) Select and
(3) Put data into
data together sort data and
a spreadsheet
(including group information.
ready for the
if relevant), Disguard
next stage of
prepare and anything not
reppresentation
tabulate directly relevant
Figure 9: A simple flow diagram of how to get your data ready for the presentation stage.
4.1 Presentation selection
How you chose to present your data will depend on many of the decisions you made during the design stage, e.g.
1. The type of question(s) you are looking to answer.
2. The sampling strategy.
3. The volume data / information collected.
4. The methods of data collection.
5. The nature of your data: qualitative vs quantitative.
With all of this in mind, your data will most likely be presented via a combination of graphical (graphs, diagrams, images, tables
and infographics) or cartographical (maps) techniques. Figure 10 shows some examples of the techniques that are available.
Additional research will be needed to find out more about any individual approaches.
Type of Information Graphical (G) and Cartographical (C) techniques
Representation of sequential data that changes Line graphs (G)
over time Pictograms (G)
Circular graphs / rose diagrams (G)
Recorded data at different sites that has different Bar charts and histograms (G)
component categories Pyramid graphs (G)
Pie charts (G)
Mirror graphs (G)
Multiple / compound bar charts (G)
Where measurements of side views have been Long and cross profiles (G)
taken Cross sections (G)
Data that has been collected to demonstrate Choropleth maps (C)
spatial variation Isopleth maps (C)
Dot distribution maps (C)
Proportional symbol maps (C)
Representation of data with orientation or Rose diagrams (G)
bearing Polar co-ordinates (G)
Continuous data (along a transect) Kite diagram (G)
Scatter graph (G)
Multiple / compound bar charts (G)
13 © OCR 2017A Level Geography Student’s Guide
Type of Information Graphical (G) and Cartographical (C) techniques
Representing linkage or connections between Scattergraphs (G)
two sets of data Mirror graphs (G)
Figure 10: examples of graphical and cartographical techniques, and when they might be used.
Below is a simple checklist of things you should remember or apply when presenting fieldwork data:
1. What’s the question you are trying to answer?
2. Use the presentation as a tool to provide as much information as possible.
3. Get ideas about how other agencies and organisations present data and information about their research, products and services.
4. Be technically accurate and complete (keys, titles, labels etc).
5. Don’t be afraid to be imaginative and creative.
Marks are rewarded for good selection of techniques; this means that there is not always a requirement to present all your data and
information. Again think back to your title and geographical questions which is at the centre of your work.
4.2 Use of GIS
Utilising GIS (Geographical Information Systems) to present data and information has a number of advantages over either paper- or
spreadsheet-based methods. Not only does the end result generally look more technical (as GIS provides the user with presentation
tools, e.g. proportional circles – Figure 11), but it is also much quicker and easier to manage and process large sets of data. This is
an example of a geo-spatial technology. You can create your own GIS map at ArcGIS online or use them as secondary sources (for
analysis) such as the Bradford GIS map below.
Figure 11: GIS map example for Bradford.
14 © OCR 2017A Level Geography Student’s Guide
5.0 DATA ANALYSIS AND EXPLANATION
This section carries 14 marks (23%) so is significant in terms of weighting against other parts of the Independent Investigation
marking criteria. You are required to demonstrate knowledge and understanding of techniques, in other words show that you are
using the correct analysis tool and that you can justify it’s usage based on the data and information collected.
Analysis usually consists of three linked activities:
(1) Description (supported by information, data and other evidence). Part of the description will likely be to undertake statistics,
either descriptive or inferential. See below.
(2) Explanations (providing likely geographical reasons, linked to patterns and trends in the data).
(3) Finding, synthesising and suggesting geographical links in the data (and linkage to the theory, literature or comparative studies).
5.1 Quantitative data analysis
Data will likely be initially described as part of the interpretation of data and information. This should include:
(a) an initial description of the main patterns and trends,
(b) exemplification of the patterns and trends using data / information from the relevant tables, charts or maps,
(c) identification of anomalies or exceptions which deviate from the main patterns and trends.
It is then possible to ask a series of questions which effectively kick-start the analysis process.
• What is the range (or spread) of values within the data set?
• Where are most of the values concentrated (i.e. is there any clustering)?
• Are there any clear gaps between the concentrations?
• What is the shape of the distribution of the data values?
• Are there any extreme values (which may include anomalies and / or outliers)? How far separated are these from the normal
range of data?
Figure 12: Summaries of some techniques for data analysis using quantitative techniques. There are a large number of written resources
available to help you use these procedures that can be found online, e.g. https://www.rgs.org/NR/rdonlyres/4844E3AB-B36D-4B14-8A20-
3A3C28FAC087/0/OASpearmansRankExcelGuidePDF.pdf for Spearman’s Rank.
Statistical purpose Name of method
To compare and summarise data (central tendency) Mean
Median
Mode
To measure the dispersion, spread and variability of data Quartiles (upper and lower)
(range) Inter-quartile range
Standard deviation
To calculate the degree of statistical correlation (linkage) Spearman’s rank
between two variables Calculation of line of best fit
To test for differences between sets of data (can be more Chi-squared test
than two) Students t-test
Mann-Whitney test
To mathematically describe the distribution of points in a Nearest Neighbour Statistic
pattern
Figure 12: Quantitative data analysis techniques. This includes more sophisticated inferential techniques.
5.2 Qualitative data analysis
Words and text generated by questionnaires and interviews for example, or data in a textual / photographic form needs to be
described, analysed and summarised. There are a variety of ways in which you could analyse (code) a piece of text. This text could
come from an online source or interview for instance. The method chosen will vary according to question focus. See Figure 13.
15 © OCR 2017A Level Geography Student’s Guide
Coding is the process of categorising quantitative and / or qualitative data for the purpose of analysis. Data is organised into
categories of similar themes, ideas, concepts (this will be dependent on your investigation) and these are coloured coded for
example and any patterns can be indentified.
Coding Approach Question focus
Polarising Look through the text and highlight any positive or negative statements – these
could be used as ‘soundbites’ within your report or counted up to compare number
of positive or negative statements.
Polar Scaling Takes the polarising process a step further by assessing the strength of a positive or
negative statement – similar to carrying out a bipolar survey. The overall strength of
positivity or negativity can be compared in greater detail.
Theming Although a number of people may say many different things they may boil down to
the same thing. It may well be possible to identify a number of key themes written
text and then group these themes further into a smaller number of concepts. The
number, or strength of comments in each theme may also be reviewed.
Categorising You may be analysing text to fit into particular groupings: environmental, social,
economic and political impacts. These categories could be used to sort responses
before using one or more of the techniques described above.
Linkages The complex nature of textual information means that it may be possible to ‘map’
linkages between different concepts or themes, these links may be explicit in what
text / respondents say, or implicit in how it is said, the way in which one point flows
into another.
Figure 13: Examples of coding (analysis) of qualitative information.
5.3 Making connections
If the results of an investigation are consistent with the title and aim, or questions or hypothesis being tested, then the model or
logic which underpins it, would seem to be verified. Sometimes the data provide a general pattern or trend that is clear, and at
other times but values deviate from the expected. Such anomalies could be explained by the complexity of geographical systems
and features. Often their explanation involves recognition and understanding of more than one causal factor, as well as possible
problems of data collection methodology and sampling accuracy (this is part of critical reflection and evaluation).
Often a diagram (spider diagram, mind map etc) can help visualise and reveal such connections.
16 © OCR 2017A Level Geography Student’s Guide
6.0 CONCLUSIONS AND INVESTIGATION EVALUATION
6.1 Delivering conclusions
There are several stages of drawing conclusions as shown in Figure 14. These naturally lead towards an evaluation of the report.
1. Reflect and review the title and topic or issue for the independent investigation.
2. Select and provide the most important evidence and information that supports and / or rejects
the aims or question or hypotheses.
3. Draw together ideas from concepts, theories or models to develop a logical line of
reasoning.
4. Comment on how the results may be inconclusive, which then links to the strength of the
conclusion.
Figure 14: The stages in creating conclusions, leading towards an evaluation.
The OCR marking criteria makes reference to extended writing so conclusions will likely form a good component of the 3-4000
words of your completed investigation. Importantly, you must consider the primary and secondary data and evidence which is
included in the earlier sections of your investigation. You will have to determine which aspects are the most and least significant in
terms of what you have found.
6.2 Linking to wider geographical understanding
Part of drawing conclusions should include links to the wider geographical context of what you have found. This idea of seeing the
‘bigger picture’ is again included as part of the marking criteria. Figure 15 provides examples of such linkages.
Example of investigation focus Wider geographical linkages
A study on the carbon stores in two contrasting Deforestation, biomass production, land-use change, climate change
woodland ecosystems
Evaluating the evidence for lowland glacial features Predicting the characteristics of other glacial features, land use change
conforming to and expected model in terms of size and and futures, mathematical predictability of other physical geography
shape features
An examination of the factors that make cliffs vulnerable Rising sea levels, coastalisation, changes in the numbers of stormy days
to collapse and subsequent recession
What is the identity of place T seen by different social Identity of other places, different socio and economic groups
and economic groups?
Figure 15: Opportunities for wider geographical linkages.
6.3 Evaluation and critical reflection
Evaluation is an opportunity to look back over all the fieldwork and research and to identify any shortcomings. It is also the chance
to think more widely about the meaning of your results, comparing to similar studies, noting and explaining similarities and
differences.
It is almost certain that all independent investigations will encounter some limitations of methodology. The most obvious concern
the choice and delivery of the sampling strategy, and, as a result, the amount and quality of data collected. In questionnaire surveys
for instance, obtaining high quality and representative samples can be difficult. This is because this type of survey work should be
based on a stratified approach based on the small output area statistics for a local area. Another problem is that rejection rates for
street interviews are high and students may resort to interviewing anyone willing to respond. There is also the problem of visitors –
a profile of them is likely unknown so it becomes difficult to create a reliable sampling design.
17 © OCR 2017A Level Geography Student’s Guide
Evaluate in terms of:
(1) errors linked to sampling and design,
(2) problems which are operator related (e.g. mishandling equipment) and,
(3) those which are directly linked to equipment (e.g. level of accuracy and resolution – see Figure 16).
Figure 16: Equipment may offer a precise reading, but how can you be sure that it is accurate?
Your evaluation section may also provide an opportunity to suggest improvements and make recommendations that would
improve the overall reliability of the investigation. If your teacher made a reflective comment on your independent investigation
proposal form and this has been factored into your investigation and write up, here would be a good place to discuss it.
6.3 Ethical and socio-political implications
You should have an awareness of ethical issues which are embedded in any study that involves the collection, analysis and
representation of geographical information about human or physical communities. The most common ethical dilemmas in human
geography focus around participation, consent, and the safe-guarding/confidentiality of personal information and data. In physical
geography the main ethical considerations are about consent/access to study sites and potential damage (i.e. over-use, trampling)
or possible pollution (including litter, contamination) of study sites.
Remember you need to consider the ethical and socio-political impact of fieldwork in order to fulfil the requirements of the marking
criteria.
18 © OCR 2017A Level Geography Student’s Guide
7.0 OVERALL QUALITY AND COMMUNICATION OF WRITTEN WORK
The marking criteria for this final section makes reference several ideas, these are shown in Figure 17.
Aspect of communication Description and meaning
Communication This includes spelling, punctuation and rules of grammar. It’s is also about the way in
which paragraphs, for example are used. Part of communication is the use of terminology
and technical language.
Arguments This is geographical thinking, with evaluation. Perhaps stating which parts of the system
or process that is being investigated are most or least important.
Structure Sequence (following route to enquiry), pages numbers, contents, could include an
Abstract and Appendix. Work is neat. Work is integrated through an argument and
reasoning.
Sources These are stated and use Harvard referencing system or similar. Likely to be include min-
text referencing and / or a listing at the end.
Terminology This would be technical language which is appropriate for the topic under investigation.
It may also be an opportunity to link to the specialised concepts.
Figure 17: Aspects of communication.
Proof reading checklist
The following ideas might be considered a useful set of hints and tips for any independent investigation. Think of them as an
integral part of the first proof-read (or pre-submission editing) and check.
• It will have a clear and focused geographical argument which is easy and logical to follow.
• It will follow a logical series of stages, mirroring those identified in the specification which link to a high quality route to enquiry.
• It has a clear geographical purpose and genuinely tries to uncover some ‘new’ geography.
• It will make use of high quality and specialised language and be well structured.
• It will use a high quality range of research and literature to contextualise the focus.
• It will around 3,000-4,000 words, but not substantially over that (this excludes words in diagrams, tables etc).
• It will be correctly referenced, including either (or both) in-text referencing and a bibliography.
• It will introduce research material in a selective way, making sure that large chunks of text are not copied.
19 © OCR 2017The small print
We’d like to know your view on the resources we produce. By
clicking on the ‘Like’ or ‘Dislike’ button you can help us to ensure
that our resources work for you. When the email template pops
up please add additional comments if you wish and then just click
‘Send’. Thank you.
Whether you already offer OCR qualifications, are new to OCR, or
are considering switching from your current provider/awarding
organisation, you can request more information by completing the
Expression of Interest form which can be found here:
www.ocr.org.uk/expression-of-interest
OCR Resources: the small print
OCR’s resources are provided to support the delivery of OCR
qualifications, but in no way constitute an endorsed teaching
method that is required by OCR. Whilst every effort is made
to ensure the accuracy of the content, OCR cannot be held
responsible for any errors or omissions within these resources.
We update our resources on a regular basis, so please check the
OCR website to ensure you have the most up to date version.
This resource may be freely copied and distributed, as long as
the OCR logo and this small print remain intact and OCR is
acknowledged as the originator of this work.
OCR acknowledges the use of the following content:
Square down and Square up: alexwhite/Shutterstock.com; Page
6 York rooftops, Jeff Dalton/Shutterstock.com; English beach,
Martin Christopher Parker/Shutterstock.com; Page 7 Image
of front cover of a report, Reproduced with permission from
Plymouth Coastal Observatory part of the South West Regional
Coastal Monitoring Programme; Page 12 iPhone 4s with icons
on display, Oleksiy Maksymenko / All Canada Photo / Universal
Images Group: Measuring height of a tree using a clinometer,
Ted Kinsman / Photo Researchers / Universal Images Group/
Britannica; Page 14 Bradford City Interactive map, www.bradford-
interactive.org, accessed Mar 2015. © Silvermaze 2009, reproduced
by kind permission of Maps.com; Page 17 Using a GPS in a forest,
TonelloPhotography/Shutterstock.com
Please get in touch if you want to discuss the accessibility of
resources we offer to support delivery of our qualifications:
resources.feedback@ocr.org.uk
Looking for a resource?
There is now a quick and easy search tool to help find free resources
for your qualification:
www.ocr.org.uk/i-want-to/find-resources/
www.ocr.org.uk/alevelreform
OCR Customer Contact Centre
General qualifications
Telephone 01223 553998
Facsimile 01223 552627
Email general.qualifications@ocr.org.uk
OCR is part of Cambridge Assessment, a department of the University of
Cambridge. For staff training purposes and as part of our quality assurance
programme your call may be recorded or monitored.
© OCR 2017 Oxford Cambridge and RSA Examinations is a Company
Limited by Guarantee. Registered in England. Registered office 1 Hills
Road, Cambridge CB1 2EU. Registered company number 3484466.
OCR is an exempt charity.You can also read


