Vectorizing maps to generate geo-spatial data on territories of the Holy Roman Empire
←
→
Page content transcription
If your browser does not render page correctly, please read the page content below
R. Roller                                                                                   1/32
Geo-spatial data on HRE territories

                    Vectorizing maps to generate geo-spatial
                  data on territories of the Holy Roman Empire

                                       Ramona Roller∗

                                Chair of Systems Design,
                ETH Zurich, Weinbergstrasse 56/58, 8092 Zurich, Switzerland
                                       ∗ rroller@ethz.ch

                                           Abstract

           Geo-spatial factors were a major driving force for the European Reformation.
       Power relations between neighboring territorial states, travel routes of scholars,
       and locations of cultural exchange contributed to the spread of Protestantism.
       However, researchers cannot study these factors quantitatively because spatial
       data on territories in the 16th century does not exist. I develop a manual and
       an automatic method to extract the geo-coordinates of territories from political
       maps and enrich them with non-spatial attributes gathered from Wikipedia. The
       manual method extracts unambiguous territories and the automatic method is re-
       producible and time saving. The generated data can be used to study confessional-
       ization and other aspects of the Reformation. The methodology can be generalized
       to other geographic areas and historical periods.

                    Keywords: map vectorization, geo-spatial data, terri-
                   torial states, Holy Roman Empire, Reformation, H-GIS

1    Introduction

In the 16th century, Europe consisted of many territorial states which were governed
by princes and were loosely held together in the Holy Roman Empire (HRE). This geo-
political situation was a major driving force for the Reformation because the princes
chose the denomination for their subjects (Harrington and Walser Smith, 1997). This
choice was not only based on the personal preferences of the princes but was also
affected by geo-spatial factors, such as imbalanced power relations between the terri-
tories (Holt, 2003), whereabouts of scholars (Strauss, 1975), and locations of cultural
exchange (Strohm, 2017).
   To study the effect of these factors on the Reformation we need spatial data of the
territories. This allows us to position territories on a map, measure territorial gains and
losses, and identify neighborhood relations between territories. We can approximate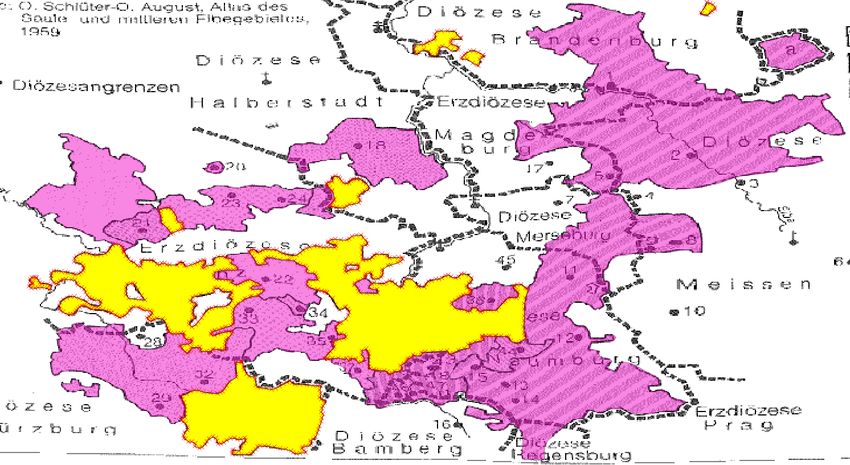
R. Roller                                                                               2/32
Geo-spatial data on HRE territories

the spread of ideas by extracting travel routes of individuals, and relate territories to
places of cultural exchange, such as university tows, as well as to geographic barriers
affecting reachability of places, such as mountain ranges and rivers. In short: spatial
data allows us to study processes in a global interconnected context rather than focus-
ing on individual territories.
    However, data on HRE territories in the 16th century is not available for spatial
analyses and scattered across multiple sources. Several modern political maps of the
HRE in the 16th century exist but are not digitized or their digitized version is not pub-
licly available (Hilgemann and Kinder, 2020; Isphording et al., 2011; Schindling and
Ziegler, 1989-1995; Westermann, 1997; Wikipedia, 2010). Publications in historical re-
search provide non-spatial information about territories in unstructured text formats
which is cumbersome to extract manually (Schindling and Ziegler, 1989-1995). This
lack of spatial data is not unique to 16th century Europe but also concerns other geo-
graphic areas and historical periods (Baeten and Lave, 2020; Levin, Kark, and Galilee,
2010; Thévenin, Schwartz, and Sapet, 2013; Zaragozí et al., 2019). What we need is a
method to construct spatial data sets from several analogue and non-spatial sources.
    In this paper, I address this gap by constructing a spatial data set of territories of
the HRE in the 16th century. This is a challenging task because the HRE was a large,
volatile, and unclear structure. In the 16th century, the HRE consisted of about 600
territories, some as small as the surrounding grounds of a monastery. Territories often
changed their borders since land was lost or won during wars. They were separated
into smaller pieces due to division of the estate, or merged into larger pieces due to
marriage. These changes are hard to pin down because they were not always recorded
precisely. Even if a territory had stable borders it is difficult to locate it in space because
territories often consisted of noncontinuous parts, the exclaves, and were perforated
with enclaves of other territories. Matters are complicated further by the fact that rela-
tions between territories were diverse making it difficult to identify truly independent
territories. For example, condominates were regions that were ruled together by sev-
eral territories. A bailwick was a conquered territory where the conqueror appointed
a bailiff to govern the territory even though that territory was not annexed. In the feu-
dal system, a weaker territory had to provide food to a stronger territory in return
for protection. Weaker dependencies such as tax relations and protectorates were also
common.
    In my data generation approach, I account for these challenges by relying on es-
tablished selections of territories that were generated by Historians and considered
relevant for the Reformation, and by tracking temporal changes in the attributes of the
territories if available. I digitize modern political maps of the HRE to locate territories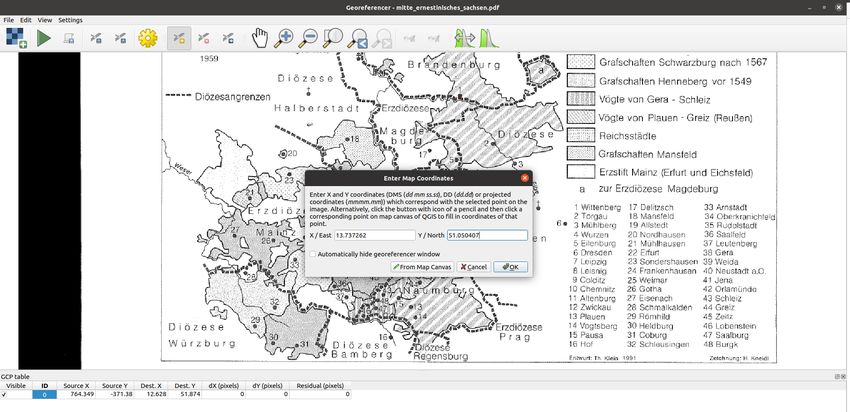
R. Roller                                                                                 3/32
Geo-spatial data on HRE territories

in space, crawl non-spatial attributes of these territories from Wikipedia, and merge
the spatial and non-spatial data. I conduct the data generation process manually and
automatically, and argue that the automatic approach should only be used if the raw
data match the historical period of interest. The final data set comprises 275 territories.
My method provides a reproducible way to generate spatial data for HRE territories
in the 16th century. The data can be enriched with other territory attributes or com-
bined with existing data sets. The method can be applied to other cases where enriched
spatial data can be extracted from maps and Wikipedia. The data and method help re-
searchers in fields of History, Digital and Computational Humanities, Geography, and
Social Science to analyse novel geo-spatial aspects of the Reformation.

2    Materials and Methods

                              Vectorization                Attributes gathering
                                Map (PDF)

                                 georeference

                               Map (geotif)                       Wikipedia

                                 polygonize                       crawl/lookup

                           Polygons (shapefile)                 Attributes (csv)
                                                         join

                                                Territories (shapefile)

Figure 1: Approach to generate a data set of vectorized territorial states of the Holy Roman
Empire during the European Reformation.

   Figure 1 summarises my approach to generate a data set of vectorized territorial
states of the Holy Roman Empire (HRE) during the European Reformation. I construct
two separate data sets of the territories: vectorized and attributes data. The vectorized
data contain the geo-coordinates of the territory borders which allows us to locate the
territories in space. The attributes data contain non-spatial attributes of the territories
such as type of rule or religion. Both data sets account for temporal changes, such as
territorial gains and losses after wars
   I construct each of these data sets with two methods, manual and automatic. By
comparing these two methods, I show that the automatically generated data are of
lesser quality because they do not cover all territories that were relevant in the 16th
century and extracted territories have ambiguous attributes.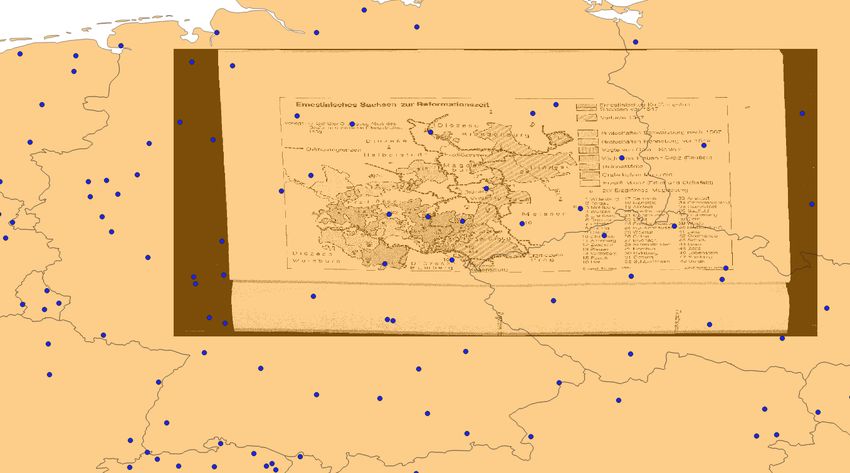
R. Roller                                                                                   4/32
Geo-spatial data on HRE territories

   Finally, I automatically merge the vectorized and attributes data to obtain a single
data set of territories including temporal spatial and non-spatial characteristics of the
territories.

2.1     Vectorizing territories

Vectorizing territories means extracting the geo-coordinates of territory borders from
political maps. These maps show the geo-political situation of the HRE during the Ref-
ormation. I use modern maps that have been created by Historians based on historical
records.

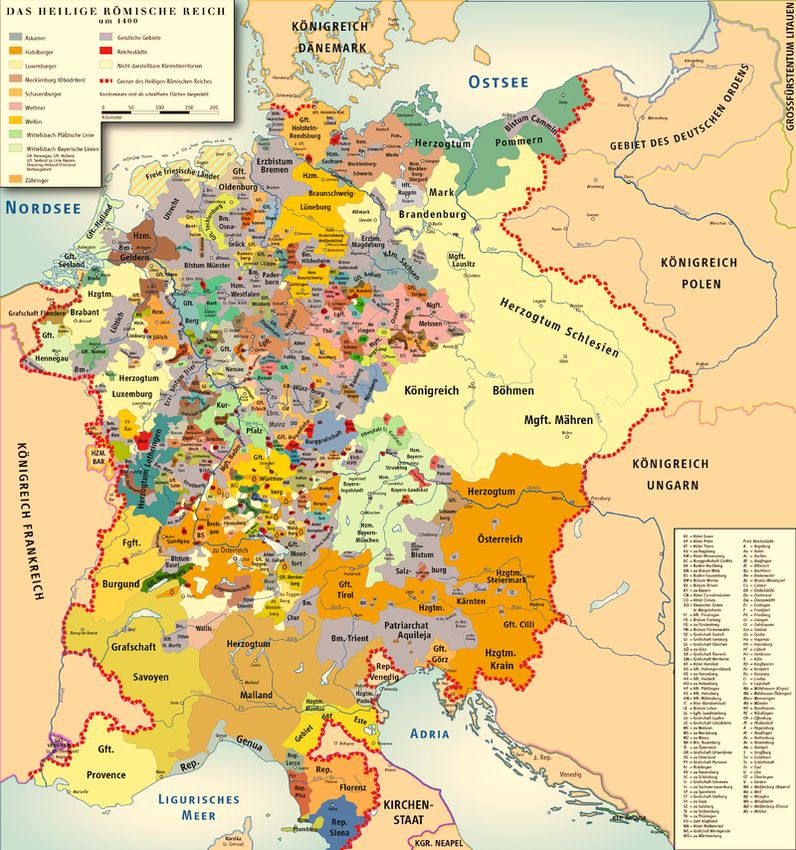
(a) Map of Saxony from Schindling and               (b) Map of HRE from Wikipedia for the
Ziegler (1989-1995) for the manual method           automatic method (Wikipedia, 2010)

                             Figure 2: Maps of the Holy Roman Empire

2.1.1    Manual: polygon tracer

Select map. I use the maps of Schindling and Ziegler (1989-1995) to extract terri-
tories, which represents an established reference work for the study of geo-political
processes during the Reformation. The authors provide a selection of about 300 ter-
ritories which played a significant role during the Reformation. Each map contains
between one and 5 territories. I scan the selected maps to obtain PDFs which I use in
the subsequent analysis. As an example, Figure 2a shows the map of Saxony.

Georeference map. Each point on a PDF-map has to be associated with a physical lo-
cation in the real world. This georeferencing process constructs an internal coordinate
system for each PDF-map which is projected onto a real-world geographic coordinate
system. I use QGIS (v. 3.16), an open-source Geographic Information System (GIS) to
R. Roller 5/32 Geo-spatial data on HRE territories run and validate georeferencing (QGIS Development Team, 2021). See Appendix A for a detailed description of georeferencing. Since I georeference several maps indepen- dently of each other small inaccuracies in georeferencing will result in overlapping polygons when the files are finally combined (see Appendix I for an example). Poligonize PDF. I use the georeferenced maps to manually trace the border of each territory with the computer mouse using the polygon tracer tool of QGIS. This yields vectorized polygons each representing a territory and being located in space (see Ap- pendix B for a detailed description of manual polygonization). For some territories, Schindling and Ziegler (1989-1995) track changes in territory borders. For example, when Ernestinian Saxony lost the Schmalkaldic War, a conflict between protestant and catholic princes, it was forced to give parts of its territory to Albertenian Saxony. I include these temporal changes by tracing several polygons for the same territory at different points in time. I ensure that I provide a unique identifier for each polygon and time point to later map them to the entries in the attributes data. The resulting poly- gons represent vectorized territories. They can be edited with GIS software, or with geo-processing libraries of programming languages, such as geopandas for python and simple features (sf) for R (Kelsey et al., 2021; Pebesma, 2018). 2.1.2 Automatic: match on raster band value Select map. In the automatic method, I use colored political maps to extract terri- tories by their color. Since the maps provided by Schindling and Ziegler (1989-1995) are black and white they cannot be used for this method. Several atlases provide col- ored political maps of the HRE in the 16th century (Hilgemann and Kinder, 2020; Isphording et al., 2011; Westermann, 1997). However, since the maps are not available as high-quality scan, which leads to several color values for the same territory rather than one, they are not suited for this method. The best available alternative is a map from Wikipedia showing the geo-political situation in the HRE around 1400 (Fig. 2) (Wikipedia, 2010). This map is of high technical quality but of lower content-related quality compared to the maps by Schindling and Ziegler (1989-1995) because the se- lection criteria for the territories are not made transparent and the captured historical period is before the Reformation. This affects the accuracy of the extracted territories, as I will show in the results. I removed legends from map wit the Open Source image processing software gimp to facilitate polygonization (GIMP, 2019). Georeference map. Like for the manual method, I georeference the map with QGIS to associate each point on the PDF-map with a physical location in the real-world (Ap-
R. Roller                                                                                                           6/32
Geo-spatial data on HRE territories

pendix A). Since all terrritories are captured in one map only one internal coordinate
system is created and extracted polygons will not overlap.

                 52.2                                                   52.2

                 52.0                                                   52.0

                 51.8                                                   51.8
      Latitude

                                                             Latitude
                 51.6                                                   51.6

                 51.4                                                   51.4

                 51.2                                                   51.2
                        12.4 12.6 12.8 13.0 13.2 13.4 13.6                     12.4 12.6 12.8 13.0 13.2 13.4 13.6
                                   Longitude                                              Longitude
                   (a) After polygonization                             (b) After internal buffering

Figure 3: Extracted polygon corresponding to parts of the Electorate of Saxony. 3a: After
polygonization, labels leave holes in the polygon. 3b: After internal buffering, the holes are
closed.

Polygonize raster bands.      Raster bands store the color of pixels as a combination
of the primary colors red, green, and blue (see Appendix C for a detailed descrip-
tion of raster bands). I group consecutive pixels of the same raster band value into
polygons with python’s GDAL library (Contributors GDAL/OGR, 2021). The resulting
polygons are defined by a sequence of geo-coordinates describing the border of the
polygon and by the raster band value. The polygons correspond to territories but also
to noise such as labels, borders, rivers, lakes, and seas. Figure 3a shows an example
of an extracted polygon. For the three raster bands I extract 611, 854 (red), 604, 621
(green), and 585, 356 (blue) polygons, respectively. These numbers differ because not
all polygons have all raster band values. For example, the blue color of water has no
red whereas the red borders and imperial cities have no blue. However, the majority
of polygons has 3 raster band values and polygons across the three raster bands are
therefore duplicated. It is important to keep these duplicates to later merge polygons
of the same territory by color. I save the polygons as shapefiles and will further pro-
cess them with python’s geoprocessing libraries shapely and geopandas (Gillies, 2007;
Kelsey et al., 2021).

Filter polygons. Filtering discards polygons that do not correspond to territories,
such as borders, rivers, lakes. Filtering reduces the computational cost of the analy-
sis because fewer polygons have to be processed in later steps. For the map at hand,
R. Roller 7/32
Geo-spatial data on HRE territories
Figure 4: Result after filtering polygons.
Ó polygons identified as territories Ó polygons identified as noise
polygons representing territories tend to be larger than those representing noise. Ex-
ceptions to this rule are seas and some lakes. Taking into account these exceptions and
an eyeballed estimate of the number of territories on the map, I select 1,000 polygons
with the largest surface areas and discard the rest. Figure 4 shows the kept and dis-
carded polygons on a map. I removed the North Sea polygon manually because I had
created it myself to hide the original legend making it easy to identify.
Buffer polygons internally. Since the labels on the map are printed inside of terri-
tories and are extracted as polygons, the territory-polygons contain holes that have to
be filled. First, I close holes in the polygon border by dilating the border by a small
distance and then eroding it by the same distance. Second, I close holes in the interior
of the polygon by reducing the polygon to its exterior border. Figure 3 compares an
extracted polygon before and after internal buffering.
Overlay polygons. I overlay the red, green, and blue version of each polygon from
the three raster bands to match a polygon to its original color on the map. This re-
sults in one shapefile of polygons where each polygon is described by a sequence of
geo-coordinates corresponding to the border, and three color values corresponding to
the primary colors. (see Appendix D for details on the overlaying step). Since poly-
gons corresponding to seas and lakes do not have red raster band values they are not
matched and filtered out.R. Roller 8/32
Geo-spatial data on HRE territories
Fill space between polygons. If a territory is crossed by a river or covered by a label
it is split into several polygons. To relate these territory polygons back to each other the
space created by the crossing polygons has to be closed so that the territory polygons
become neighbors. I close this space by dilating the polygon borders by a small factor
and subsequently erode the borders by the same factor. This step creates overlaps be-
tween some polygons which result in a few ambiguous polygon-entry mappings whose
consequences are evaluated in the spatial join.
Duchy of
Braunschweig-Lüneburg
Electorate of Saxony
Archbishopric of
Trier
County of
Württemberg
Archduchy of
Austria
Figure 5: Selection of territories with their merged constituent polygons. On the original
map, Austria is split into separate territories such as County of Tirol and Duchy of Krain.
Since these territories all have the same face color on the original map the algorithm inter-
prets them as constituent polygons of one territory.
Merge polygons. Merging completes the previous step and combines polygons that
belong to the same territory. I merge two polygons if they have the same color and
share a border. Figure 5 shows examples of territories whose constituent polygons were
merged.This results in a shapefile of polygons where each polygon corresponds to a
territory and is defined by the geo-coordinates of its border and the tree raster band
values.
2.2 Gathering non-spatial attributes of territories
To enrich the spatial information on polygons in the vectorized data I gather non-
spatial attributes of the polygons from Wikipedia, such as name, religion, and type of
rule. Appendix E provides a description of all selected attributes. I chose WikipediaR. Roller 9/32 Geo-spatial data on HRE territories as data source because it is open source, provides digitized data and covers many rel- evant territories from the 16th century. I chose attributes that allow me to address questions about confessionalization during the Reformation, which I will address in future work. The data could of course be enriched with other attributes customized for other applications. 2.2.1 Manual: Wikipedia lookup I select all territories that are covered in Schindling and Ziegler (1989-1995) and look up information on attributes on their Wikipedia pages (Appendix E.1). When Wikipedia did not provide data on these attributes I checked the territory-specific texts in Schindling and Ziegler (1989-1995). If information was still not available after this step, I marked it as missing value. Since territories changed over time my unit of analy- sis is the state of a territory during a specific period. For example, if a territory became Lutheran in 1540 two version of the territory are included in the data one before and one after 1540. The manual Wikipedia lookup resulted in 558 unique temporal states of 303 territories. 2.2.2 Automated: Wikipedia crawl Select territories. Wikipedia provides a list of 806 territories that have existed in the HRE at some point during its 1,000 years reign (Wikipedia, 2021). I use this list as a starting point and later filter out territories that have existed in the 16th century. I use the German version of Wikipedia pages because they are more detailed than the English version. I use the python package wptools to access the Wikipedia page as html (Siznax, 2018), and the package Beatifulsoup to parse its content (Richardson, 2007). From the list I can extract the name of the territory, the type of rule, and the country the territory is part of today. Since Wikipedia does not provided temporal information in a structured way I gather static attributes of territories. My unit of analysis therefore is a territory rather than a state of a territory during a certain period as was the case in the manual method. I use this crawled list of territories to access the Wikipedia pages of the individual territories and crawl information from them in a fully-structured and a semi-structured way. Access attributes (fully structured). The fully-structured method accesses the Wikidata page of the Wikipedia page. Wikidata is the official database behind Wikipedia and is fully structured because it uses the same structural format for all its data. I use the wikidata-API to crawl attributes of each territory (Wikidata Team, 2021). See Appendix E.2 for a detailed description of all attributes. For example, the
R. Roller                                                                        10/32
Geo-spatial data on HRE territories

dates of inception and dissolution will be used to select territories that have existed
during the 16th century, and the geo-location will be used to merge territories in the
vectorized and attributes data. The fully-structured crawl resulted in 127 territories
for the 16th century.

Access attributes (semi structured). Since Wikidata is not a rich data source for
territories yet, I turn to another source of attributes and crawl the infoboxes of the
Wikipedia pages (see Appendix F for an example of an infobox). These infoboxes seem
promising because they provide structured information about the page’s topic and in
the case of territories in the HRE, are subject to a standardized format. However, edi-
tors are not forced to follow this standard, as is the case on Wikidata, and can there-
fore add, remove, or change keys. Thus, infoboxes are semi structured. For example,
the possible keys to access the dates of inception are “Periode” (period), “Vorläufer”
(predecessor), “Entstanden aus” (arisen from), and “Entstehungszeit” (period of for-
mation). I checked the infoboxes of several Wikipedia pages of territories to get rele-
vant keys for my attributes of interest, which are the same as for the fully-structured
method. The semi-structured crawl resulted in 806 territories for the complete lifetime
of the HRE. Filtering for the 16th century discraded all territories. Appendix G com-
pares the manual, fully- and semi-structured extraction methods along the number of
missing values across attributes.

2.3   Merging vectorized and attributes data

To combine the vectorized and the attributes data sets polygons have to be mapped
to the correct territory name. The reliable method is to use the same identifiers in the
vectorized and attributes data and merge the data sets on them. This method ensures
that each polygon is uniquely mapped to one Wikipedia entry but it is time consum-
ing because the identifiers have to be provided manually. I use this method for the
manually assembled data.
   The alterantive, time-saving method is a spatial join. This method merges a polygon
and an entry in the attributes data if the geo-location of the entry is located inside
that polygon. However, the spatial join causes ambiguous mappings for the manually
assembled data because polygons overlap and one point location is mapped to several
polygons. I use the spatial join for the automatically assembled data.
R. Roller                                                                                 11/32
Geo-spatial data on HRE territories

3    Results

The manual and fully-structured methods extracted 275, and 67 territories of the 16th
century, respectively. The semi structured method did not yield any territories for the
16th century but 63 territories for the full lifetime of the HRE.

                    Table 1: Descriptive statistics of manual and automatic data

                                      Manual∗                        Automatic
                                                        Fully structured∗   Semi structured†
# Wikipedia entries∗                  303               127                 117
# Polygons                            272               487                 487
# Territories                         275               67                  63
after mapping,
restrict to one-to-one mappings
Period of existence                   mean: 433.34      mean: 609.76
lifetime of territory in years        SD: 236.85        SD: 221.10          -
                                      median: 441       median: 623
Confessional stability                mean: 146.43
Number of years for which territory   SD: 107.54        -                   -
retains a denomination after 1517     median: 129
Timing of confessional switch         mean: 1549
Year in which territory               SD: 26            -                   -
became Protestant                     median: 1541
Power status                          mode: 2           mode: 2             mode: 2
Types of rule are ranked              range: 1-15       range:1-15          range: 1-15
1: large power, 15: small power
Surface area                          mean: 3316.94     mean: 7136.65       mean: 8518.53
in km2                                SD: 6575.05       SD: 22754.47        SD: 27017.29
crs: ESRI:54012                       median: 911.83    median: 2025.12     median: 1189.08
# Territories in alliances            S: 40
S: Schmalkaldic League                C: 8              -                   -
C: Catholic League                    N: 228
N: no alliance

The unit of analysis is a territory for all methods.
∗ One-to-one mapping and 16th century.
† One-to-one mappings and complete HRE period (800-1806).

#: Number of
SD: standard deviation

   Table 1 shows descriptive statistics for the manual and automatic methods. Within
methods, we see that the standard deviations for all measures are large showing that
territories vary a lot, and a typical territory does not exist. Between methods, we see
R. Roller 12/32
Geo-spatial data on HRE territories
that only the power status yields similar results. The most common type of rule is an
imperial territory (rank 2), such as an imperial county or an imperial city (see Ap-
pendix H for a complete ranking of types of rule), and all data sets include the most
and the least powerful territories: electorate (rank 1) and city (rank 15), respectively.
Since the manual data are temporal whereas the automatic data are static, temporal
statistics can be computed only for the manual data. Of interest is that territories
tended to become Protestant in 1541, a rather long time before the Peace of Augs-
burg in 1555, where princes were officially entitled to choose the denomination for
their subjects.
Pommern
Kurbrandenburg
Holland
ernestinisches Sachsen (bis 1547) Magdeburg
Sachsen
Köln Hessen LüttichKöln Hessen-Marburg
Kurmainz Ratibor
Kurpfalz
Baden
Rottweil Straßburg
Österreich
Brixen (Hochstift)
(a) Manual method (b) Automatic fully-structured method
Figure 6: Coverage for manual and automatic fully-structured method. Colored polygons
correspond to extracted territories. They are unambiguously mapped to one Wikipedia entry.
In (a), temporal states of territories are aggregated over time.
3.1 Evaluate manual and automatic methods
Coverage. Coverage measure to what extent an extraction method yields relevant
territories, and whether these territories cover a large geographic area of the HRE. For
this analysis, relevant territories are those that had existed during the 16th century.
Figure 6 shows the extracted 16th century territories from the manual and automatic
fully-structured method. We see that the manual method yields more territories which
cover a larger geographic area compared to the automatic method. This shows that
many polygons on the original map used in the automatic method lack information
on geolocation, and that Wikidata entries lack information on dates of inception and
dissolution. We also see that the two maps in Figure 6 depict different territories for
the same geographic area, such as a united Duchy of Silesia (Schlesien) for the auto-
matic method and a divided one in the manual method. This indicates a mismatch in
historical periods of the original maps. Whereas original maps for the manual method
show the geo-political situation in the 16th century, the original map for the auto-R. Roller 13/32 Geo-spatial data on HRE territories matic method shows the situation around 1400. Although the manual method yields a better coverage than the automatic fully structured method it still lacks territories as the many white spots especially in the South-West of the HRE show. This is because Schindling and Ziegler (1989-1995) did not cover these territories. (a) Fully structured (b) Fully structured 16th century + ambiguous mapping 16th century filter + corrected mapping (c) Semi structured (d) Semi structured complete HRE period + ambiguous mapping complete HRE period + corrected mapping Figure 7: Coverage for manual and automatic fully structured method. Colored polygons cor- respond to extracted polygons. Colored points correspond to Wikipedia entries mapping to the extracted polygons (one-to-one and one-to-many mappings). Black diamonds correspond to Wikipedia entries that map to several polygons (many-to-one mapping). Since the semi structured method did not yield territories for the 16th century results are shown without temporal restrictions for that method. Mapping. Mapping assesses to what extent polygons unambiguously correspond to Wikipedia entries. A perfect mapping is one-to-one because one polygon is uniquely mapped to one Wikipedia entry and vice versa. The manual method results in a one- to-one mapping because I used manually engineered identifiers. In contrast, the au-
R. Roller                                                                          14/32
Geo-spatial data on HRE territories

tomatic method results in ambiguous mappings depicted in Fig. 7. Several points of
the same color in one polygon indicate one-to-many mappings where one polygon
is mapped to several Wikipedia entries. Diamonds in locations where two polygons
overlap indicate many-to-one mappings where many polygons are mapped to one
Wikipedia entry. Figures 7a and 7c show the ambiguous mappings for the fully and
semi structured methods respectively. We see that one-to-many mappings occur much
more often than many-to-one mappings. I resolved ambiguous mappings by selecting
unique polygon-entry mappings at random from the available ones. Figures 7b and 7d
show the result of the mapping corrections. We see that the same polygon is mapped
to different territories in the two methods, as the different point locations in the same
polygon show. Both may even be incorrect because the choice of the unique mapping
was random. One-to-many mappings result from a mismatch in historical periods be-
tween the selected entries on Wikipedia and the original map, like in the case of cov-
erage. Many-to-one mappings result from the vectorization of polygons where a buffer
function was applied to fill gaps between polygons. Although the current polygon-to-
Wikipedia entry mapping is better in the manual data than in the automatic one, the
manual data is likely to cause ambiguous mappings in future applications. For exam-
ple, if we would like to assign locations of individuals on their travel routes to terri-
tories the manual data will result in many-to-one mappings because polygons overlap
due to small inaccuracies in georeferencing of individual maps (see Appendix I for an
example).
   The above results show that the manual method yields a data set of higher, yet not
optimal, quality than the semi-automated method. I will therefore use the manually
constructed data to further explore territories in this paper.

3.2   Descriptive statistics of manually assembled data

To explore the manually assembled territories I discuss visualizations and descriptive
statistics on selected attributes of the data. Figure 8a shows the number of extracted
territories that existed at different points in time in the 16th century. We see that the
number ranges between 228 and 246 and that most territories existed in the middle
of the 16th century. This is because Schindling and Ziegler (1989-1995) concentrated
on territories that drove the confessionalization in the HRE which gained momentum
around 1555 when princes were allowed to choose the denomination of their subjects
(Peace of Augsburg).
   Figure 8b shows the number of extracted territories that had existed for a certain
number of years. We see that most territories have a lifetime of 400 to 600 years. Given
that the political system had been stable for such long periods the importance of the
R. Roller 15/32
Geo-spatial data on HRE territories
25
255
Start of
Eighty Years' War
Peace of
Augsburg
20
Marburg Kurpfalz
250 Colloquy
Schmalkaldic ern. Sachsen
Number of territories
Anhalt-Plötzkau (after 1547)
Number of territories
War 15
Luther posts Peasant Wars
245 theses
Imperial Diet 10
in Worms Spanish Armada
240 Edict of Nates St. Gallen
5
235 0
1500 1510 1520 1530 1540 1550 1560 1570 1580 1590 1600 0 100 200 300 400 500 600 700 800 900 1000 1100
Time Period of existence [years]
(a) Number of territories over time (b) Lifetime of territories
50
40
Number of territories
30
20
10
0
zu vorderösterreich
reichsunmittelbarkeit
gemeine herrschaft
archduchy
county of the empire
free city
free imperial city
french
french city
kanton
lordship
margraviate
bailiwick
bailiwick, zugewandter ort
bishopric
city
city, zugewandter ort
county
county, zugewandter ort
duchy
electorate
imperial castle
imperial city
imperial city, zugewandter ort
imperial county
imperial knights
kingdom
landgraviate
principality
principality, zugewandter ort
titular duchy
vest
zugewandter ort
Type of rule
(c) Number of territories per type of rule across 10 years sliding window
Figure 8: Frequency of territories along selected attributes
Reformation as transformative movement gains additional weight.
Figure 8c shows the average number of territories per type of rule over a 10 years
sliding window. We see that the distributions for all types of rule are narrow indicat-
ing that the territories in the data stuck to one type of rule in the 16th century. Note
that the types of rule were no standardized titles but fuzzy categories with ambiguous
modern interpretations. For example, many Wikipedia entries mix up imperial and
free cities. Whereas the imperial city was only subordinate to the Emperor the free
city was subordinate to a territorial prince but had extensive rights and privileges.
As a consequence, the crisp categorization into different types of rule and Wikipedia
entries on HRE territories have to be used carefully.
Figure 9 shows the adoption of Protestantism across space and time. We see that
territories in the North-East of the HRE adopted Protestantism first and territories in
the South-West did so later. Whether these two regions acted independently of each
other or whether neighborhood effects played a role for the spread of Protestantism
can be analyzed with this data set in future studies. As with the type of rule of a
territory, its religion is also a fuzzy concept. Although the princes decided over the
denomination of their subjects the subjects did not always obey the official laws. AR. Roller 16/32
Geo-spatial data on HRE territories
prince indifferent to religious matters may have let his subjects do as they like without
interfering in their religious practices even if they differed from the official law. A weak
prince may have adopted a certain denomination because his subjects pressured him
to do so. So the official adoption of a new denomination happened after the adoption
in the general population. Under a strong prince subjects may have practiced their
denomination in secret if it did not match the official one. And even if subjects obeyed
to the official denomination their implementation of that denomination in daily life
may still have differed. So Lutheranism in territory A is not comparable to Lutheranism
in territory B. These nuances should be taken into account when crisp categorizations
of denominations are further interpreted.
1500 - 1519 1520 - 1529 1530 - 1539
1540 - 1549 1550 - 1559 1560 - 1569
1570 - 1579 1580 - 1589 1590 - 1599
Figure 9: Adopted denomination of territories across time
Ó protestant Ó catholic Ó mixed
Ó Ó Territories switched their state during the examined period and are therefore plotted on
top of each other. A change of state can be due to (1) territories changing their denomination
within Protestantism (e.g., Bohemia), (2) territories uniting with other territories into larger
ones (e.g. Liegnitz-Brieg and Wohlgau are united), or (3) territories splitting into smaller
territories (e.g., Pommern splits into Pommern-Stettin and Pommern-Wohlgast).R. Roller 17/32 Geo-spatial data on HRE territories 4 Discussion I have presented two methods to compile a spatial data set of territories of the Holy Roman Empire in the 16th century. This data set is useful to study geographic and geo-political aspects of the Reformation. With the manual method, I manually traced the border of territories on modern political maps and combined the resulting polygons with attributes I had manually looked up on Wikipedia. In the use case of this paper, the manual method provided temporal data because I considered changes in territories’ attributes. The manual method also optimized for the choice of the examined historical period because maps with Reformation-relevant territories were available. With the automatic method, I ex- tracted polygons of the territories from their color values on a modern political map and used a spatial join to combine those polygons with attributes I had crawled from Wikipedia. The automatic method is reproducible and time saving. Both methods are flexible since they can be enriched with all sorts of territory attributes or geo-spatial information. By constructing exemplary statistical measures and visualization, I provided a glimpse of how the generated data could be used for quantitative analyses of the Reformation. Confessionalization, the spread and insitutionalization of Protestantism, could be studied through neighborhood and power relations between territories. Mo- bility in the 16th century could be studied through travel routes of scholars which could be mapped to the territories they traverse. Reachability of territories could be studied by locating geographic landmarks, like rivers and mountain ranges, in the ter- ritories to investigate the ease of dissemination of information. Both, the manual and automatic methods have limitations which affect the condi- tions under which they should be used. The manual method is time consuming be- cause polygons have to be traced manually. This also reduces the reproducibility of the method. Since the manual method used several maps, georeferencing results in differ- ent projected geo-coordinate systems which cause the resulting polygons to overlap. This will lead to ambiguous mappings if we want to locate specific places inside of ter- ritories, such as whereabouts of individuals. In the use case of this paper, the automatic method faced a mismatch in historical periods because the original map depicted the HRE around 1400 whereas the resulting territories were filtered for the 16th century. As a result, the polygons did not correspond well to the territory names extracted from Wikipedia. Although many HRE territories are covered on Wikipedia the amount of available structured data is small and the resulting data set is not as rich as the manual one. These limitations provide some guidelines for future usage and improvements of
R. Roller                                                                           18/32
Geo-spatial data on HRE territories

the presented methods. Both methods yield optimal results if polygons are extracted
from one rather than several maps and if the original map depicts the historical pe-
riod of interest. The manual method should be used if a small number of territories is
processed and only low-quality maps are available, such as historical maps with het-
erogenous color values per polygon. The automatic method should be used if a large
number of territories is processed and a high-quality colored political map is avail-
able. If Wikipedia is used as a source, the automatic method should be used if static
data is sufficient because Wikipedia does not yet provide temporal data in a structured
format. However, the coverage and quality of Wikipedia data or other data sources is
likely to improve in the future, making the restriction to static data for the automatic
method no longer necessary.
    The presented methods are not restricted to the use case of 16th century territories
but can be applied to other geographic areas and historical periods. For example Eu-
ropean colonization of Africa could be studied in terms of changes of territory borders
that were constructed on drawing boards (Bassett, 1994; Lefebvre, 2011).
    In summary, I presented a methodology to generate spatial data of territories from
political maps. The methodology is reproducible because many steps are automatized.
The methodology is flexible because the generated data can be enriched with all sorts
of territory-specific attributes. The methodology is generalizable because it can be ap-
plied to territories of other geographic areas and historical periods. In the use case of
this paper, the spatial data of 16th century HRE territories will help to investigate the
geo-spatial aspects of the Reformation.

Disclosure statement

The author is not aware of any affiliations, memberships, funding, or financial holdings
that might be perceived as affecting the objectivity of this article.

Data availability statement

The data generated with the methodology of this paper are available in the ETH Re-
search Collection (Roller, 2021b,c). The associated source code is available in the ETH
Data Archive (Roller, 2021a).

References
Baeten, J. and Lave, R., 2020. Retracing Rivers and drawing swamps: Using a drawing tablet
   to reconstruct an historical hydroscape from army corps survey maps. Historical Methods
R. Roller 19/32 Geo-spatial data on HRE territories [Online], 53(3), pp.182–198. Available from: https://doi.org/10.1080/01615440.2020. 1748151. Bassett, T.J., 1994. Cartography and empire building in nineteenth-century West Africa. Geo- graphical Review [Online], 84(3), pp.316–335. Available from: https://doi.org/10.2307/ 215456. Contributors GDAL/OGR, 2021. GDAL/OGR Geospatial Data Abstraction software Library [On- line]. Open Source Geospatial Foundation. Available from: https://gdal.org. Gillies, S., 2007. Shapely: manipulation and analysis of geometric objects [Online]. toblerity.org. Available from: https://github.com/Toblerity/Shapely. GIMP, 2019 [Online]. The GIMP Development Team. Available from: https://www.gimp.org. Harrington, J.F.. and Walser Smith, H., 1997. Confessionalization , Community , and State Building in Germany , 1555-1870. The Journal of Modern History [Online], 69(1), pp.77– 101. Available from: https://www.jstor.org/stable/2953433. Hilgemann, W. and Kinder, H., 2020. Zeitalter der Glaubensspaltung. dtv-Atlas Weltgeschichte Band 1: Von den Anfängen bis zur Französischen Revolution. dtv. Holt, M.P., 2003. The Social History of the Reformation : Recent Trends and Future Agendas. Journal of Social History [Online], 37(1), pp.133–144. Available from: https://www.jstor. org/stable/3790318. Isphording, B., Böttcher, C., Grube, J., Clauss, M., Ackermann, M., Kasper, R., Betker, R., Bruck- müller, E., and Hartmann, P.C., 2011. Mitteleuropa im Zeitalter der Reformation (um 1547). Putzger - Historischer Weltatlas. Cornelsen Verlag, p.120. Kelsey, J., Van den Bossche, J., Fleischmann, M., McBride, J., Wasserman, J., Gerard, J., Garcia Badaracco, A., Snow, A.D., Tratner, J., Perry, M., Farmer, C., Arne Hjelle, G., Cochran, M., Gillies, S., Culbertson, L., Bartos, M., Eubank, N., Rey, S., Caria, G., Albert, M., Bilogur, A., Ren, C., Arribas-Bel, D., Wasser, L., Shanan, S., Wolf, L.J., Journois, M., Wilson, J., and Greenhall, A., 2021. Geopandas [Online]. Available from: https : / / doi . org / 10 . 5281 / zenodo.4464949. Lefebvre, C., 2011. We have tailored Africa: French colonialism and the ’artificiality’ of Africa’s borders in the interwar period. Journal of Historical Geography [Online], 37(2), pp.191–202. Available from: https://doi.org/10.1016/j.jhg.2010.11.004. Levin, N., Kark, R., and Galilee, E., 2010. Maps and the settlement of southern Palestine, 1799- 1948: an historical/GIS analysis. Journal of Historical Geography [Online], 36(1), pp.1–18. Available from: https://doi.org/10.1016/j.jhg.2009.04.001. Natural Earth, 2021 [Online]. Available from: https : / / www . naturalearthdata . com/ [Ac- cessed December 1, 2020]. Pebesma, E., 2018. Simple Features for R: Standardized Support for Spatial Vector Data. The R Journal [Online], 10(1), pp.439–446. Available from: https://doi.org/10.32614/RJ- 2018-009.
R. Roller                                                                                    20/32
Geo-spatial data on HRE territories

QGIS Development Team, 2021. QGIS Geographic Information System. Open Source Geospatial
  Foundation Project [Online]. Available from: http://qgis.osgeo.org.
Richardson, L., 2007. Beautiful soup documentation.
Roller, R., 2021a. MapVectoriser [Online]. ETH Zurich. Available from: https://doi.org/10.
   5905/ethz-1007-362.
Roller, R., 2021b. Spatio-temporal data on territories of the Holy Roman Empire: Manually extracted
   [Online]. Zurich: ETH Zurich, Chair of Systems Design. Available from: https://doi.org/
   10.3929/ethz-b-000472583.
Roller, R., 2021c. Static spatial data on territories of the Holy Roman Empire: Automatically ex-
   tracted [Online]. Zurich: ETH Zurich, Chair of Systems Design. Available from: https :
   //doi.org/10.3929/ethz-b-000472585.
Schindling, A. and Ziegler, W., eds, 1989-1995. Die Territorien des Reichs im Zeitalter der Refor-
   mation und Konfessionalisierung: Land und Konfession 1500-1650, Bände 1-5 (Südosten, Nor-
   dosten, Nordwesten, Mittleres Deutschland, Südwesten). Münster: Aschendorff.
Siznax, S., 2018. Wptools [Online]. Available from: https://pypi.org/project/wptools/.
Strauss, G., 1975. Success and Failure in the German Reformation. Past & Present, 67(67),
   pp.30–63.
Strohm, C., 2017. Theologenbriefwechsel im Südwesten des Reichs in der Frühen Neuzeit
   (15501620). Zur Relevanz eines Forschungsvorhabens. [Online]. Heidelberg: De Gruyter Old-
   enbourg, pp.34–36. Available from: https://doi.org/10.1515/hzhz-2019-1267.
Structure of the Holy Roman Empire, n.d. [Online]. Available from: http : / / www .
   holyromanempireassociation.com/structure-of-the-holy-roman-empire.html [Ac-
   cessed December 1, 2020].
Thévenin, T., Schwartz, R., and Sapet, L., 2013. Mapping the distortions in time and space: The
  French railway network 1830-1930. Historical Methods [Online], 46(3), pp.134–143. Avail-
  able from: https://doi.org/10.1080/01615440.2013.803409.
Das Zeitalter der Entdeckungen und Glaubenskämpfe, 1997. In: Westermann, ed. Grosser Atlas
  zur Weltgeschichte. Erweiterte Ausgabe des Standardwerkes von 1956. 10th ed. Braunschweig:
  Georg Westermann Verlag, pp.93–105.
Wikidata Team, 2021. Wikidata API for Python [Online]. Available from: https://pypi.org/
  project/Wikidata/.
Wikipedia, 2010. Karte der Territorien im Heiligen Römischen Reich um 1400 [Online]. Available
  from: https://de.wikipedia.org/wiki/Liste_der_Territorien_im_Heiligen_R%7B%
  5C%22%7Bo%7D%7Dmischen_Reich#/media/Datei:HRR_1400.png [Accessed December 1,
  2020].
Wikipedia, 2021. Liste der Territorien im Heiligen Römischen Reich [Online]. Available from:
  https://de.wikipedia.org/wiki/Liste_der_Territorien_im_Heiligen_R%7B%5C%22%
  7Bo%7D%7Dmischen_Reich [Accessed December 1, 2020].
R. Roller                                                                              21/32
Geo-spatial data on HRE territories

Zaragozí, B., Giménez-Font, P., Belda-Antolí, A., and Ramón-Morte, A., 2019. A graph-based
   analysis for generating geographical context from a historical cadastre in Spain (17th and
   18th centuries). Historical Methods [Online], 52(4), pp.228–243. Available from: https://
   doi.org/10.1080/01615440.2019.1590269.
R. Roller 22/32
Geo-spatial data on HRE territories
A Georeferencing
Georeferencing projects an internal coordinate system of a raster map onto a geo-
graphic coordinate system. This is achieved by locating points on the raster map for
which geo-coordinates are available. If a sufficient number of these points are provided
and evenly spaced across the map an internal coordinate system can be computed.
Georeferencing in QGIS is done via the Georeferencer GDAL plugin. To enable this
plugin, select Plugins Manage and Install Plugins and enable the Georeferencer
GDAL plugin in the Installed tab.
I upload a PDF raster map to the georeferencer and select the following transfor-
mation settings.
• Transformation type: Thin Plate Spline
• Resampling method: Nearest neighbour
• Target SRS: EPSG:4326 - WGS 84
• Output raster: file name of georeferenced map + file type (geotif =.tif)
• Save GCP points: ticked (allows to modify the internal coordinate system of geo-
referenced maps)
• Load in QGIS when done: ticked (loads georeferenced map in QGIS where it can
be validated)
Per map, I look up the geocoordinates of around 20 locations, mark them on the map
and provide the longitudes and latitudes (Fig. 10). For most locations I use the towns
that are drawn on the map, and for some locations I use geographic landmarks like
river bends or coastlines. After having marked 20 locations I add additional locations
until the residuals of the individual locations are reduced (Fig. ??). The smaller the
residuals the more accurate the georeferencing. Once georeferencing is complete I val-
idate the result by overlaying the georeferenced map with the countries and cities maps
from the Open Source Natural Earth data set (Natural Earth, 2021) (Fig. ??). If my geo-
referenced cities are in the same locations as those in the validation set georeferencing
was successful and I use the georeferenced map for polygonization..R. Roller 23/32
Geo-spatial data on HRE territories
Figure 10: Georeferencing the map of Ernestinian Saxony. Geocoordinates of Dresden are
added with the georeferencer tool in QGIS. The geocoordinates of Wittenberg have already
been added.
Figure 11: Residuals of two geo-coordinades provided during georeferencing
Figure 12: Validate georeferencing result with country and ciy map of Earth Natural lowersR. Roller 24/32
Geo-spatial data on HRE territories
B Manual polygonization
Polygonization extracts shapes from maps with their geocoordinates. I upload my geo-
referenced map into QGIS and add an additional shapefile layer to the project. For
this layer, I select polygon as geometry type and add id_name as attribute field. This
id_name will later be used to merge polygons with the Wikipedia entries into terri-
tories. I activate the new shapefile layer, enable editing, and add a polygon feature
by tracing the border of the polygon on the map with the mouse cursor (Fig. 13a).
Once the polygon is saved I provide an id_name (Fig. 13b). To avoid intersections and
small gaps between polygons I tune the snapping options by selecting Project Snap-
ping Options Advanced Layer configuration Avoid intersection + enable items
on previous layer (Enable snapping on intersection) + 10 pixels. I screen the gener-
ated polygons for invalid shapes with QGIS’ validation function: Processing Tools
Vector geometry click validate. I export the resulting polygons as a shapefile.
(a) Polygon tracer in progress (b) Final polygon after tracing
Figure 13: QGIS polygon tracer
C Raster bands
The original and georeferenced PDF-maps consist of pixels which store color values
and are arranged in a grid, the raster. The color of a pixel is a mixture of the three
primary colors red, green, and blue. Values of each primary color are stored in a sep-
arate grid, the raster band, and raster bands are layed ontop of each other to yield the
color value of the pixel (Fig. 14). For example, if a pixel appears green on the map, its
corresponding value in the green raster band is high whereas the values in the red and
blue raster bands are small. Pixels of the same color have the same raster band values.R. Roller 25/32
Geo-spatial data on HRE territories
Figure 14: Raster bands layed ontop of each other define an image.
D Overlay polygons of different raster bands
Figure 15 shows the polygons that are kept and discarded during the overlaying step,
where polygons of the three raster bands are matched.
(a) Kept polygons (b) Discarded polygons
Figure 15: Extracted polygons after overlaying polygons of the three raster bands. 15a shows
the polygons that could be mapped to all three raster bands in color and those that could not
in white. 15b shows that the unmapped polygons are mainly seas and lakes. These polygons
are blue and therefore do not have values in the red raster band and hence no corresponding
red polygons. The arrangement of sea polygons into concentric ellipses captures the color
style of the seas on the map where areas of dark blue fade out into lighter ones (banding).
E Attributes from Wikipedia
E.1 Manual
id_name Unique name of the territory during a particular historical period. Used to
map Wikipedia entries to polygons. For example, ernestinian Saxony (after 1547).R. Roller 26/32 Geo-spatial data on HRE territories territory_name Name of territory independent of historical period. For example, although ernestinian Saxony changed its territory and type of rule over time, all its instances are called ernestinian Saxony. territory_start Founding year of the territory. This is equivalent to the earlier of the start dates of secular and ecclesiastical rule. territory_end Year when the territory ceased to exist. This is equivalent to the later of the end dates of secular and ecclesiastical rule. territory_secular_rule Type of secular rule in the territory. For example, margravi- ate or duchy. territory_start_secular_rule Year when the territory adopted a particular type of secular rule. territory_end_secular_rule Year when a particular type of secular rule ended in the territory. territory_ecclesiastical_rule Type of eclesiastical rule in the territory. For example, archbishopric or abbey. territory_start_ecclesiastical_rule Year when the territory adopted a particular type of ecclesiastical rule. territory_end_ecclesiastical_rule Year when a particular type of ecclesiastical rule ended in the territory. territory_religion Official denomination of the territory. For example, Lutheran or catholic. territory_start_religion Year when the territory adopted a particular denomina- tion. territory_end_religion Year when a particular denomination ended in the territory. alliances Whether the territory was part of the Schmalkaldic League (SL), an al- liances of protestant princes, or part of the Catholic League (CL), and alliances of princes who were loyal to the Emperor. start_alliance Year in which territory joined alliance. capital_name Name of the territory’s capital. For example, Dresden for ernestinian Saxony after 1647. capital_lat_long Latitude and longitude of the capital in decimal degrees.
R. Roller                                                                          27/32
Geo-spatial data on HRE territories

book Volume of Schindling and Ziegler (1989-1995) where the map of this territory
was taken from. The book series covers five regions of the Holy Roman Empire, one per
book: SW: Südwesten (southwest), SO: Südosten (southeast), MD: Mittleres Deutsch-
land (central Germany), NO: Nordosten (northeast), and NW: Nordwestem (north-
west). If book is given but id_name is empty, the territory is covered by Schindling and
Ziegler (1989-1995) but not included because its geometry is too complicated. This is
the case for the Imperial knights in the siuthwest of the HRE. If book is empty but ter-
ritory_name is given, the territory is covered on Wikiedpia but not by Schindling and
Ziegler (1989-1995). For example, the margraviate of Baden-Hachberg or the county
of Reuss. These territories were discovered during the research and considered to be
important. It can be used for other analyses that do not require a geometry.
region Bookchapter in Schindling and Ziegler (1989-1995) where the map of this
territory was taken from. For example, Kurpfalz (Electoral Palatinate) and ernestinis-
ches sachsen (ernestinian Saxony).
source URL to the website where information on the territory was found. Mostly
Wikipedia.
table_on_wikipedia            Whether or not the Wikipedia page of this territory has an
infobox.

E.2 Automatic

E.2.1 Fully-structured crawl

old_name    Name of territory together with its type of rule or an indication to a
specific Wikipedia page. For example, “Überlingen#Freie Reichsstadt” or “Wissem-
bourg#Geschichte”.
modern_name           Name of territory.
type_of_rule Type of secular or ecclesiastical rule in the territory. For example, mar-
graviate or bishopric.
modern_country Country the territory is part of today. For example, “Germany” for
ernestinian Saxony.
wikipage        Identifier of the territory’s Wikipedia page used by wptools (Siznax,
2018).
wikibase       Unique key to access the Wikidata page of the territory.
description       Short summary of the territory’s history.
R. Roller                                                                          28/32
Geo-spatial data on HRE territories

instance_of Higher-order category on Wikidata the territory belongs to. Often this
attribute refers to the modern state of the territory. For example, the previous imperial
city Buchau is today called Bad Buchau, because of its thermal springs and rehabilita-
tion facilities. Buchau is an instance of a “spa town”.
inception       Founding year of the territory.
dissolved       Year when the territory ceased to exist.
religion      Official denomination of the territory. For example, Lutheran or catholic.
geoLoc      Longitude and latitude of one point inside the territory in decimal degrees.
capital Name of the territory’s capital. For example, Dresden for ernestinian Saxony
after 1647.

E.2.2 Semi-structured crawl

The meaning of the following attributes is equivalent to the ones in the fully
-structured crawl: old_name, modern_name, type_of_rule, modern_country, in-
stance_of, inception, dissolved, religion, capital.

infobox       Whether or not the Wikipedia page of the territory has an infobox.
infobox_keys         List of territory attributes covered in the infobox.

F    HRE-specific infobox of Wikipedia

Figure 16 shows the infobox of the Wikipedia page of the Margraviate of Baden.
Infoboxes like this are used to crawl Wikipedia attributes in the automatic semi-
structured method.
You can also read


