Enabling "Untact" Culture via Online Product Recommendations: An Optimized Graph-CNN based Approach
←
→
Page content transcription
If your browser does not render page correctly, please read the page content below
applied
           sciences
Article
Enabling “Untact” Culture via Online Product
Recommendations: An Optimized Graph-CNN
based Approach
Wafa Shafqat and Yung-Cheol Byun *
 Department of Computer Engineering, Jeju National University, Jeju 63243, Korea; wafashafqat92@gmail.com
 * Correspondence: ycb@jejunu.ac.kr

 Received: 6 July 2020; Accepted: 31 July 2020; Published: 6 August 2020

 Abstract: The COVID-19 pandemic is swiftly changing our behaviors toward online channels across
 the globe. Cultural patterns of working, thinking, shopping, and use of technology are changing
 accordingly. Customers are seeking convenience in online shopping. It is the peak time to assist the
 digital marketplace with right kind of tools and technologies that uses the strategy of click and collect.
 Session-based recommendation systems have the potential to be equally useful for both the customers
 and the service providers. These frameworks can foresee customer’s inclinations and interests,
 by investigating authentic information on their conduct and activities. Various methods exist and are
 pertinent in various situations. We propose a product recommendation system that uses a graph
 convolutional neural network (GCN)-based approach to recommend products to users by analyzing
 their previous interactions. Unlike other conventional techniques, GCN is not widely explored
 in recommendation systems. Therefore, we propose a variation of GCN that uses optimization
 strategy for better representation of graphs. Our model uses session-based data to generate patterns.
 The input patterns are encoded and passed to embedding layer. GCN uses the session graphs as
 input. The experiments on data show that the optimized GCN (OpGCN) was able to achieve higher
 prediction rate with around 93% accuracy as compared with simple GCN (around 88%).

 Keywords: graph convolutional neural network; product recommendation system; untact;
 optimization; deep learning

1. Introduction
     After the COVID-19 outbreak and dire need for social distancing, there has been a tremendous
upsurge in the demands for online services and technologies. In South Korea, “untact” has become a
key plank after the country’s economy was severely affected by the pandemic. Untact is a Konglish
term which means “no contact” and it envisions a way of interaction that involves excessive online
connections among people and replaces humans with machines [1,2]. Due to COVID-19, there is a
sudden shift of users from offline to online mediums, resulting in high demands for online services
such as online shopping, online food delivery, online classes, virtual meetings, and online medical
consultation, etc., [3]. In South Korea, with the expanding untact culture, there was recorded 15.02%
hike in the usage of food delivery apps from 2.73 million users to 3.14 million users just in the span of
2–3 weeks. Similarly, in the same period of time, the number of online shopping users increased by
7% [4]. All the biggest shopping marts such as Homeplus, Lottemart, and Emart have witnessed a
sudden rise in the online members in a very short period, requiring them to ramp up their delivery
services. This expansion of online customers is not just limited to shopping and food delivery,
Netflix has also witnessed 12.8% increase in users just in the first half of February 2020 [4].

Appl. Sci. 2020, 10, 5445; doi:10.3390/app10165445                             www.mdpi.com/journal/applsci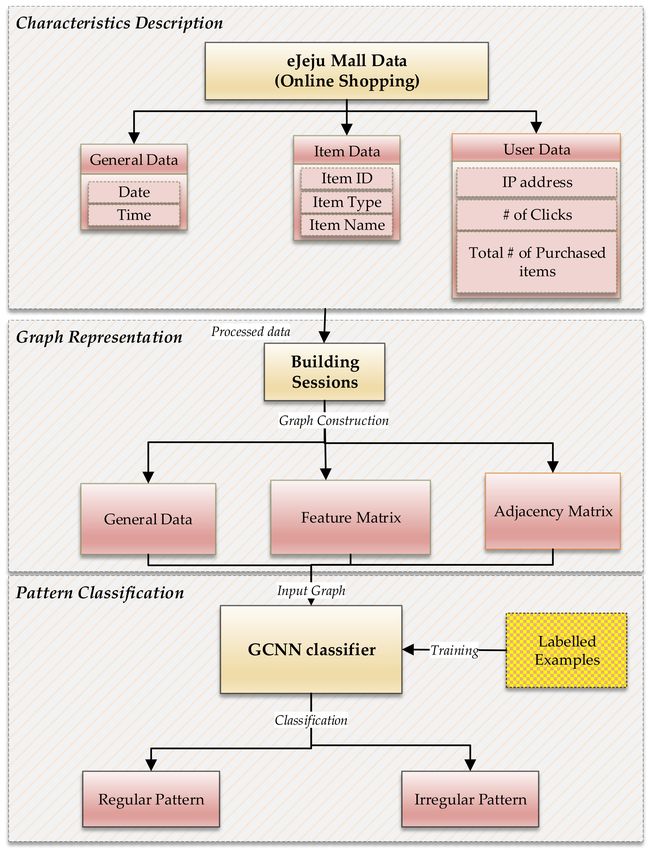
Appl. Sci. 2020, 10, 5445                                                                            2 of 21

      Recommendation systems enable multiple online businesses and web applications to select
and acquire interesting information from the systems. Some popular applications are e-commerce,
retail, media, banking, telecom, utilities, etc. Therefore, the current pandemic situation has also
accelerated the need for recommendation systems which enable users to make decisions in a relatively
short time. There are other reasons as well for the demand for recommendation systems such as
the rapidly growing internet applications generate a huge amount of data that can easily overload
the users with an abundance of information. Recommendation systems become fundamental for
redeeming users from such tiresomeness by alleviating the challenges caused by information overload.
These recommendation systems effortlessly become a reason for the increase in sales. For example,
Amazon and Netflix are taking advantage of recommendation systems by witnessing a 35% increase of
purchases and a 75% increase of views on Amazon and Netflix, respectively [5].
      Recommendation systems are a specific type of information filtering, which makes use of user’s
past activities and user comparisons to produce a rundown of information list that is customized
according to the end user’s requirements and preferences.
      The majority of existing recommendation frameworks depends on the user’s historical data.
Nonetheless, in numerous situations, the identity of the user might be unknown and only the actions of
the user in the ongoing session are known. There are some session-based recommendation techniques
proposed to handle these scenarios where the system can predict the next action of the user, e.g., in case
of product recommendation the next click of the user on an item can be predicted based on his previous
sequences of clicks.
      In this paper, we propose a product recommendation system for an e-shopping mall known as ejeju
mall. This recommendation system uses the history data of user i.e., click sequences and recommend
the item that the user is most likely to purchase. The state-of-the-art methods for recommendation
systems assumes that user preferences and history data is completely known. However, in the real
world, user preferences are very dynamic and can alter based on the user’s mood. Therefore, the smart
and intelligent modeling of user behaviors is required. We propose a Graph Convolutional Neural
Network-based recommendation model that overcomes the limitations of previously proposed methods
and it also considers the network structure. The proposed method optimizes the network structure for
better representation of nodes.
      We propose a session-based optimized Graph Convolutional Neural Network (GCN) model that
aims to capture and represent user behaviors in a more dynamic way. The sequence of clicks for each
user in a session is recorded. These sequences are used to generate session graphs. These session
graphs are directed graphs that represent the order of the clicks with time t and the last node represents
the item that the user has purchased in a session. These session graphs are then passed through the
embedding layer where embeddings for each graph are generated; these embedded graphs are used
as input for the GCN layer. Figure 1 presents the idea of the session graphs built on the user’s clicks
order. The left side of the figure shows M users and sequences of clicks for each user. The products are
represented by the colored circles, i.e., v1, v2, . . . vn. The directed arrows between products represent
the order in which they are clicked by the user. We can also refer to them as user’s interaction patterns
with different products.
      The right side of Figure 1 shows the session graphs generated based on the click sequences of
each user. In these session graphs, the chronological order of the clicks is preserved. The number of
paths to an item is also important. If there are multiple paths to a product vi, it means it’s been clicked
multiple times so the users might be more interested in this product. This process is repeated for all
the users and sessions. Consequently, the model aims to capture the complex interactions between
products, multiple sessions of a user, and sessions of multiple users.
      We have different data processing units; first, the raw data is processed to remove the anomalies
and brings the data format in a consistent format. Then different other features are derived from this
data such as the user’s location, clicks per session, and purchased items per session, etc. These input
features are then combined to generate the complete dataset for GCN processing. We used two different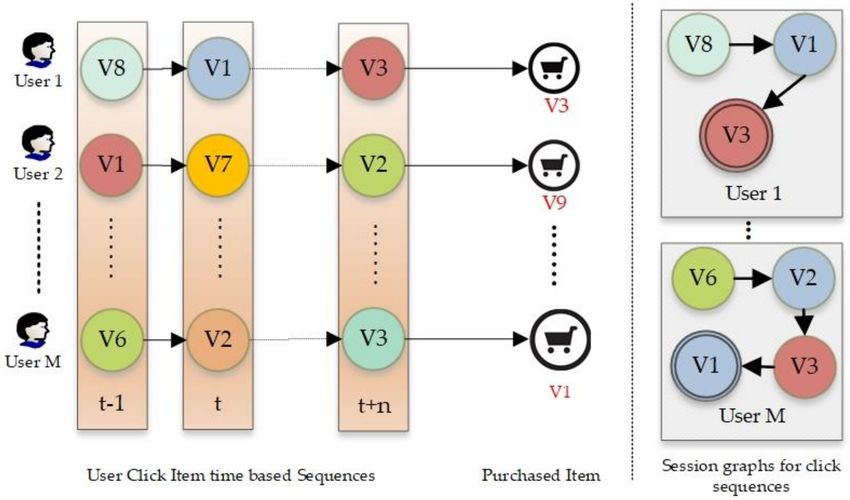
Appl. Sci. 2020, 10, 5445                                                                             3 of 21

GCN for experiments. The first GCN in a basic GCN model used in previous studies, and then we
optimized the graph structure in the other implementation of GCN. The comparisons of the results
show that based on the data the network structure should be optimized accordingly to enhance the
performance of the model.

                    Figure 1. User click pattern on different graphs and respective session graphs.

     In the rest of this paper, we first perform a review of the literature related to this work. The next
section explains the proposed methodology in detail. After this experimental details and results are
presented and the paper is concluded with some discussions and concluding remarks.

2. Related Works
     In this section, we present the literature review of the related works. We have divided the related
works into three sub-sections. In Section 2.1, we present related works on recommendation systems;
Section 2.2 presents research related to deep learning in product-based recommendation systems and
Section 2.3 briefly presents work done on GCN in recommendation systems.

2.1. Recommendation Systems
     Product-based recommendation systems are tools that provide suggestions to users about items
they might be interested in [6]. Collaborative filtering is one the effective approaches in building
recommendation systems. When recommendation is based on the preference of the user it is known as
the memory-based collaborative filtering and representation of knowledge, graphs and rules are known
as model-based collaborative filtering [7,8]. The other approach is the content-based filtering where
the system compares between the content of the item and the profile of the user. Recommendation is
based on the previous activities of the user [9,10]. The hybrid recommendation system approach is the
combination of both the above approaches.
     E-commerce sites are emerging every day and it has become a part of everyone’s daily
life. Hassle free shopping in the comfort of home with personalized recommendations is the
main advantage of online shopping. Various algorithms have been developed to enhance the
recommendation mechanism that combines both implicit and explicit feedback of the customer using
matrix co-factorization [11]. Another factor that can impact customers’ choice are reviews by people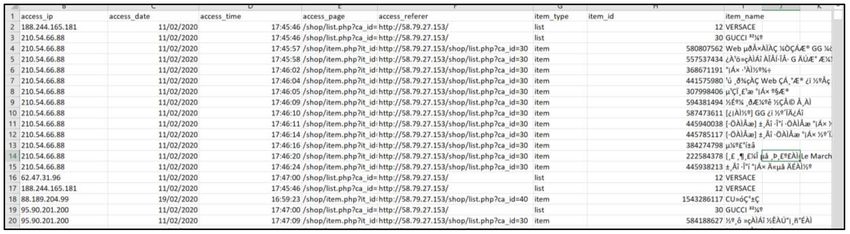
Appl. Sci. 2020, 10, 5445                                                                          4 of 21

they trust. In this case it’s important to collect the information about the customer’s social network
and to recommend products that might enhance the customer’s trust and interest for a particular
product [12]. One of the challenges of building a recommendation system is the huge and diversified
dataset. A hybrid approach with neural network framework named as outer product based neural
collaborative filtering (ONCF) and convolutional neural collaborative filtering (ConvNCF) along with
data mining techniques have been used by researchers to overcome data challenges [13–15].
     Generative adversarial networks (GAN), named as RecommenderGAN [16], have been one of
the frameworks to develop product recommendation systems that generates samples depending on
the combination of viewed and bought products. When developing for small scaled retailers with
limited dataset and processing power, GAN’s and data or rule mining have proved to be of excellent
capability [16–18].

2.2. Deep Learning in Product-Based Recommendation Systems
      Deep learning has excellent accomplishments in various field of applications. Autoencoder-based
approaches are one of the techniques that have contributed well in product-based recommendation [19].
Collaborative filtering for product-based recommendation suffers from cold start and incomplete cold
start problems where rating records are either not available or available in much less quantity. To deal
with this problem deep learning neural networks can be used for extracting content features [20,21].
Vectors of the user rating and item rating are generally treated as input to the deep neural networks and
batch normalization is used for eliminate overfitting [22]. According to [23], movies and e-commerce
are the most common domain for which recommendation systems are built.
      In [24], the author has developed a tag-aware recommendation system where the user profiles are
represented by tags and deep neural networks extracts detailed feature from every layer of the tag.
With the same approach, to capture every detail and interest of the user attention-aware recommendation
systems were developed using memory components [25]. In addition to it, co-attention network
considered the visual information like images to improve the performance of the recommendation
system [26]. Convolutional neural network (CNN), recurrent neural network (RNN) and auto-encoders
are commonly used techniques for recommending top-N products to individual user and is commonly
termed as personal recommendation [27–29]. To overcome the problem of negative sampling in CNN
and RNN, GAN is generally used while designing recommendation system [30].

2.3. Graph Convolutional Networks for Recommendation Systems
     Graph neural networks in general have similar architectures and work on a structured dataset.
Recently many researchers have started identifying the efficiency of using graph convolutional networks
over traditional networks. Sessions are an important attribute while considering online shopping.
In [31,32], researchers worked on session-based graphs where every click was labeled as a sequence.
Auto-regressive moving average were implemented for combining a graph convolutional layer into
the graph neural network to develop the recommendation framework. Frameworks have also been
developed for anonymous users from where we get a limited amount of information about users’
preferences using a deep neural network [33]. We have used Graph-CNN that produced better results
in this case.
     Matrix operations on graph networks for personalized recommendation using both implicit
and explicit feedbacks [34–36] are widely used, but in [37], the author has defined a graph attention
network that overcomes the challenges faced by the spectral-based graph neural networks. In [38–41],
the authors implemented semi-supervised algorithms on graph structured data. The authors claimed
that an approximation of the first order for graph convolutions can extract hidden information and
requires low computation time. In this paper we propose an optimized graph convolutional neural
network that represents graphs in a more convenient way for product recommendations.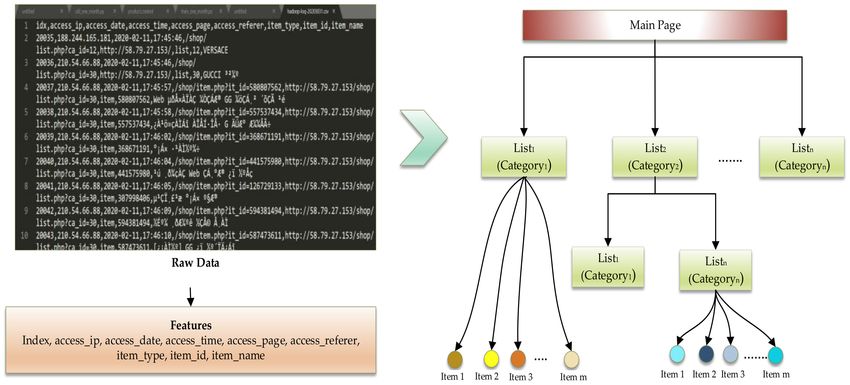
Appl. Sci. 2020, 10, 5445                                                                                  5 of 21

3. Data
     In this section, we present and explain the data we used for our experiments. It primarily includes
data type, its size, its source and preprocessing. Data selection is an important component of the
experimental process. Therefore, we have spent a lot of time on scrutinizing and preprocessing the data.
As the aim of this study is to recommend items to users based on their previous click patterns, we have
gathered data for an online shopping mart. A description of the data source is given in Table 1 below.

                                      Table 1. Data Description and Examples.

        Data                                Description                                  Examples
      acces_ip                         IP address of the user                           210.54.66.88
    access_date             The date when user is active and browsing                    11/02/2020
    access_time             The exact time when user clicked a product                     17:45:46
    access_page           URL of the page where user is currently active          /shop/list.php?ca_id=30
       item_id          Unique identification number (ID) of the clicked item              202020
    item_name                      Name of the clicked product                           VERSACE
     Item_type                     Type of the product clicked                  Purchased, clicked or visited

3.1. User’s Clicks Data
     We have users’ click history data on different items which includes the previously clicked items so
far by the user in one session. User’s clicks are used to understand the behavior of a user in terms of
his pattern of exploring different online products. We also refer this data as clicks sequence of a user.
This data was then processed to discover unique clicks, purchased items per user and then all the data
was encoded into unique item IDs (identification number).

3.2. User’s Personal Data
     Besides the click’s sequences for each user, we have the user’s IP address referred as access_ip,
the date and time when user clicked a product referred as access_date and access_time respectively.
From this access_ip, we derived the location of each user. Similarly, we used access_date and
access_time to generate different sessions.

3.3. Product Data
    As the recommendation system is aiming to suggest different products to users, the dataset
contains some product features as well. These features include product ID (referred as item_id),
product name (referred as item_name), and product click type (referred as item_type).

4. Proposed Optimized Graph-CNN-based Approach for Online Product Recommendation
     In this section, we explain the proposed session-based recommendation system. First, we present
the problem formulation and then present the conceptual framework of the proposed system. This is
followed by a complete architectural diagram and explanation. In this section we also define some
useful notations and system parameters.

4.1. Problem Definition
     This project aims at recommending users with next most likely purchasable product to be clicked.
Session-based recommendation aims to predict which item a user would like to click next, only based
upon his/her current interaction sequence. A session is referred to a time period where a set of
items (e.g., products in our scenario) are clicked or collected or visited by users. Session-based
recommendation aims at predicting the future actions of a user in a given session. For example,
by having some partial data related to a session (e.g., some history or pattern of clicks), session-based
product recommendation system will recommend an item which a user will likely to click next.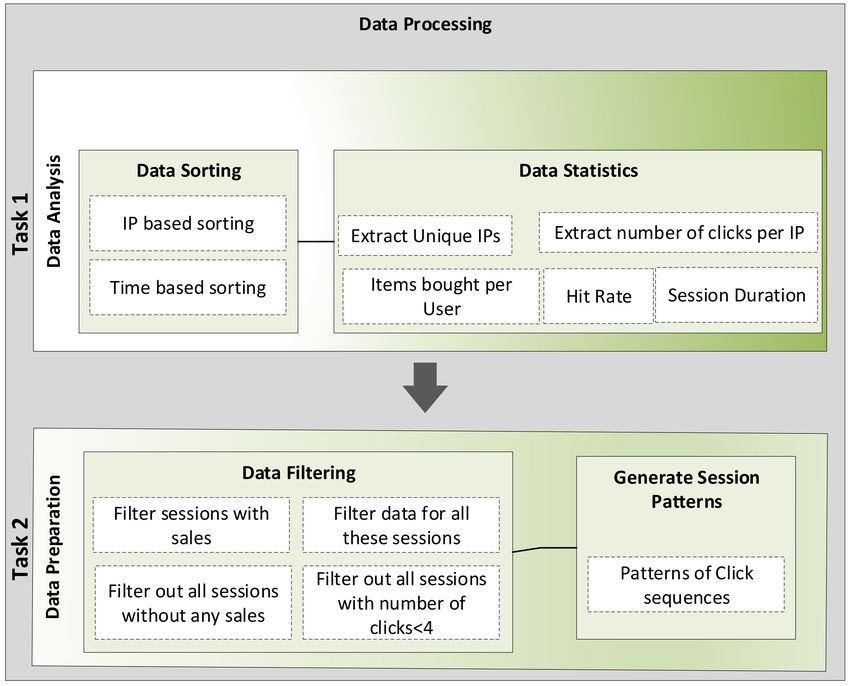
Appl. Sci. 2020, 10, 5445                                                                            6 of 21

     Here we give a formulation of the session-based recommendation problem as below.
     There are two important factors to be considered, the products and the order in which they are
clicked. All the unique products in all sessions are represented in Equation (1):

                                         V = {v1, v2, v3, . . . ., v|V|}                                (1)

      Similarly, the order of their clicks is represented in time order as shown in Equation (2):

                                           C = {c1, c2, c3, . . . , cn}                                 (2)

where cn is the latest clicked item and c1 is the very first item clicked by a user in a session. All the
clicked items in Equation (1) belong to V which represents a particular item clicked by a user at a
certain time. For example, if we have a clicked item in C named as ct, it represents an item in V clicked
by user at time t. Therefore, the objective of our proposed model is to predict the next possible product
click that is most likely to be purchased i.e., cn+1. It can be formulated using Equation (3):

                              Ct = { c1, c2, c3, . . . . . . , ct − 1, ct}(1 ≤ t < n))                  (3)

      Precisely, a ranked list of all the possible items that can be clicked and purchased by the user
in a session is generated by the model. It shows that the output is the probability of a product to be
purchased from the complete list of products in the dataset i.e., V. Hence, we can say that:

                                         ŷi = ŷ1, ŷ2, ŷ3, . . . , ŷ|V|

                                                                                                        (4)

where, ŷi represents the recommendation score of products vi. As, the recommendation system
usually aims at suggesting more than one product to the user therefore, we select top k products form
Equation (4) for recommendation.
    Now, we express this problem in terms of graphs. First, we use the generic representation of a
graph in terms of vertices and edges and define an attributed graph as shown in Equation (5):

                                                G = (V, E, X)                                           (5)

where, V is the set of nodes and each node represents a unique product as shown in Equation (1). E is
the set of edges between nodes i.e., clicks sequence or order between different products also shown
in Equation (2). The attributed graph differs from the traditional graph as it includes an additional
parameter as X. X is the feature matrix that represents the features of all the products. Next, we build
an adjacency matrix A which also represents the network topology. The entries in the adjacency matrix
are either 0 or 1. If there is an edge between two products then the entry will be 1 otherwise it will be 0.
The degree of all the nodes is represented in the degree matrix D.

4.2. Session-Based Recommendations Model
      The proposed framework is a recommendation framework that uses users’ online clicks on
different products and generate the interactions among them by using graph structure. The Figure 2
below shows the conceptual framework of the proposed model. First, we have real data of an online
Korean shopping mart, this data can be divided into three different types such as, user data, item data
and general data. The user data contains user related features like his IP address, and purchased items
etc. The Item data contains item related features such as, ID and name. All other features are added to
the general data category.
      The data is prepared and processed to use as input for graph representation. Here, the sessions
are generated based on clicks sequences of users in chronological order. From these session graphs,
adjacency matrix, feature matrix and other general data such as node degree matrix, node frequency
etc. are generated. Adjacency matrix represents the relationship between products. The final task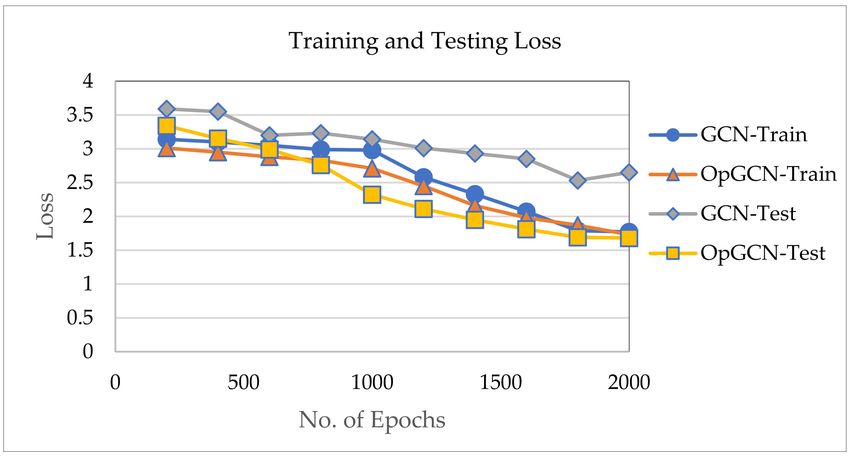
Appl. Sci. 2020, 10, 5445 7 of 21
is pattern classification and prediction, where the GCN classifier is used to classify the patterns and
predict items that are most likely to be purchased given some number of clicks. Finally, the top K
products are recommended to user based on their probability of being clicked next.
Figure 2. Conceptual framework of the proposed model.
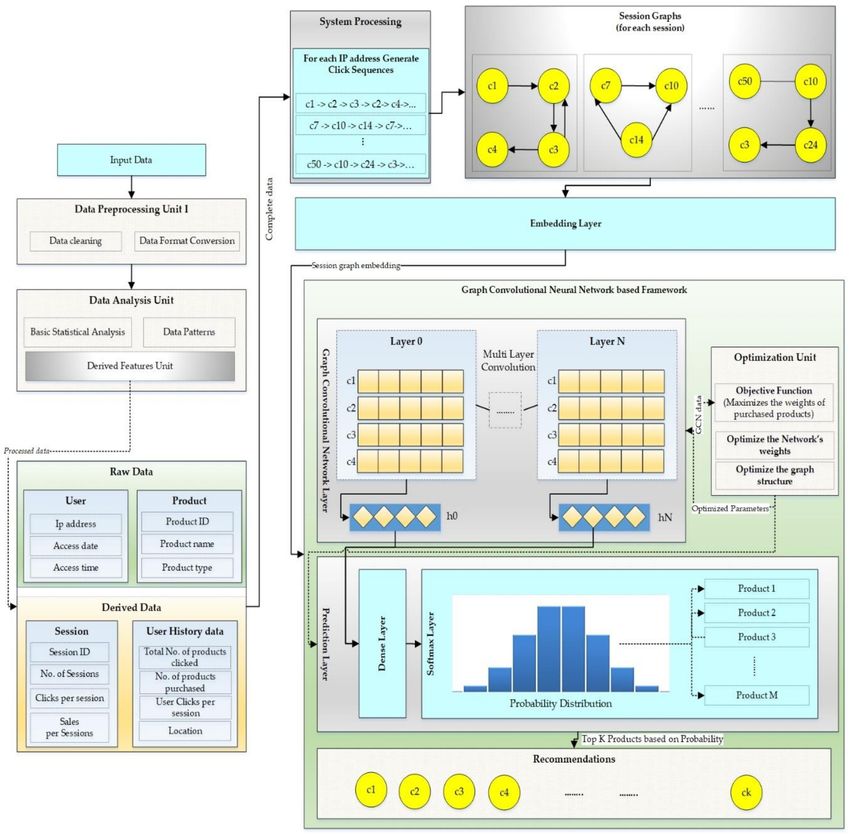
4.3. System Architecture
A detailed view of the whole procedure and system architecture is shown in Figure 3. There are
multiple layers in the architecture. The first layer deals with the input data. After basic processing of
the data, it is passed to the data analysis unit, where the data is thoroughly analyzed to understand the
data behavior and find some useful insights. After the analysis, some additional features are derived
from the raw data. These features include user click history, items purchased per user, items clicked
per user etc. the complete data is used to generate sessions.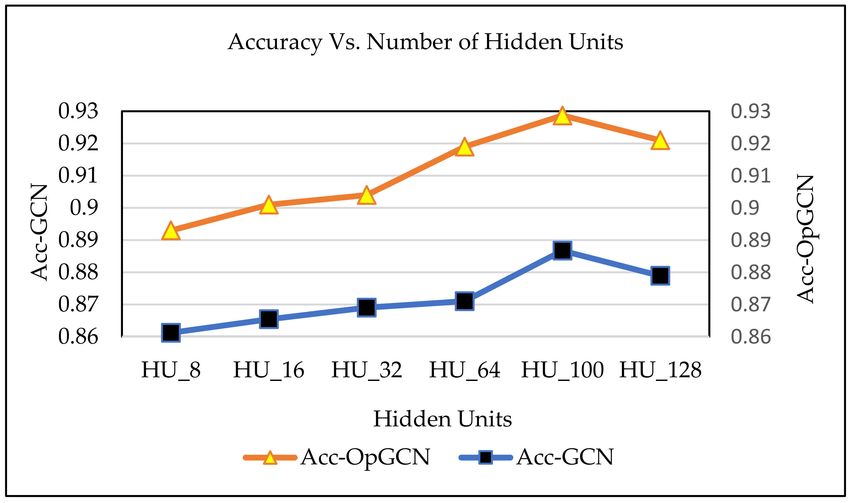
Appl. Sci. 2020, 10, 5445                                                                             8 of 21

                                  Figure 3. Proposed system architecture.

      These generated sessions are used in the next layer as input where the click sequences are
transformed into session graphs for each user. To build the session graphs, we followed the method
similar to SR-GNN (Session-based Recommendation with Graph Neural Networks), in which the graph
structure is based on user’s clicks sequences. These session graphs are then passed to the embedding
layer that generates embeddings for each session graph. Each product is embedded in an integrated
embedded space and denoted as a node vector. The resulting embedding table can be a representation
of latent attributes of the products that is used to depict their fundamental characteristics. Concurrently,
the adjacency matrix is used to save the relationships between products in terms of edges. Therefore,
there are chances that many edges can occur repeatedly. To solve this issue, edges are normalized by
assigning them a normalized weight. This normalized weight is calculated as shown in Equations (6)
and (7):
                                                              Xn
                                     Edge_Frequency(x,y) =        Ei(x, y)                              (6)
                                                            i=1

                                                      Edge_Frequency(x,y)
                                 Weightnormalized =                                                      (7)
                                                             degx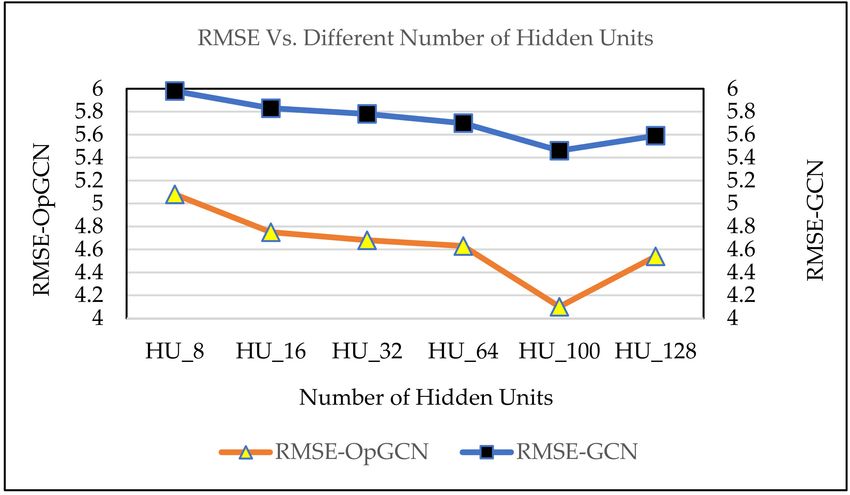
Appl. Sci. 2020, 10, 5445                                                                                      9 of 21

where, Ei is an edge between two products x and y. to calculate the occurrences of this edge we check
its frequency as Edge_F requency(x,y) . In Equation (7), degx is the degree of the starting node in the edge.
      Once, the session graphs as Gs = (Vs, Es) based on Equation (5) along with their respective
embeddings are generated, now each node or product v can be mapped to X i.e., the feature matrix
containing features of each product. After that E is calculated to generate the adjacency matrix
represented as A. We can express the graph as a combination of products with feature and adjacency
matrix i.e., G = (V, X, A). GCN works by consistently updating node’s state to its the neighboring nodes
and then at some point it converges.
      As the dataset used in this work is very large and it contains a large amount of nodes the
computational cost can be very high. The generated graphs have lots of features and nodes and it will
take a lot of computational time to update the node state to the neighboring nodes. Therefore, we have
introduced an additional module that helps in optimizing the network structure and maximizes the
weights of product nodes that are purchased by the customer. We optimize the network structure by
reducing or removing the nodes that are rarely accessed and are given lowest weightage. We also
used Chebyshev polynomial method that is mostly used to reduce the computational complexity of an
algorithm [42].
      The GCN has L number of layers and each layer is responsible to propagate the information
between the product nodes. According to the GCN introduced in [43], the neighboring nodes are
treated equally, however, we have introduced an additional module to optimize the network structure
and that is responsible to update the weights of nodes based on their likelihood of being purchased.
As shown below the Y includes all the products that are being purchased by users. Hence, the objective
function tries to maximize the weight of the products that belong to Y referred as t in the Equation (8):

                                   Ob jective f unction = Maximize(Weightt )                                      (8)

where Weight is the weight for the products being purchased. After this the prediction layer comes, at
this level the we compute the probability p̂ or score for each product given that session embedding ht
as shown in the Equation (9) below,
                                              p̂ = ht T [xi]                                       (9)

where xi denotes the clicked item at time T. After this we calculate the output vector by passing through
the softmax layer as shown in Equation (10):

                                                  ŷ = so f tmax (p̂)                                           (10)

where ŷ represents the probability of recommending product i to be clicked and most likely to be
purchased. For reducing the training and testing loss and optimizing, we used the most widely used
cross entropy loss. The final optimization or loss function of our model is shown in Equation (11) below:
                                                  n
                                                  X
                  OptimizationFunctiom (Loss) =         yi log ( ŷi ) + (1 − yi ) log (1 − ŷi ) + λ ||θ||2    (11)
                                                  i=1

where the ground truth product is represented by its one-hot vector encoding ŷ all the learnable
parameters set is represented by θ. The last factor λ is a regularization parameter on θ, which we use
to overcome the challenge of overfitting.
     The prediction layer presents the probabilities of all the items to be purchased next. We select the
top k products with highest prediction score and recommend them to the user.

4.4. Data Processing
     The data processing part as shown in Figure 4 is the most important part of the whole system.
This processing unit enables us to understand the underlying patterns of data, basic data structures,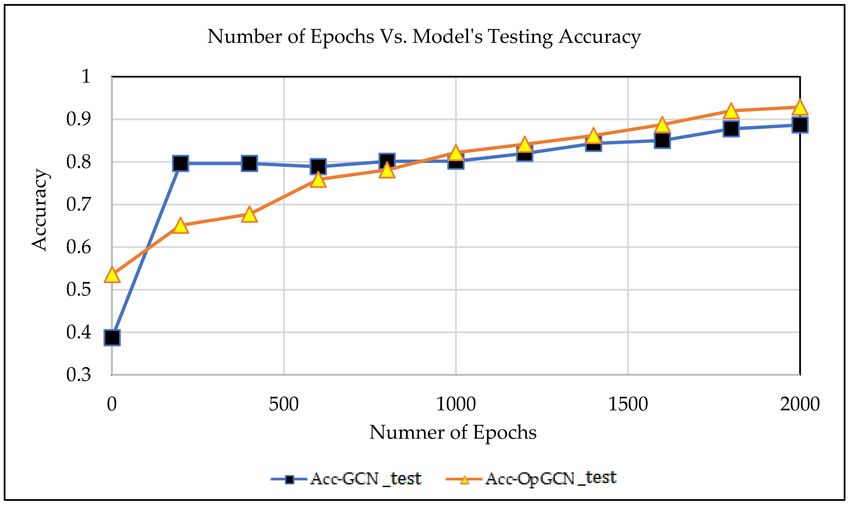
Appl. Sci. 2020, 10, 5445                                                                             10 of 21

data anomalies, regular and irregular behaviors of data. Primarily, there are two tasks of data processing,
data analysis and data preparation for experiments. Data analysis learns the basic data patterns,
structures and statistics of data such as unique IPs, sessions, clicks per product, sales per user, and sales
per session etc. Data analysis is followed by task 2, i.e., data preparation. Here, tasks such as filtering
data and generating session patterns are performed. The data filtration process is very important step
in data preparation task as here we take crucial decisions such as what records are to be kept and
what records should be discarded. The discarded records are usually responsible for anomalies or
irregular patterns in data. Finally the session sequences are generated that are based on the patterns of
click sequences.

                                         Figure 4. Data Processing.

      In Figure 5, the process of data categorization is shown. The raw data has specific fields that
reflect the product type or category. We generate different categories of products based on the access
pages. There are some clicks on the home page, then user can click on any category of product which is
referred as a list in the data, it means user has chosen a generic product category e.g., Food. The list or
category of product can be nested e.g., Food can be categorized into Fruits, Vegetables, Meat or Snacks,
etc. Each category can have multiple products in it.
      Then user can click on any specific product in that particular category referred as an item, e.g., user
can click apple from fruits category which is a subcategory of Food. User can click on any item and
just visit it e.g., just go through the description, or he can purchase that item.
Appl. Sci. 2020, 10, 5445 11 of 21
Figure 5. Data categorization from raw data.
5. Implementation and Testing Environment
In this section, we present the implementation environment in detail. This section includes
experimental setup details, explanation of data collection process and data description, and the
model structure. First, we describe the dataset used for experiments and the parameter selection.
We compared the GCN model with our optimized GCN. We also compared the results with other
baseline model and SR-GCN model.
5.1. Experimental Setup
The experimental setup is summarized in Table 2. The core system components include a long-term
support (LTS) version of Ubuntu (Version 18.04.1, Canonical, London, United Kingdom, 2018) as an
operating system, with 32 Gb memory, and graphics processing unit (GPU) is GeForce 1080 (Nvidia,
Santa Clara, CA, United States). The implementation is done in Python language along with Tensorflow
API (Version 1.13, Google Inc., Mountain View, CA, United States, 2019).
Table 2. System’s components and specification.
System Component Specification
Operating System Ubuntu 18.04.1 LTS
Memory 32 Gb
Language Python
GPU Nvidia GForce 1080
Language Version 3.6.1
APIs Tensorflow 1.13,
Key Liberates Numpy, skearn, Pandas
Encoding EUC-KR
5.2. Experimental Data
The details for the experimental data are presented in Table 3. For all experiments, we divided the
data into 60% training data 20% validation data and 20% testing data. The total number of 294894
records. The raw data is collected in log files as shown in Figure 6 which we processed to generate
session patterns.Appl. Sci. 2020, 10, 5445 12 of 21
Table 3. Characteristics of data used for experiments.
Experimental Data Details
Total no. of Records 294894
Data Duration (1 year) 2019-2020
Total No. of Unique Users 51386
Figure 6. Sample of a log file.
This data is very recent and is of around 1 year form Jun 2019 to July 2020. There are in total 51386
unique IP addresses in the data.
For experimental purposes we have used three different kind of settings. The data records are
built accordingly. We have experimented on different lengths of click sequences. For this purpose,
we have generated three types of records each containing different numbers of user clicks sequence
lengths. The minimum size of all click sequences is considered to be 3 and the maximum size is varied
till the maximum number of clicks in a session by any user i.e. 40. The following Table 4 describes the
data setting in detail.
Table 4. Data characteristics based on click sequence length.
Clicks Sequence Length (Min to Max)
Experimental Data
3 to 15 3 to 25 3 to 40
Total rows 294894 294894 294894
Discarded rows (len < Min) 1440 2596 2321
Useful Rows 293454 292298 292573
Expansion rows (>Max) 3013 3013 3013
We have performed experiments based on the GCN, the optimized GCN. The parameters are
shown in the Table 5 below.
Table 5. Item status type vs click frequency.
Item Status Type Clicked Frequency
Clicked Items 244533
Visited description 42630
Purchased 7701
5.3. Evaluation Metrics
Here, we list down the evaluation metrics used to access the system performance:
(1) Accuracy: We calculated accuracy of the model by using following formula as shown in
Equation (12):
||Y, −, Ŷ ||F
Accuracy = 1 − (12)
||Y || FAppl. Sci. 2020, 10, 5445 13 of 21
(2) Root Mean Square Error (RMSE): We calculated RMSE by using following Equation (13):
v
u
M N
u
t 2
1 XX j
RMSE = yi j − ŷi (13)
MN
j=1 i=1
j
where yi j and ŷi are subsets of Y & Ŷ and represent the actual user click data and predicted click of
the jth time sample in the ith session respectively. M is total time samples, and N is number of products.
RMSE is specifically used to estimate the prediction error. The smaller the value of RMSE is the better
is prediction rate or score according to Equation (14):
1
Prediction rate ∝ (14)
RMSE
while accuracy is used to detect the precision of predictions and it has an opposite effect than RMSE
on prediction rate as shown in Equation (15). The higher the value of accuracy is, the better is
prediction rate:
Prediction rate ∝ Accuracy (15)
(3) Mean Reciprocal Rank (MRR@10): MRR is defined as an average of reciprocal ranks of
the correctly recommended products. In our case we used top 10 products i.e., the reciprocal rank
becomes 0 when the actual rank surpasses 10. The purpose of using MRR is to capture the order of
recommendation ranking. Therefore, a correct recommendation in the top of the ranking list if it has a
larger value of MRR.
5.4. Model Parameters
Here, we present the model parameters used while GCN and optimized GCN training.
These parameters mainly include learning rate, training epochs, batch size, hidden units’ size etc.
As shown in Table 6, we experimented with different learning rates as 0.01, 0.001 and 0.0001.
We also varied the number of epochs between 1000 to 5000. The used different batch sizes as 25, 32 and
45. Finally choosing the number of hidden unit is crucial as different sizes can have different impact on
the prediction accuracy. Therefore, we experimented with different numbers of hidden units such as 8,
16, 32, 64, 100 and 128.
Table 6. Model parameters and their values.
Model Parameters Value Range
Learning rate 0.01, 0.001, 0.0001
Number of Epochs 1000 to 5000
Batch size 25, 32,45
Hidden units 8, 16, 32, 64, 100, 128
6. Results
This section presents the results and analysis for online product recommendations based on
user’s previous click sequences and purchased items. In Section 6.1, we present the testing errors.
In Section 6.2, we report on the accuracy of the results of the proposed model in comparison with
other models.
6.1. Impact of Hidden Units Selction
As selection of hidden units can impact on different parameters of system’s performance therefore,
we performed some experiments by varying the number of hidden units.Appl. Sci. 2020, 10, 5445 14 of 21
The graph in Figure 7 shows the RMSE estimated for both GCN and optimized GCN by varying
number of hidden units. The number of hidden units are important and right selection of hidden
units can enhance the prediction effect. As we can see, the optimal number of hidden units in our
scenario are 100 as both models show their lowest RMSE value when the hidden units selected are 100.
The RMSE of OpGCN is vividly very less as compared with simple GCN.
Figure 7. RMSE (Root Mean Square Error) vs. Number of hidden units (HU). Comparing RMSE
with varying number of hidden units used in the model. GCN: graph convolutional neural network;
OpGCN: optimized GCN.
The graph in Figure 8 shows the accuracy estimated for both GCN referred as Acc-GCN and
optimized GCN referred as Acc_OpGCN by varying number of hidden units. Here also we can observe
that the optimal number of hidden units are 100 as the accuracy recorded at this point is highest for
both the algorithms. The highest accuracy achieved by GCN is around 0.89 and for optimized GCN is
around 0.93.
Figure 8. Accuracy (Acc) vs. Number of hidden units.
In summary, the prediction results are observed to be better if the hidden units are set to 100.
We can also observe that when we increase the number of hidden units, the RMSE first starts to
drop and then after some point it starts increasing again. Similar pattern can be seen in prediction
accuracy. This happens when the hidden unit is bigger than a certain number that increases the model’sAppl. Sci. 2020, 10, 5445 15 of 21
complexity and imposes additional computational challenges. And as a result, overfitting on training
data happens. Therefore, we used optimal value of 100 for our remaining experiments.
6.2. Accuracy Vs. Number of Epochs
Here, we compare the training and testing accuracies on different number of epochs for both
the models.
Figures 9 and 10 show that the optimized GCN succeeded in achieving higher accuracy of
prediction both in training and testing as compared with a simple GCN model. The accuracy
of GCN is reffered as Acc_GCN_train and Acc_GCN_test for training and test data respectively.
Similarly, the accuracy for OpGCN is referred as Acc_OpGCN_train and Acc_OpGCN_test for training
and test data respectively. This proves that the optimization of nodes structure does impact the overall
performance of the system. OpGCN achieved around 92% prediction accuracy while GCN achieved
around 88%.
Figure 9. Epochs vs. training accuracy.
Figure 10. Epochs vs. testing accuracy.Appl. Sci. 2020, 10, 5445 16 of 21
6.3. Training and Testing Loss
Here, we compare the training and testing loss on different number of epochs for both the models.
The graph in Figure 11 shows the training and testing loss comparison of the predicted results
for both the simple GCN model and the proposed variation of GCN, i.e., the optimized GCN model.
The testing loss of GCN is higher as compared with the training and testing loss of the optimized
GCN model.
Figure 11. Epochs vs. Training and testing loss.
6.4. Impact of Click Sequence Length
As a user can click as many products as he wants, therefore, it is very important to find the optimal
length of a click sequence for better recommendations.
Therefore, we generate different records based on the maximum length of a click sequence.
The maximum length of clicks recorded in one session are 40. We vary the maximum length of the click
sequence i.e., 15, 25 and 40. The graph in Figure 12 shows that the model’s performance is enhanced
when the number of clicks are between 15 to 20. The accuracy starts decreasing when the length of the
clicks increases i.e., for 40 clicks the model’s performance is very poor.
Figure 12. Length of click sequence Vs. Model (OpGCN) Accuracy.Appl. Sci. 2020, 10, 5445 17 of 21
6.5. Comparisons with Baseline Methods
We compare our model with other state of the art methods to evaluate the overall performance of
the proposed method. The overall performance is measured in terms of accuracy, MRR@10 and RMSE.
We also used other datasets for experiments. These data sets include a citation network and a product
network named as Cora [44] and Diginetica [45], respectively.
We used the following baseline models to compare the performance of our proposed method:
(1) POP [46]: This model ranks items based on their popularity and recommends the n-most popular
items to the user.
(2) HRM [47]: This model introduces both linear and non-linear pooling operation to combine the
transaction history of the user.
(3) NARM [48]: This model uses a global and local recurrent neural network based recommender
that captures the sequential behaviors of users.
Table 7 shows the values for the evaluation metrics for Diginetica, Cora and our dataset. According
to the evaluation results, our proposed model OpGCN achieves an average accuracy of around 93%,
RMSE score of 0.08 and mean reciprocal rank of 36.47 that depicts our model performs better than the
existing models.
Table 7. Performance comparison of different baseline methods on different datasets.
Evaluation
Datasets Type POP HRM NARM OpGCN
Metrics
Accuracy 0.76 0.84 0.81 0.93
Cora Citation Network RMSE 6.50 5.42 5.81 4.52
MRR@10 21.87 33.45 29.56 34.72
Accuracy 0.73 0.85 0.83 0.92
Diginetica Product Network RMSE 6.12 5.36 5.11 4.50
MRR@10 23.85 31.55 29.01 36.78
Accuracy 0.72 0.83 0.82 0.93
Our dataset Product Network RMSE 5.51 5.92 5.35 4.50
MRR@10 22.57 29.74 31.67 37.91
7. Conclusions
We propose a model based on graph-CNN for session-based product recommendations in
online marketplaces. The proposed model comprehensively emphasizes the customer’s interests
and previous click patterns. After extensive experiments and parameter tuning, our model learns
the complex relationships between product data, network structure and as well as the temporal
information. With the simple GCN model the system finds it difficult to get more than 80% prediction
accuracy. Also, without fine tuning the model’s structure, it becomes computationally rich and complex.
That affects the performance of the model in terms of low prediction rates and model overfitting.
Therefore, we propose another variation by introducing an optimization module. This module is
incorporated with the simple GCN model, it learns the optimal values for each node and then updates
the weights accordingly. During the process, records with less than three clicks are discarded along
with the records that show some abnormal patterns.
Specifically, we first process the log data files, the random data records are converted to user click
sequences. These click sequences of users are converted to anonymous user sessions. Then directed
graphs are constructed from these sessions referred as session graphs. The products are encoded and
are later converted into nodes. Each node represents an item. These session graphs are embedded,
and we use them as input to the GCN model. It basically takes click sequences in form of session
graph and each session graph has a destination node i.e., a final product bought by the user. If a user
has multiple items bought in the same session, we generate separate paths for each destination node.Appl. Sci. 2020, 10, 5445 18 of 21
This way all the dependencies in the data are learnt. We use an objective function that maximized the
weights of our desired nodes and hence, minimize the weights of undesired nodes. This way the graph
structures become less computationally complex. Then the prediction layer predicts the likelihood of
each product to be clicked and purchased by the user. The recommendation module selects top k items
for the user.
We have different sizes of session graphs based on the maximum number of clicks made by a
user in a session. In experiments, we tune the maximum clicks and evaluate the performance of
the model. We have learnt that optimal size of click sequence is 15 to 20 clicks. If number of clicks
increases beyond 20, the performance of the systems starts degrading. This means that we find the
best possible structure of the graph with appropriate number of nodes that are the best representative
of the whole data. If a system is successful in optimizing the graph structure, it can drastically improve
the performance of the recommendation system. We have figured out the importance of the graph
structure and how it can uplift or enhance a systems performance.
Therefore, we performed experiments with different settings, we generated graph structures with
different tuning parameters such as the nodes selection, fixing sequence length, optimal weights of the
nodes etc. The experiments show that our proposed variation performed better on the same data with
same experimental settings. The network structure is the key part, based on different decisions on
data representation, records generation, session building and graph representation. In future, we will
focus on more variations of GCN model and on the effective network structure. The network structure
can be highly altered by changing the data records, graph structure such as directed or undirected,
and session records etc. We will also be focusing on hybrid approaches of GCN with other state of
the art approaches in order to handle large scale data and for representation learning to achieve more
effective and interpretable recommendations.
8. Contributions and Future Directions
In this paper we have illustrated the significance of online marketplaces that are playing their parts
in enabling untact culture, especially after the COVID-19 pandemic. Recommender systems are one key
component of this whole cyberworld chain as they are equally effective and lucrative for both customers
and business owners. Therefore, there is a dire need for effective and intelligent recommendation
systems that can enhance the online buying process helping customers with their decision-making
processes. We propose a model based on graph structures for making product recommendations to
users. The model is based on GCN which is a relatively new approach for recommendation systems
and requires a lot more to discover by varying the network structure. We contribute by proposing
an optimized variation to it. This enables an effective network structure and hence improves the
performance. We also experiment with different lengths of user click sequences and find the optimal
number of clicks. It is essential for a recommendation system to assess the user behavior proficiently to
make effective recommendations. The purpose of experimenting with different click sequence lengths
was to get an understanding of how many clicks it can take for an effective recommendation. As there
are cases where a user makes too many clicks in a single session, using all those clicks might not be a
smart design choice as there can be hidden click sequences inside a pattern. Therefore, an optimal click
sequence length is an important factor to be considered when making design choices for the model.
There are numerous promising opportunities for future work. The proposed model can be applied
in other recommendation systems such as movies, books or online product recommendations where
we can first learn a user’s click pattern and then can add other context vectors such as price, season,
brand, range, reviews, and location and so on. It can also be interesting to see how user behaviors
and preferences change or develop overtime under specific circumstances. We would like to evaluate
our proposed model in a more realistic setting, e.g., examine how users interact or make preferences
based on a specific condition, situation or feature. Recommendation systems with better context
understanding and awareness are expected to generate effective recommendations by considering all
the relevant contextual features of users and environment as well. Currently, though we are usingAppl. Sci. 2020, 10, 5445 19 of 21
user clicks as a primary form of input, it would be an interesting addition to extend the features list by
including product based and user profile based features. As, recommendation systems are to provide
efficient services to users by learning their characteristics and behaviors, therefore, user profile based
features, environmental factors, product features, and other relevant contextual features can be an
interesting addition to the model in the future.
Moreover, for the current coronavirus pandemic, we would like to evaluate our model on large
data collected from different online shops during this period and critically analyze its impact on the
habitual shift of customers form offline to online platforms.
Author Contributions: Conceptualization, W.S.; methodology, W.S.; software, W.S.; validation, W.S., and Y.-C.B.;
formal analysis, W.S.; investigation, W.S.; resources, W.S., and Y.-C.B.; data curation, W.S.; writing—original
draft preparation, W.S.; writing—review and editing, W.S.; visualization, W.S.; supervision, Y.-C.B.; project
administration, Y.-C.B.; funding acquisition, Y.-C.B. All authors have read and agreed to the published version of
the manuscript.
Funding: This work was supported by Korea Institute for Advancement of Technology (KIAT) grant funded by
the Korea Government (MOTIE) (N0002327, The Establishment Project of Industry-University Fusion District).
Conflicts of Interest: The authors declare no conflict of interest.
References
1. Lee, J.-Y.; Oh, C.-J.; Kim, H.-J. S Korea Set to Launch Digital New Deal Project to Resurrect Economy
after Virus. Available online: https://m.pulsenews.co.kr/view.php?year=2020&no=466656 (accessed on 2
July 2020).
2. Kim, S. South Korea Bets on ‘Untact’ for the Post-Pandemic Economy. Available online: https://www.
bloombergquint.com/businessweek/south-korea-untact-plans-for-the-post-pandemic-economy (accessed
on 2 July 2020).
3. Jo, H.-R. Non Face-to-Face Service Spikes as Coronavirus Spreads. Available online: http://www.koreaherald.
com/view.php?ud=20200227000717 (accessed on 2 July 2020).
4. COVID-19 Will Permanently Change e-Commerce in Denmark. Available online: https://www2.deloitte.com/
content/dam/Deloitte/dk/Documents/strategy/e-commerce-covid-19-onepage.pdf (accessed on 2 July 2020).
5. Recommendation Systems Increase Sales. [2020 update]. Available online: https://research.aimultiple.com/
recommendation-system/ (accessed on 2 July 2020).
6. Ricci, F.; Rokach, L.; Shapira, B. Introduction to recommender systems handbook. In Recommender Systems
Handbook; Springer: Boston, MA, USA, 2011; pp. 1–35.
7. Yera, R.; Martinez, L. A recommendation approach for programming online judges supported by data
preprocessing techniques. Appl. Intell. 2017, 47, 277–290. [CrossRef]
8. Xiao, J.; Wang, M.; Jiang, B.; Li, J. A personalized recommendation system with combinational algorithm for
online learning. J. Ambient. Intell. Humaniz. Comput. 2017, 9, 667–677. [CrossRef]
9. Wang, R.; Jiang, Y.; Li, Y.; Lou, J. A collaborative filtering recommendation algorithm based on multiple
social trusts. J. Comput. Res. Device 2016, 53, 1389–1399.
10. Tarus, J.K.; Niu, Z.; Mustafa, G. Knowledge-based recommendation: A review of ontology-based
recommender systems for e-learning. Artif. Intell. Rev. 2017, 50, 21–48.
11. Yang, B.; Lei, Y.; Liu, C.-M.; Li, W. Social Collaborative Filtering by Trust. IEEE Trans. Pattern Anal. Mach.
Intell. 2016, 39, 1633–1647. [CrossRef] [PubMed]
12. Zhang, S.; Yao, L.; Sun, A.; Tay, Y. Deep Learning Based Recommender System. ACM Comput. Surv. 2019, 52,
1–38. [CrossRef]
13. He, X.; Du, X.; Wang, X.; Tian, F.; Tang, J.; Chua, T.S. Outer product-based neural collaborative filtering. arXiv
2018, arXiv:1808.03912.
14. Fátima, R.; Bruno Ferreira, B. Product recommendation based on shared customer’s behaviour. Procedia
Comput. Sci. 2016, 100, 136–146.
15. Bock, R.J.; Maewal, A. Adversarial learning for product recommendation. arXiv 2020, arXiv:2007.07269.
16. Chen, J.; Miller, C.; Dagher, G.G. Product recommendation system for small online retailers using association
rules mining. In Proceedings of the 2014 International Conference on Innovative Design and Manufacturing
(ICIDM), Montreal, QC, Canada, 13–15 August 2014; pp. 71–77.Appl. Sci. 2020, 10, 5445 20 of 21
17. Ben Schafer, J.; Konstan, J.A.; Riedl, J. E-Commerce Recommendation Applications. Data Min. Knowl. Discov.
2001, 5, 115–153. [CrossRef]
18. Strub, F.; Gaudel, R.; Mary, J. Hybrid recommender system based on autoencoders. In Proceedings of the 1st
Workshop on Deep Learning for Recommender Systems, Boston, MA, USA, 15 September 2016; pp. 11–16.
19. Wei, J.; He, J.; Chen, K.; Zhou, Y.; Tang, Z. Collaborative filtering and deep learning based recommendation
system for cold start items. Expert Syst. Appl. 2017, 69, 29–39. [CrossRef]
20. Wang, H.; Wang, N.; Yeung, D.Y. Collaborative deep learning for recommender systems. In Proceedings
of the 21th ACM SIGKDD International Conference on Knowledge Discovery and Data Mining, Sydney,
Australia, 10–13 August 2015; pp. 1235–1244.
21. Lee, H.; Lee, J. Scalable deep learning-based recommendation systems. ICT Express 2019, 5, 84–88. [CrossRef]
22. Da’U, A.; Salim, N. Recommendation system based on deep learning methods: A systematic review and
new directions. Artif. Intell. Rev. 2019, 53, 2709–2748.
23. Zuo, Y.; Zeng, J.; Gong, M.; Jiao, L. Tag-aware recommender systems based on deep neural networks.
Neurocomputing 2016, 204, 51–60. [CrossRef]
24. Zheng, L.; Lu, C.-T.; He, L.; Xie, S.; He, H.; Li, C.; Noroozi, V.; Dong, B.; Yu, P.S. MARS: Memory
attention-aware recommender system. In Proceedings of the 2019 IEEE International Conference on Data
Science and Advanced Analytics (DSAA), Washington, DC, USA, 5–8 October 2019; pp. 11–20.
25. Zhang, Q.; Wang, J.; Huang, H.; Huang, X.; Gong, Y. Hashtag Recommendation for Multimodal Microblog
Using Co-Attention Network. In Proceedings of the International Joint Conference on Artificial Intelligence,
Melbourne, Australia, 19–25 August 2017; pp. 3420–3426.
26. Yu, W.; Zhang, H.; He, X.; Chen, X.; Xiong, L.; Qin, Z. Aesthetic-based clothing recommendation.
In Proceedings of the 2018 World Wide Web Conference, Lyon, France, 23–27 April 2018; pp. 649–658.
27. Wu, Y.; Dubois, C.; Zheng, A.X.; Ester, M. Collaborative denoising auto-encoders for top-n recommender
systems. In Proceedings of the Ninth ACM International Conference on Web Search and Data Mining, San
Francisco, CA, USA, 22–25 February 2016; pp. 153–162.
28. Wu, S.; Ren, W.; Yu, C.; Chen, G.; Zhang, D.; Zhu, J. Personal recommendation using deep recurrent neural
networks in NetEase. In Proceedings of the 2016 IEEE 32nd international conference on data engineering
(ICDE), Helsinki, Finland, 16–20 May 2016; pp. 1218–1229.
29. Wang, Q.; Yin, H.; Hu, Z.; Lian, D.; Wang, H.; Huang, Z. Neural memory streaming recommender networks
with adversarial training. In Proceedings of the 24th ACM SIGKDD International Conference on Knowledge
Discovery & Data Mining, London, UK, 19–23 August 2018; pp. 2467–2475.
30. Wang, H.; Xiao, G.; Han, N.; Chen, H. Session-Based Graph Convolutional ARMA Filter Recommendation
Model. IEEE Access 2020, 8, 62053–62064. [CrossRef]
31. Zhang, M.; Yang, Z. GACOforRec: Session-Based Graph Convolutional Neural Networks Recommendation
Model. IEEE Access 2019, 7, 114077–114085. [CrossRef]
32. Wu, C.; Yan, M. Session-aware information embedding for e-commerce product recommendation.
In Proceedings of the 2017 ACM on Conference on Information and Knowledge Management, Singapore,
6–10 November 2017; pp. 2379–2382.
33. Li, G.; Chen, Q. Exploiting Explicit and Implicit Feedback for Personalized Ranking. Math. Probl. Eng. 2016,
2016, 1–11. [CrossRef]
34. Núñez-Valdez, E.R.; Quintana, D.; Crespo, R.G.; Isasi, P.; Herrera, F. A recommender system based on implicit
feedback for selective dissemination of ebooks. Inf. Sci. 2018, 467, 87–98. [CrossRef]
35. Chen, C.; Li, D.; Zhao, Y.; Lv, Q.; Shang, L. WEMAREC: Accurate and scalable recommendation through
weighted and ensemble matrix approximation. In Proceedings of the 38th International ACM SIGIR
Conference On Research And Development In Information Retrieval, Santiago, Chile, 9–13 August 2015;
2015; pp. 303–312.
36. Chen, W.; Gu, Y.; Ren, Z.; He, X.; Xie, H.; Guo, T.; Yin, D.; Zhang, Y. Graph Attention Networks. In Proceedings
of the International Conference on Learning Representations, Vancouver, BC, Canada, 30 April–3 May 2018.
37. Bahdanau, D.; Cho, K.; Bengio, Y. Neural machine translation by jointly learning to align and translate.
In Proceedings of the International Conference on Learning Representations, San Diego, CA, USA, 7–9
May 2015.Appl. Sci. 2020, 10, 5445 21 of 21
38. Xu, K.; Ba, J.; Kiros, R.; Cho, K.; Courville, A.; Salakhudinov, R.; Zemel, R.; Bengio, Y. Show, attend and tell:
Neural image caption generation with visual attention. In Proceedings of the International Conference on
Machine Learning, Lille, France, 6–11 July 2015; pp. 2048–2057.
39. Henaff, M.; Bruna, J.; LeCun, Y. Deep convolutional networks on graph-structured data. arXiv 2015,
arXiv:1506.05163.
40. Kipf, T.N.; Welling, M. Semi-supervised classification with graph convolutional networks. arXiv 2016,
arXiv:1609.02907.
41. Defferrard, M.; Bresson, X.; Vandergheynst, P. Convolutional neural networks on graphs with fast localized
spectral filtering. In Proceedings of the Advances in Neural Information Processing Systems, Barcelona,
Spain, 5–10 December 2016; pp. 3844–3852.
42. Handbook of Mathematical Functions with Formulas, Graphs, and Mathematical Tables; Abramowitz, M.; Irene, A.S.
(Eds.) US Government Printing Office: Washington, DC, USA, 1948; Volume 55.
43. Ying, R.; He, R.; Chen, K.; Eksombatchai, P.; Hamilton, W.L.; Leskovec, J. Graph convolutional neural
networks for web-scale recommender systems. In Proceedings of the 24th ACM SIGKDD International
Conference on Knowledge Discovery & Data Mining, London, UK, 19–23 August 2018; pp. 974–983.
44. The Cora dataset. Available online: https://graphsandnetworks.com/the-cora-dataset/ (accessed on 28
July 2020).
45. CodaLab Competition. Available online: https://competitions.codalab.org/competitions/11161 (accessed on
28 July 2020).
46. Cremonesi, P.; Koren, Y.; Turrin, R. Performance of recommender algorithms on top-n recommendation
tasks. In Proceedings of the Fourth ACM Conference on Recommender Systems, Barcelona, Spain, 26–30
September 2010; pp. 39–46.
47. Wang, P.; Guo, J.; Lan, Y.; Xu, J.; Wan, S.; Cheng, X. Learning hierarchical representation model for
nextbasket recommendation. In Proceedings of the 38th International ACM SIGIR conference on Research
and Development in Information Retrieval, Santiago, Chile, 8 August 2015; pp. 403–412.
48. Li, J.; Ren, P.; Chen, Z.; Ren, Z.; Lian, T.; Ma, J. Neural attentive session-based recommendation. In Proceedings
of the 2017 ACM on Conference on Information and Knowledge Management, Singapore, 6–10 November
2017; pp. 1419–1428.
© 2020 by the authors. Licensee MDPI, Basel, Switzerland. This article is an open access
article distributed under the terms and conditions of the Creative Commons Attribution
(CC BY) license (http://creativecommons.org/licenses/by/4.0/).You can also read


