Evaluating the impact of Minimum Unit Pricing (MUP) on population alcohol consumption and alcohol-attributable health harms - MESAS
←
→
Page content transcription
If your browser does not render page correctly, please read the page content below
MESAS

Evaluating the impact of Minimum
Unit Pricing (MUP) on population
alcohol consumption and alcohol-
attributable health harms

Study protocol
August 2019
This resource may also be made available
on request in the following formats:

      0131 314 5300
      nhs.healthscotland-alternativeformats@nhs.net

Published by NHS Health Scotland
1 South Gyle Crescent
Edinburgh EH12 9EB
© NHS Health Scotland 2020
All rights reserved. Material contained in this
publication may not be reproduced in whole
or part without prior permission of NHS
Health Scotland (or other copyright owners).
While every effort is made to ensure that
the information given here is accurate, no
legal responsibility is accepted for any errors,
omissions or misleading statements.
NHS Health Scotland is a WHO Collaborating
Centre for Health Promotion and Public
Health Development.
Contents
Version table .............................................................................................................. 2
1 Introduction and background ................................................................................... 3
1.1 Purpose of this paper .................................................................................... 3
1.2 Policy context ................................................................................................ 3
1.3 Evaluation of MUP ........................................................................................ 4
1.4 Existing research........................................................................................... 5
1.5 Research objectives ...................................................................................... 6
2 Work packages ....................................................................................................... 9
2.1 Work package 1: Sales-based consumption ................................................. 9
2.2 Work package 2: Hospital admissions and deaths ...................................... 16
2.3 Work package 3: Economic evaluation of the impact of MUP ..................... 24
3 Timetable and milestones ..................................................................................... 25
4 Outputs and dissemination .................................................................................... 26
5 Project management ............................................................................................. 29
5.1 Governance................................................................................................. 29
5.2 Project management ................................................................................... 29
5.3 Risk management ....................................................................................... 30
5.4 Quality assurance (QA) ............................................................................... 30
Appendix 1: Theory of change for MUP ................................................................... 33
Appendix 2: Example of decomposition of trends to ease visual interpretation ........ 34
Appendix 3: MESAS governance structure .............................................................. 35
References ............................................................................................................... 36
1Version table
Version Date Author/Editor Comments
1.0 06/04/2018 Mark Robinson
1.1 16/04/2018 Mark Robinson Changes made in response to
comments from the MUP Evaluation
Project Team
1.2 02/08/2018 Mark Robinson Changes made in response to
comments from the MUP
Consumption and Health Harms
EAG
1.3 01/03/2019 Mark Robinson Reframed from being a PID (to
inform discussion at the initial EAG)
to a Study Protocol. Removal of self-
reported consumption study now
being taken forward by MRC
SPHSU.
1.4 22/03/2019 Mark Robinson Changes made in response to
comments from Lucie Giles.
1.5 06/08/2019 Mark Robinson Changes made after internal review
and in light of EAG comments on the
calculation of AAFs. Timetable
updated after progress review.
21 Introduction and background
1.1 Purpose of this paper
The purpose of this study protocol is to provide an overview of our intended
approach to evaluating the impact of Minimum Unit Pricing (MUP) on population
alcohol consumption and alcohol-attributable health harms in Scotland.
1.2 Policy context
The scale of Scotland’s damaging relationship with alcohol is well documented. The
rate of deaths related to alcohol is among the highest in Western and Central
Europe 1 and, despite falling from a peak in 2003, rates remain twice as high as those
seen in England & Wales. 2 Recent estimates using Scotland-level data suggest that
alcohol was a causal factor in over 3,700 deaths and 41,000 hospital admissions,
and contributed to 8% of the overall disease burden. 3 This is driven by high levels of
population consumption levels relative to neighbouring GB countries. 4 Alcohol-
related heath harms are experienced most by those living in areas of high
deprivation, with stark inequalities in both mortality and hospital admissions caused
by alcohol.2
In recognition of the harm alcohol was causing to individuals, families, communities,
and society at large, the Scottish Government introduced a comprehensive package
of measures through its 2009 Framework for Action. 5 The strategy contained a range
of policy and legislative actions which, collectively, aimed to reduce population levels
of alcohol consumption and, in turn, associated levels of health and social harms.
This included the Alcohol (Minimum Pricing) (Scotland) Act (hereafter ‘MUP Act’),
which was passed in June 2012. Following a lengthy legal challenge, which ended
after the judgement of the Supreme Court in December 2017, the Scottish
Government implemented MUP on 1 May 2018 setting a minimum price of 50 pence
per unit (ppu), below which alcohol cannot be sold in Scotland.
31.3 Evaluation of MUP
The MUP Act includes a sunset clause, which requires that the legislation will expire
at the end of the sixth year of implementation unless the Scottish Parliament votes
for it to continue. To inform this decision there is a review clause, requiring the
Minister to put a review report before Parliament as soon as possible after the end of
the fifth year of implementation. The review report is required to assess the impact of
MUP on the five licensing objectives (concerned with crime, public safety, public
nuisance, public health and protecting children from harm) and on alcohol producers
and licence holders. Differential impact (by age, sex, deprivation and drinking status)
should be assessed where possible. Representatives of alcohol producers and
licence holders and those with a function related to health, prevention of crime,
education, social work, and children and young people must be consulted in the
preparation of the report for Parliament.
NHS Health Scotland has been commissioned by the Scottish Government to lead
this evaluation. We have therefore developed a portfolio of studies to evaluate MUP
(see our website for more details). * The evaluation is to be completed by 1
November 2023 at the latest and will form the basis of the review report.
Part of the evaluation is a package of studies concerned with the impact of MUP on
population alcohol consumption and alcohol-attributable health harms. Although the
portfolio of studies set up to evaluate the impact of MUP will assess outcomes
across the MUP Theory of Change (Appendix 1), the importance of a robust and
credible evaluation of its impact on health outcomes has been emphasised by senior
government officials and members of the MUP Governance Board overseeing the
overall evaluation. Indeed, much of the evidence that informed the legislation was
focused on the potential impacts on hospital admissions and deaths caused by
alcohol. 6,7
*
See www.healthscotland.scot/health-topics/alcohol/evaluation-of-minimum-unit-pricing
41.4 Existing research
There is strong and consistent evidence to show that increasing the price of alcohol,
thereby reducing its affordability, is an effective approach in reducing population
levels of alcohol consumption and related harms. 8 Increasing the level of tax applied
to alcohol is the most common approach to achieve such effects. However, other
fiscal policies can be used. In Canada, for example, a form of minimum pricing
applies across all ten provinces, though there is variation in the extent and frequency
to which different drink types and outlets are affected. 9 Evaluation of the impact of
minimum pricing in Canada has shown consistently that as alcohol prices increase,
there is an associated decrease in population consumption, hospital admissions and
deaths. Based on a 10% increase in the average minimum price across all drink
types, these findings are summarised below:
Consumption
• In British Columbia, a 3.4% decrease in overall alcohol consumption (as
measured by alcohol sales). 10 The size of the effect differed across drink
types.
• In Saskatchewan, which has the form of minimum pricing most like MUP, an
8.4% decrease in overall alcohol consumption. 11 Effects were most
pronounced in the off-trade and there was evidence of a shift in sales from
higher-strength to lower-strength products.
• It is worth noting that, in Saskatchewan, the effects observed resulted from
11% of products being affected by the price change. We have estimated that
47% of the volume of alcohol sold off-trade in Scotland was sold below 50ppu
in 2017.2
5Hospital admissions
• In British Columbia, an immediate 9% decrease in acute alcohol-attributable
hospital admissions; a 9% decrease in chronic alcohol-attributable hospital
admissions was detected two years later.10 *
Deaths
• In British Columbia, an immediate 32% decrease in wholly alcohol-attributable
deaths and evidence of effects continuing up to 12 months after the price
change. 12 Reductions in chronic and total alcohol-attributable deaths were
detected two–three years after the price change.
The minimum pricing model in Canada, as well as those that exist in other countries,
differ from the MUP legislation being implemented in Scotland, which will be the first
country in the world to introduce such an approach. The Sheffield Alcohol Policy
Model has estimated that a 50ppu will reduce alcohol consumption by 3% in
Scotland, leading to 121 fewer alcohol-attributable deaths and over 2,042 fewer
alcohol-attributable hospital admissions per year when the policy reaches its full
effect. 13 It is estimated that effects will be most pronounced among those drinking at
harmful levels, particularly those on lower incomes. However, as Scotland is the first
country to have introduced MUP, there have been no direct observations of its
impact on consumption and harm.
1.5 Research objectives
The overarching aim of this package of studies is to evaluate the impact of the
introduction of MUP on population levels of alcohol consumption and alcohol-
attributable health harms in Scotland. We propose that this component of the MUP
evaluation will be divided into separate work packages (WPs), each with distinct
aims and research questions. These are listed below with a more detailed
description of the proposed approach for each WP provided in Section 2.
*
Acute conditions refer to those caused by intoxication; chronic conditions are those caused
by sustained alcohol consumption over longer time periods.
6Throughout, we will follow MRC guidelines on best practice for conducting
evaluations of natural experiments. 14
1.5.1 WP1: Sales-based consumption
Aim
• To evaluate the impact of MUP on the volume of pure alcohol sold in Scotland
using alcohol retail sales data.
Research questions
• What is the impact of the introduction of MUP on the volume of pure alcohol
sold in Scotland?
• What is the impact of the introduction of MUP on the volume of pure alcohol
sold by off-trade retailers in Scotland?
• What is the impact of the introduction of MUP on the volume of pure alcohol
sold by on-trade retailers in Scotland?
• To what extent does any impact of the introduction of MUP on the volume of
pure alcohol sold in Scotland vary by drink type?
1.5.2 WP2: Hospital admissions and deaths
Aim
• To evaluate the impact of MUP on alcohol-attributable hospital admissions
and deaths in Scotland using administrative data.
Research questions
• What is the impact of the introduction of MUP on alcohol-attributable hospital
admissions in Scotland?
• What is the impact of the introduction of MUP on alcohol-attributable deaths in
Scotland?
• To what extent does any impact of the introduction of MUP on alcohol-
attributable hospital admissions and deaths vary by sex, age group and
socioeconomic deprivation?
71.5.3 WP3: Economic evaluation
The feasibility of conducting an economic evaluation of the impact of MUP will be
undertaken by NHS Health Scotland. This will inform a decision about whether to
carry out an economic evaluation.
82 Work packages
2.1 Work package 1: Sales-based consumption
2.1.1 Study design
Alcohol sales data provide the most accurate means of estimating population
consumption levels. 15 Using commercial data on alcohol retail sales, WP1 will use a
natural experimental design with interrupted time series analytical methods to assess
whether the introduction of MUP is associated with changes in the level or trend of
the volume of pure alcohol sold in Scotland. Data for England and Wales (combined)
(hereafter England/Wales) will be used as the primary geographical control group;
subnational English regions will be used in supplementary analyses. We will assess
the impact of MUP on overall alcohol retail sales and for different trade sectors and
drink types separately. We will adjust statistical models to account for seasonal and
secular trends, as well as other important confounders (e.g. disposable income).
2.1.2 Outcome measures
We will have three main outcome measures in WP1:
• Volume (Litres) of pure alcohol sold per adult in the off-trade (primary
outcome measure)
• Volume (Litres) of pure alcohol sold per adult (primary outcome measure)
• Volume (Litres) of pure alcohol sold per adult in the on-trade (secondary
outcome measure)
These will be considered overall and for individual drink categories (i.e. beer, spirits,
wine, cider, perry, fortified wine, and RTDs).
92.1.3 Data
Off-trade alcohol sales data
We will use off-trade alcohol retail sales data obtained from market research
company, Nielsen. Nielsen is a global information and measurement company with a
leading position for the collation, analysis and provision of alcohol sales data.
Nielsen estimates retail sales in Great Britain using electronic sales records from
large retailers (retailers with ten or more retail shops operating under common
ownership) and a weighted stratified random sample of smaller ‘impulse’ retailers
(retailers in which the consumer mainly uses the store for impulse or top-up
purchases i.e. not the main grocery shop). It is estimated that large, multiple retailers
account for approximately 80% of total off-trade alcohol sales in Scotland.
As part of the MESAS work programme, Nielsen has provided NHS Health Scotland
with off-trade alcohol sales data since 2010. Weekly data on the volume of alcohol
sold (in litres of natural volume), by drink type, are available for Scotland and
England/Wales from January 2009 and for north-west (NW) and north-east (NE)
England from January 2012. Nielsen is currently contracted by NHS Health Scotland
to continue to provide these data until 2021/22 meaning data will be available up
until the end of calendar year 2021.
On-trade alcohol sales data
We will use on-trade alcohol retail sales data obtained from market research
company, CGA Strategy. CGA is a market measurement, data and research
consultancy company specialising in the out-of-home food and drink market. CGA
estimate on-trade alcohol sales in Great Britain using a combination of delivery,
sales, and survey data.
As part of the MESAS work programme, CGA has provided NHS Health Scotland
with on-trade alcohol sales data since 2010. Data on the volume of alcohol sold (in
litres of natural volume) for four-weekly periods, by drink type, are available for
Scotland, England/Wales and English regions from January 2008. CGA is currently
10contracted by NHS Health Scotland to continue to provide these data until 2021/22
meaning data will be available up until the end of calendar year 2021.
Data robustness
We have previously performed detailed critiques of the validity and reliability of
alcohol retail sales data for monitoring population levels of alcohol consumption in
Scotland, 16,17 including a comprehensive description of the sampling methods used
by Nielsen/CGA to collect alcohol sales data.16 Although concluding that alcohol
retail sales data provide a robust source of data for estimating population
consumption, the work identified a number of important biases that can lead to either
under or over-estimation of population consumption levels in Scotland. Using data
for 2013, we estimated that the net effect of these biases was to underestimate
population consumption by 7%, which represented an increase from 3% in 2010.17
Over time, unrecorded alcohol and wastage remained the largest sources of bias.
However, the research illustrated how biases can change over time and how new
data sources can improve the accuracy of bias estimates. We therefore plan to
update our estimates of the size of these biases as part of this work package and to
draw on the results from other studies as part of the overall MUP evaluation that may
help in this regard.
From September 2011, Nielsen was no longer able to estimate off-trade sales by
discount retailers, Aldi and Lidl. In order to enable NHS Health Scotland to present
trends in population alcohol consumption levels established prior to 2011, we have
adjusted the data we receive using estimates of the alcohol market share of Aldi/Lidl
obtained from consumer panel data. In 2016, we estimated that the alcohol market
share of Aldi/Lidl in Scotland was 12%, increasing from 8% in 2011. We are currently
exploring the strengths and limitations of different consumer panel datasets for
estimating the market share of Aldi/Lidl as part of our ongoing monitoring of alcohol
sales in Scotland. As Aldi/Lidl sell a range of alcohol products at the lower end of the
price distribution, which will be most affected by MUP, it will be important to consider
adjustment of the off-trade sales data as part of WP1.
112.1.4 Confounders
We intend to adjust our statistical models for the potentially confounding effects of
income as this interacts with alcohol prices to determine alcohol affordability. Other
covariates, such as overall consumer spending, will also be considered. Quarterly
gross disposable household income data will be obtained for Scotland and
England/Wales and expressed per adult.
In our study that evaluated the impact of the Alcohol Act on off-trade alcohol sales,
we also adjusted our models for alcohol prices. Such adjustment was also done by
Stockwell and colleagues10,11,18 when they evaluated the impact of minimum pricing
(not MUP) in Canada. In consultation with the Consumption and Health Harm EAG,
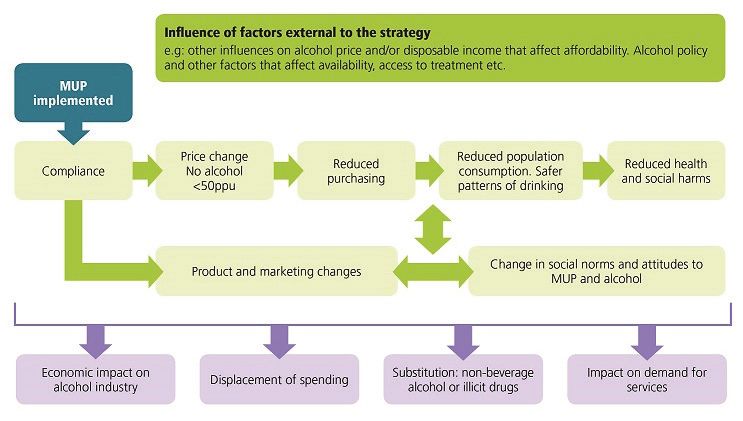
we have decided not to include price as a covariate. As shown in the Theory of
Change (Appendix 1), this is because the purpose of MUP is to increase alcohol
prices; adjusting for changes in prices would therefore represent over-adjustment.
2.1.5 Study period
In WP1, we will include data from January 2013 to April 2021. This provides us with
data for over five full years before, and three full years after, the implementation of
MUP.
When using interrupted time series analysis to evaluate natural experimental
designs, longer pre-intervention time periods can strengthen causal inferences by
enabling better control of secular trends. As noted above, we have access to weekly
off-trade alcohol sales data from 2009 (for Scotland and England/Wales only) and
four-weekly on-trade alcohol sales data from 2008. However, for the purposes of this
study we will use data for both sectors from January 2013 only for three main
reasons:
1 It enables consistency in the time periods used for each sector.
2 It provides us with the option of using data for subnational English regions if
necessary (e.g. sensitivity/supplementary analysis).
123 The Alcohol Act in Scotland was introduced in October 2011 and we have
previously demonstrated that it was associated with a reduction in the volume
of pure alcohol sold off-trade in Scotland in the 12-month period after it was
introduced, particularly off-trade wine. 19
2.1.6 Analysis
The analytical approach described below is largely based on the approach we took
when evaluating the impact of the Alcohol Act on off-trade alcohol sales.19 We will
publish a separate, more detailed analysis plan for this WP.
Conversion of natural volumes to pure alcohol volumes
Natural volume sales will be converted into pure alcohol volumes using alcohol-by-
volume (ABV) percentages for each drink type. The ABV used will be based on the
typical strength of drinks sold in that category as provided by the data suppliers. As
part of the MESAS monitoring programme we have sourced more detailed ABV data
at product level. We will explore whether these data can be used to refine our
estimates of category-level ABV, though this will only be possible for more recent
data (i.e. not as far back as 2013).
Expressing alcohol sales per adult
The volume of pure alcohol sold per adult (≥16 years) will be calculated using official
mid-year population estimates available from National Records Scotland and the
Office for National Statistics. Weekly and four-weekly population estimates (for off-
trade sales and on-trade/total sales, respectively) will be interpolated.
We have previously been challenged on using ‘alcohol sales per adult’ as our key
outcome measure, rather than ‘alcohol sales per adult drinker’. The latter would take
into account differences in the prevalence of non-drinkers between Scotland and
England/Wales. While the MUP Act is a targeted measure aimed at reducing
consumption among the heaviest drinkers, Scotland’s overall alcohol strategy is
aimed at reducing average population levels of consumption. For the purposes of
this WP, we propose to use the population that includes non-drinkers in the
denominator. This is consistent with previous studies on the impacts of minimum
13pricing on population alcohol consumption in Canada.10,11,18 We will, however,
express alcohol sales per adult drinker in sensitivity analysis.
Aligning time periods with the MUP implementation date
MUP was implemented on Tuesday 1 May 2018. Both Nielsen and CGA report data
in time periods that end on a Saturday meaning that the MUP implementation date
will fall in the middle of their reporting periods. This will be a particular problem for
the four-weekly on-trade data as the MUP implementation date falls in the middle of
the four-weekly reporting period. The best approach to address this will be discussed
among the project team and EAG.
Descriptive analysis
Data for our outcome measures will be initially analysed descriptively to enable
trends and other key information to be presented in tables and figures. In addition, to
ease visual interpretation of trends, the time series for each primary outcome will be
decomposed into trend and seasonal components. We used this approach to
present trends in alcohol-related mortality rates in an earlier paper20 (see Appendix
2). This will also be important for ensuring that the pre-implementation trends in
Scotland and control groups are similar, a pre-requisite when using interrupted time
series analysis for evaluating natural experiments. 21
Statistical analysis
We will use controlled interrupted time-series methods to assess the impact of MUP
on the volume of pure alcohol sold per adult in Scotland. Interrupted time series
methods provide one of the most robust quasi-experimental study designs, enabling
underlying temporal and seasonal trends to be accounted for. 22 It is expected that
Seasonal Autoregressive Integrated Moving Average (SARIMA) techniques will be
employed, consistent with how we evaluated the Alcohol Act.19 The analyses will be
stratified by trade sector to preserve statistical power for the off-trade outcome
measure, which is determined by the number of temporal data points. We will also
run separate models by drink type.
14Our analytical strategy will consist of initially modelling the alcohol sales data time-
series to obtain an adequate preliminary model and then modelling and testing the
effect of the intervention. Several candidate models will be investigated using graphs
and autocorrelation plots of the stationary time-series and its errors with the most
appropriate and parsimonious model selected using the Akaike Information Criterion
(AIC).
To analyse the magnitude and statistical significance of the effect that the
intervention had on alcohol sales in Scotland, we will include a binary explanatory
variable, with the value of zero for the time before MUP is introduced (January 2013
to April 2018) and the value of one after the introduction of MUP (May 2018 to April
2021).
There may be an anticipatory effect before MUP is introduced. In addition, there may
be differences in the immediate to short-term (i.e. within 6 months) and medium-term
impact (6 months to 3 years) post-implementation or there may be lagged effects. 23
We will explore how to incorporate such time factors into the analysis, drawing on
intelligence from other MUP evaluation studies if necessary.
Analyses will be performed with and without adjustment for potential confounders.
Covariates entered into adjusted models will include:
• Disposable income (in all models)
• On-trade sales (for off-trade models to account for substitution)
• Sales of other alcoholic drink types (in models of specific drink types to
account for substitution)
To enable comparison with a control group in our Alcohol Act study,19 we entered the
time-series of corresponding alcohol sales in England/Wales as a covariate in the
ARIMA models for Scotland.
In line with STROBE guidance, 24 we will present results from both unadjusted and
adjusted models.
15Sensitivity and supplementary analyses
We plan to perform a number of additional analysis to test the robustness of our
results:
• We will assess the impact of applying adjustment factors to off-trade alcohol
sales data to account for the exclusion of sales by Aldi and Lidl.
• We will test the robustness of the timing of any effect (if an effect is detected)
by varying the date of implementation (i.e. false legislation dates). Such
falsification tests are useful for assessing the plausibility of attribution of
effects by checking effect specificity.21 The analysis plan, which will be
published ahead of analysing the post-implementation data, will specify
falsification dates.
• We will repeat our analyses using NW and NE England as geographical
controls. This is because it has been suggested that Northern England is a
more appropriate control group for Scotland than England/Wales due to a
more similar socio-demographic make-up and alcohol culture (perhaps
reflecting a similar industrial history). 25
2.2 Work package 2: Hospital admissions and deaths
2.2.1 Study design
Using routine administrative time-series data, WP2 will use a natural experimental
design to assess the impact of MUP on hospital admissions and deaths caused
wholly or partially by alcohol in Scotland. Data for England will be explored as the
primary geographical control group; data for subnational English regions may be
used in supplementary analyses. If a geographical control with a similar pre-
intervention trend is not available, we will use deaths and admissions not caused by
alcohol as a non-equivalent control group. We will assess the impact of MUP on
overall deaths and admissions and also stratify our analysis by sex. 26 Other
subgroup effects may be explored based on evidence-informed expectations of
differential impacts, or if there is evidence of an interaction with the intervention (this
16will depend on the specific analytical approach). We will adjust statistical models for
sociodemographic characteristics, seasonality and underlying trend.
2.2.2 Outcome measures
The main outcome measures in WP2 will be:
• All wholly alcohol-attributable deaths/admissions
• Acute wholly alcohol-attributable deaths/admissions
• Chronic wholly alcohol-attributable deaths/admissions
• All alcohol-attributable deaths/admissions (those wholly and partially caused
by alcohol)
• All acute alcohol-attributable deaths/admissions
• All chronic alcohol-attributable deaths/admissions
• A selection of condition-specific outcomes (these will be specified in the
analysis plan and will likely include alcoholic liver disease and acute
withdrawal).
To estimate alcohol-attributable hospital admissions and deaths we will consider the
condition specific estimates of alcohol attributable fractions (AAFs) previously
produced for Scotland3 and England, 27,28 as well as the recent update to the list of
conditions caused by alcohol produced by Angus et al. 29 We will also consider use of
the International Model of Alcohol Harms and Policies (InterMAHP). The final
approach will be specified in the analysis plan. Conditions will be categorised as
either wholly or partially caused by alcohol, and as either acute or chronic, in
accordance with Angus et al.29
These outcome measures will be expressed as rates as detailed in Section 2.2.6.
We will specify which of these measures are primary and secondary outcomes in our
analysis plan. Wholly alcohol-attributable outcomes are likely to be the primary
outcome measures.
172.2.3 Data
Deaths data
National Records for Scotland (NRS) maintain a record of all deaths that occur in
Scotland and these individual level data are provided to NHS Health Scotland under
a data sharing agreement. These data provide the cause of death as classified by
the International Classification of Diseases (ICD) and include details of
sociodemographic characteristics. We will use these data to determine the number
of deaths occurring monthly for each outcome measure across the study time period
and by sex, age group, and socioeconomic deprivation. Equivalent data for England
(including subnational regions) will be obtained by submitting a request to the Office
for National Statistics.
Hospital admissions data
To assess the impact of MUP on alcohol-attributable hospital admissions in
Scotland, we will use the Scottish Morbidity Record, a national data scheme that
records comprehensive information relating to all inpatients and day cases admitted
to either general acute or psychiatric hospitals in Scotland. We will obtain monthly
data on the number of admissions by sex, age group, socioeconomic deprivation and
condition. Data on hospitalisations for England (including subnational regions) will be
obtained by submitting a request to NHS Digital.
Data robustness
The data on deaths and admissions used in WP2 have complete national coverage
and are likely to accurately estimate the true number of alcohol-related deaths and
hospital admissions in Scotland and comparator areas. 30
We do not propose to include alcohol-attributable emergency department
attendances that do not result in a hospital admission, mainly because of concerns
over reliability, completeness and comparability with other countries. In addition,
alcohol-attributable emergency department attendances will be assessed in another
MUP evaluation study (see Section 2.2.7).
18Data comparability
Data on deaths are collected using similar methods and standards across the UK; 31
however, hospital admissions are defined differently. In Scotland, hospital records
can include up to six diagnostic codes whereas in England there can be up to 20.
There are also differences related to coding practices and coverage (e.g. private
patients treated in NHS hospitals), which can change differently over time.
Exploratory work by ISD Scotland has investigated options for more comparable
measures between Scotland and England (unpublished).
In our previous work assessing the impact of the Alcohol Act on hospital admissions
in Scotland,19 we used data at the individual patient level, counting each person only
once in each time period even if they had multiple admissions. We also included only
ICD-10 codes that were wholly attributable to alcohol in the primary diagnostic
position. While these steps helped to make data more comparable between Scotland
and England, they also considerably reduced the number of events in our analysis
and meant that it was not possible to assess the impact of the legislation on the
wider range of deaths and hospital admissions that are partially attributable to
alcohol as has been done in other studies (e.g. Kisely et al, 32 Stockwell et al,9 Zhao
et al12).
Clearly there are pros and cons of the different options to expressing and analysing
hospital admission data. If we use data at the hospital admission level rather than
the patient level then we increase the number of events in our analyses and account
for the fact that patients may experience multiple admissions attributable to alcohol
in any given period. Similarly, if we include ICD-10 codes in all diagnostic positions,
the approach taken for national reporting in Scotland,30 we are more likely to capture
the true extent of alcohol-attributable hospital admissions. However, with each of
these options, comparability with our geographical control group may be
compromised.
Another important issue in this WP is the application of AAFs to calculate partially
and wholly alcohol-attributable admissions. It could be argued that totalling the
number of admissions attributable to alcohol in the population would provide
19misleading results as people would be counted multiple times for the same
conditions and for different conditions (i.e. it would take no account of comorbidity).
This is particularly the case for chronic conditions. The counterargument to this is
that continued drinking is more likely when alcohol affordability is high and this is
more likely to exacerbate conditions, resulting in multiple presentations and impeded
recovery (Stockwell, personal communication).
These options will be considered further by the project team in consultation with the
EAG, with final decisions detailed in the analysis plan.
2.2.4 Confounders
Confounding will occur if any variable has a differential effect on outcome measures
between Scotland and the geographic control. In our previous study, we adjusted
regression models for age group, sex and socioeconomic deprivation. We will
explore the potential inclusion of other confounding variables in consultation with the
EAG.
2.2.5 Study time period
In WP2, we will include data from January 2012 to April 2021. This provides us with
data for over six years before, and three full years after, the implementation of MUP.
When using interrupted time series analysis to evaluate natural experimental
designs, longer pre-intervention time periods can strengthen causal inference by
enabling better control of secular trends.14 Although data are available from 2001
(using ICD-10), based on our experience of evaluating the impact of the Alcohol Act
on admissions and deaths, we propose that the length of the pre-intervention period
is curtailed because:
1 This will reduce the number of inflection points in the time series of the
outcome measures, which can make fitting models challenging.
2 This marks the end of the steep downward trend in deaths caused by alcohol
in Scotland which, in turn, may help to make the pre-intervention trends more
similar between Scotland and England.
202.2.6 Analysis
Descriptive analysis
We will calculate the rate of each of our outcome measures during each calendar
month in each population subgroup. Monthly population counts for each subgroup
will be estimated using interpolation of mid-year estimates. Data for the outcome
measures will first be analysed descriptively to enable trends and other key
information to be presented in tables and charts. In addition, as described in WP1,
the time series for each outcome will be decomposed into trend and seasonal
components to ease visual interpretation of trends.
Statistical analysis
There a number of different analytical approaches that could be taken in WP2. When
we used a similar study design to evaluate the impact of the Alcohol Act on alcohol-
related (i.e. wholly attributable) hospital admissions and deaths in Scotland, we
modelled the data using Negative Binomial General Linear Methods.20 The key
covariates in the model were: a dummy variable to indicate whether the outcome
was for the intervention or control group; and a dummy variable to indicate whether
the event occurred in the pre- or post-intervention period. The interaction between
these two variables was the Difference in Difference (DiD) estimate of percentage
change in outcome measures attributable to the Alcohol Act. Interactions between
the intervention variable and population subgroups were used to explore differential
impacts.
Other approaches to our analysis for WP2 might include:
• ARIMA models, as used in WP1. These offer a powerful and flexible
approach, particularly in terms of accounting for secular and seasonal trends
in the data series and examining lagged effects of the intervention. However,
adjustment could not be made for sociodemographic characteristics (though
rates in the outcome series could be age/sex standardised). Thus, to explore
any differential impact of MUP by sociodemographic characteristics,
numerous separate models would be required.
21• A synthetic control approach where a synthetic control area is created based
on the weighted composite of real areas (e.g. admissions and deaths in
subnational regions of England) to provide a more closely matched control.
However, this approach is less useful when the exposed population is an
outlier in the outcome variable of interest,21 which is the case in terms of
deaths in Scotland compared with rest of the UK.2
• A ‘mixed model’ approach as used by Stockwell and colleagues10 when
assessing the relationship between minimum alcohol prices and health harm
outcomes in Canada. This combines cross-sectional estimates of a range of
variables (e.g. outlet density), which are adjusted for when analysing the time
series data. The extent to which this approach is relevant in the Scottish
context would need to be explored.
Irrespective of the analytical approach taken, we will aim to assess both immediate
and lagged effects. This is consistent with the work of Stockwell and colleagues who
have found both immediate and lagged effects of changes in minimum alcohol prices
depending on the outcome assessed (i.e. acute versus chronic alcohol-attributable
admissions and deaths).10,12 Throughout WP2, final models will be used to estimate
absolute and relative effects of the implementation of MUP in Scotland.
There is an argument that more than one analytical method should be used. The
recent renewed focus on scientific replication has highlighted the need to strengthen
the reliability of research findings. 33 This is particularly salient in the field of public
health where the use of ecological, observational studies can make results uncertain
and attributing causality challenging. A previous study that assessed the impact of
minimum pricing in Canada12 tested the robustness of their key findings by applying
a different analytical method to the same data. We therefore propose that the results
from the main analytical method chosen for WP2 (e.g. Negative Binomial GLM) are
validated using a different method (e.g. ARIMA). This will be described in more detail
in the analysis plan.
22Sensitivity and supplementary analyses
We plan to perform a number of additional analyses to test the robustness of our
results:
• We will test the robustness of the timing of any effect (if an effect is detected)
by varying the date of implementation (i.e. false legislation dates). Such
falsification tests are useful for assessing the plausibility of attribution of
effects by checking effect specificity.21
• We will repeat our analyses using NW and NE England as geographical
controls. This is because it has been suggested that Northern England is a
more appropriate control group for Scotland than England or England/Wales
due to a more similar socio-demographic make-up and alcohol culture
(perhaps reflecting a similar industrial history).4
• We will test the robustness of any key results from the main analytical
approach using an alternative analytical method.
2.2.7 Other studies assessing WP2 outcomes
Other studies that form part of the MUP evaluation will assess its impact on health
harms caused by alcohol:
University of Glasgow NIHR funded study: Consumption and health service
impacts of MUP
• This study includes an audit of alcohol-related emergency department
attendances in a sample of hospitals in Scotland and England.
University of Stirling CSO funded study: Impact of Minimum Pricing of Alcohol
on Ambulance Call-outs in Scotland (IMPAACT)
• This study will assess the impact of MUP on alcohol-related ambulance call-
outs.
232.3 Work package 3: Economic evaluation of the impact of
MUP
2.3.1 Study design
A feasibility assessment will consider whether and what kind of economic evaluation
would be possible, taking into account data availability and timescales.
A range of approaches to economic evaluation are potentially possible. Cost-benefit
or cost-consequence approaches would use data from other studies in the portfolio
on a range of health benefits such as reductions in alcohol-attributable deaths or
reduced incidence of other alcohol-attributable conditions. These approaches could
also include data on non-health benefits such as reduced crime or reduced harms to
children. Cost-benefit analysis would seek to value these changes in monetary
terms. This is methodologically challenging and time consuming, but enables the
benefits of the policy (net of any outcomes that are worse as a result of MUP) to be
compared directly to the costs. Cost-consequence analysis would simply present
data on an array of impacts from studies across the portfolio. This is easier to do but
provides a less clear overall assessment of whether the policy is, on balance,
worthwhile in the sense that the benefits outweigh the costs.
A narrower approach would be to carry out cost-utility analysis using health outcome
measures such as quality adjusted life years. These would need to be estimated
from changes in mortality observed in the harms study adjusted for changes in
quality of life. This would involve methodological challenges that will be explored
further.
All types of evaluation would require data on costs. Thought will be given to the
perspective relevant to costing in each of the types of economic evaluation. A
broader perspective would include changes in economic costs to society as a whole
(e.g. due to impacts on industry or reduced costs of alcohol-related harms). A
narrower perspective might just include direct policy costs.
We will scope the feasibility of each of these options and update the evaluation
portfolio as appropriate. Scoping will take place in 2019.
243 Timetable and milestones
An indicative timetable for the WPs included in the Consumption and Health Harm
evaluation is provided in the GANNT chart on page 28. The timings are driven by
data availability, the proposed study time period, and the deadline for publishing the
final MESAS MUP Evaluation report (1 November 2023).
The key milestones for WP1 and WP2 are noted below:
WP1 Sales-based consumption
• Baseline data obtained and prepared by September 2019.
• Modelling approach agreed and analysis plan published by December 2019.
• Report summarising descriptive analysis of sales data in 12 month post-MUP
period published by November 2019.
• Final data for study time period received in June 2021.
• Final data analysis and reporting by March 2022.
WP2 Hospital admissions and deaths
• Pre-MUP data (but not full baseline period) obtained and prepared by
December 2019.
• Modelling approach agreed and analysis plan published by June 2020.
• Final data for study time period received in January 2022.
• Final data analysis and reporting by December 2022.
254 Outputs and dissemination
The ultimate aim of this package of studies is to produce findings that will inform the
MUP Evaluation Final Report. The primary audience for the evaluation of MUP is
Scottish Ministers and the Scottish Parliament. However, the findings will be high
profile and of interest to a much wider range of stakeholders.
Consistent with the approach we have taken as part of the wider MESAS
programme, we are committed to publishing our work as open access academic
papers in high-impact, peer-reviewed journals. This will help to increase the critical
appraisal, reach and credibility of our work. We will attempt to do this alongside the
reporting required to inform the MUP Evaluation Final Report being published in
November 2023 to allow submission as soon as possible after our findings are
finalised.
The key outputs from this component of the MUP evaluation are listed below:
• Analysis plans for WP1 and WP2. These will be published on the NHS
Health Scotland website and may be pre-registered elsewhere (e.g. on the
Open Science Framework). This represents good practice in public health
research as analytical decisions are made transparent prior to observing the
final data.33 In addition, journals are increasingly requesting pre-registered
analysis plans as part of the submission process.
• Descriptive analysis of 12-month post-MUP sales data. This will be
published on the NHS Health Scotland website.
• WP1 final report. This will be a detailed report that is used to inform the MUP
Evaluation Final Report. We will be required to publish this either prior to, or
alongside, the MUP Evaluation Final report
• WP1 journal paper. This will be largely based on the WP1 final report and
will be submitted as soon as possible after the findings are finalised.
26• WP2 final report. This will be a detailed report that is used to inform the MUP
Evaluation Final Report. We will be required to publish this either prior to, or
alongside, the MUP Evaluation Final report
• WP2 journal paper. This will be largely based on the WP2 final report and
will be submitted as soon as possible after the findings are finalised.
Throughout the course of the study, we will also take the opportunity to disseminate
other aspects of the work as stand-alone reports, academic papers, or conference
presentations if felt worthwhile by the EAG and on the basis we have sufficient staff
capacity.
In our written reports and papers, we will use appropriate checklists to improve the
quality and transparency of our reporting (e.g. STROBE24).
2728
5 Project management
5.1 Governance
Good governance is required to ensure:
• the evaluation is, and is perceived to be, impartial, robust, useful and credible
by stakeholders, Scottish Ministers and ultimately by the Scottish Parliament
• the portfolio of studies in the evaluation is necessary and sufficient
• the evaluation is delivered on time, scope and budget.
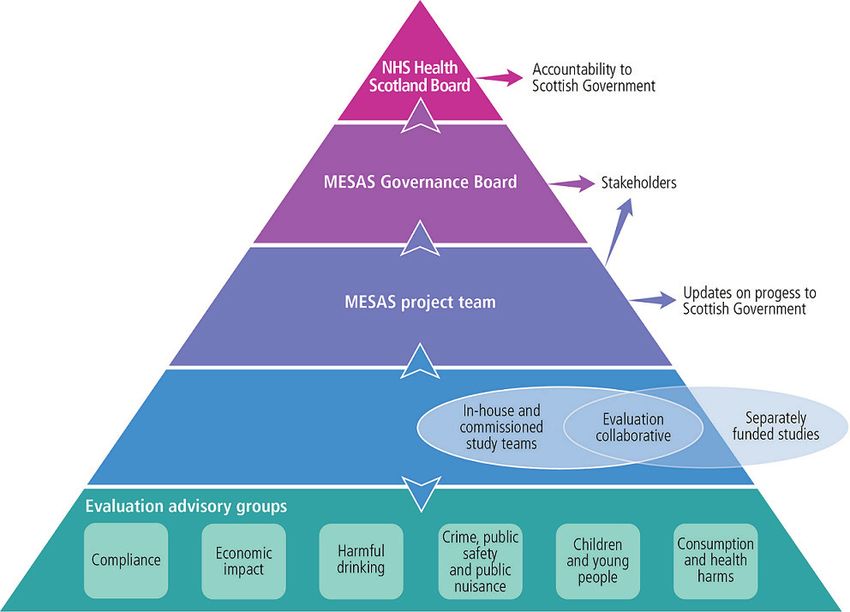
The governance structure for the overall MUP Evaluation is presented in Appendix
3.
5.2 Project management
The project will be managed by a Project Lead who will be responsible for:
• overseeing project progress
• leading the development of the study protocol and analysis plan
• supporting WP leads to identify, analyse and resolve risks and issues
• reporting progress to the Consumption and Health Harm EAG, the MESAS
Governance Board and the Scottish Government, as appropriate
• supporting the Chair of the Consumption and Health Harm EAG in planning
and preparing meetings
• chairing regular project team meetings.
WP leads will be responsible for:
• leading specific work packages
• supervising project team staff
• undertaking detailed planning
29• delivering specific activities in line with the project plan
• maintaining detailed documentation
• reporting progress to the Project Lead during regular meetings.
Regular Project Team meetings will be scheduled to assess project progress, the
status of project risks, and any issues that have arisen. A Decision Log and Issues
Log will be developed and maintained. This will be shared with the EAG who will
meet two–three times per year.
All Project Team members will attend the wider MUP Evaluation Project Team at
NHS Health Scotland who meet on a regular basis.
5.3 Risk management
An initial high-level risk register for the package of studies included in this project is
provided in Table 1 below. This will be maintained and refined as the project
progresses.
5.4 Quality assurance (QA)
A number of processes are in place to ensure that our work is sufficiently quality
assured:
In addition to the QA processes applied by the data providers, we will apply further
data quality checks to identify potentially erroneous data.
• We will maintain Issues and Decision Logs, which will be shared with the EAG
at meetings.
• The EAG will advise on and quality assure the methods and approaches we
have proposed, and help with problem solving throughout the project.
• The Project Lead and MUP Evaluation Lead will review all key outputs.
• Draft reports will be peer-reviewed by experts in the field, including members
of the EAG as appropriate.
30Table 1: High-level risk register
Risk descriptor Likelihood Impact Mitigating action
As a result of poor project Low/medium High We have developed a detailed
management we fail to deliver study protocol, specifying key
robust findings that can be tasks, milestones and deadlines;
used in the sunset process on we will use project management
time, scope and budget, tools and approaches
thereby damaging our throughout the project; the
reputation and limiting our project will be adequately
scope to influence evidence- resourced to meet demands on
informed decision making. time; progress reporting to EAG,
SG and Governance Board
As a result of inadequate Low High We have in place an EAG,
governance we fail to deliver independently chaired; the
an evaluation that is overall MUP Evaluation is
recognised to be robust, overseen by a Governance
credible and independent, Board; we have a Memorandum
thereby damaging our of Agreement with the Scottish
reputation and limiting our Government detailing
scope to influence evidence- expectations around reporting;
informed decision making. the MUP Evaluation comms and
engagement plan promotes
transparency.
Team illness or absence Low Medium The evaluation is a priority for
results in delays to the project. Health Scotland and is well
resourced; additional resource
could be added at short notice if
required.
There is an insufficient level of High Medium We have a Service Level
data management and Agreement with the University of
statistical analysis expertise Glasgow for the provision of
within the Project Team to fully specialist statistical support and
deliver the tasks required. the manager of this service is a
member of the EAG;
The expiration in March 2019 High Medium tbc
of the SLA between Health
Scotland and the University of
Glasgow for the provision of
specialist statistical support
results in discontinuity.
Delays in obtaining the Low/medium High We have worked with
required data impact on study Nielsen/CGA for many years
time periods. and they have consistently
delivered data on time and on
scope; we have agreed dates for
delivery of future alcohol sales
data; we will submit our requests
for deaths and admissions data
31Risk descriptor Likelihood Impact Mitigating action
as early as possible and seek
agreement for timing of delivery
(this will be particularly important
for the post-implementation
data); we will explore the
potential to set up a
Memorandum of Agreement with
ISD Scotland for the delivery of
Scottish admissions data as this
worked well in the first phase of
MESAS; if necessary, Health
Scotland employees will request
honorary contracts with ISD to
access their datasets.
Problems with the quality of Low Medium We have worked with
the data supplied. Nielsen/CGA for many years
and have developed a good
understanding of their methods
and QA processes; hospital
admissions and deaths data are
National Statistics and, as such,
are subject to intensive QA
processes; we will apply our
own QA processes and sense
checks to data we receive.
As a result of failure to use Low High We have established an EAG
appropriate research methods that includes academic experts
and analytical techniques, our across a number of relevant
project produces findings that fields; our proposed methods
will be questioned on their and draft outputs will peer-
robustness. reviewed; we will seek specific
advice from experts if deemed
necessary.
32Appendix 1: Theory of change for MUP
33Appendix 2: Example of decomposition of
trends to ease visual interpretation
Figure 1: Trends in crude alcohol-related death rates in Scotland and England &
Wales (a) and the decomposed seasonal (b) and trend (c) components, January
2001 and December 2013
Alcohol Act
(a) introduced
(b)
(c)
34Appendix 3: MESAS governance structure
35References
1 Whyte B and Ajetunmobi T. Still ‘the Sick Man of Europe’? Scottish mortality in a
European context 1950–2010. An analysis of comparative mortality trends. Glasgow:
Glasgow Centre for Population Health; 2012.
2 Giles L and Robinson M. Monitoring and Evaluating Scotland’s Alcohol Strategy:
Monitoring report 2018. Edinburgh: NHS Health Scotland; 2018.
3 Tod E, Grant I, Wyper G et al. Hospital admissions, deaths and overall burden of
disease attributable to alcohol consumption in Scotland. Edinburgh: NHS Health
Scotland; 2018.
4 Robinson M, Shipton D, Walsh D et al (2015). Regional alcohol consumption and
alcohol-related mortality in Great Britain: novel insights using retail sales data. BMC
Public Health, 15 1-2458-15-1.
5 The Scottish Government. Changing Scotland’s relationship with alcohol: A
framework for action. Edinburgh: Scottish Government; 2009.
6 Holmes J, Meier PS, Angus C and Brennan A. Scotland’s policy on minimum unit
pricing for alcohol: the legal barriers are gone, so what are the implications for
implementation and evaluation? Addiction, 2018 (Abingdon, England), 113 (2), 203–
204.
7 UK Supreme Court. Scotch Whisky Association and Others (Appellants) v the Lord
Advocate and another (Respondents) (Scotland). London: UK Supreme Court; 2017.
8 Burton R, Henn C, Lavoie D et al. The public health burden of alcohol and the
effectiveness and cost-effectiveness of alcohol control policies: An evidence review.
London: Public Health England; 2016.
9 Stockwell T and Thomas G. Is alcohol too cheap in the UK? The case for setting a
minimum unit price for alcohol. Institute of Alcohol Studies; 2013.
3610 Stockwell T, Zhao J, Martin G et al. Minimum alcohol prices and outlet densities in
British Columbia, Canada: estimated impacts on alcohol-attributable hospital
admissions. American Journal of Public Health 2013, 103 (11), 2014–2020.
11 Stockwell T, Zhao J, Giesbrecht N et al. The raising of minimum alcohol prices in
Saskatchewan, Canada: Impacts on consumption and implications for public health.
American Journal of Public Health 2012, 102 (12), e103–10.
12 Zhao J, Stockwell T, Martin G et al. The relationship between minimum alcohol
prices, outlet densities and alcohol-attributable deaths in British Columbia, 2002–09.
Addiction (Abingdon, England) 2013, 108 (6), 1059–1069.
13 Angus C, Holmes J, Pryce R et al. Model-based appraisal of the comparative
impact of minimum unit pricing and taxation policies in Scotland: An adaptation of the
Sheffield Alcohol Policy Model Version 3. Sheffield: ScHARR: University of Sheffield;
2016.
14 Craig P, Cooper C, Gunnell D et al. Using natural experiments to evaluate
population health interventions: new Medical Research Council guidance. Journal of
Epidemiology and Community Health 2012, 66 (12), 1182–1186.
15 World Health Organization. International guide for monitoring alcohol consumption
and related harm. Geneva: World Health Organization; 2000.
16 Thorpe R, Robinson M, McCartney G and Beeston C. Monitoring and Evaluating
Scotland’s Alcohol Strategy: A review of the validity and reliability of alcohol retail
sales data for the purpose of Monitoring and Evaluating Scotland’s Alcohol Strategy.
Edinburgh: NHS Health Scotland; 2012.
17 Henderson A, Robinson M, McAdams R et al. Tracking biases: An update to the
validity and reliability of alcohol retail sales data for estimating population
consumption in Scotland. Alcohol and Alcoholism 2016 (Oxford, Oxfordshire), 51 (3),
363–366.
37You can also read


