Covid-19 scenario modelling tool for local authorities - Version 2.0 | 15 September 2020 - Deloitte
←
→
Page content transcription
If your browser does not render page correctly, please read the page content below
Covid-19 scenario modelling tool
for local authorities
Version 2.0 | 15 September 2020

Version Control

 Version 1.0 (8 September 2020)
 Draft version for user testing

 Version 2.0 (15 September 2020)
 Initial version provided to Councils with Workshops & Model v 2.0

© 2020. For information, contact Deloitte                            Scenario Modelling Tools   User Guidance v1.0 | September 2020   2
Executive Summary

© 2020. For information, contact Deloitte.   Scenario Modelling Tools   User Guidance v1.0 | September 2020   3
Covid-19 Scenario Modelling Tools
 DIA are supporting Local Government to plan post-Covid recovery

                   What is this project about?                                                                    To find out more

    DIA is working with Deloitte to develop a set of scenario                                           DIA and Deloitte are hosting a number of virtual
    modelling tools to assist local authorities with LTP                                                workshops to preview the Scenario Modelling Tools
    scenario modelling of the potential financial impact of                                             and invite you to nominate attendees from your
    different Covid economic scenarios and different policy                                             Council. This would be most interest to Council
    responses. The tools are designed to assist Councils to                                             Officers that are involved in:
    ask ‘what if’ questions such as:                                                                    • Developing Council strategic Covid response,
    •     What could be the financial impact on Council cash                                            • LTP/AP planning,
                                                                      Covid-19 Scenario Modelling
          flow, income, debt levels and debt headroom under                 Tools comprise:             • Finance/Treasury/LGFA funding,
          different post-Covid economic scenarios?
                                                                  •    Deloitte Access Economics        • Data insights and analytics.
    •     How might Council policy responses such as rate              Regional Economic Scenarios
                                                                                                        The project team may also present the Scenario
          deferrals, rating remissions, changes in variable            (High and Low cases)
                                                                  •    Interactive Data Visualization   Modelling Tools at local government forums.
          fees/charges, changes in income from CCOs, revised
                                                                       Dashboard                        Requested Action:
          capex or opex profiles or targeted grants affect debt   •    LTP Scenario Model (a
          headroom or changes in rates?                                separate Excel template)         Please forward this pack to the relevant Council
                                                                                                        Officers who would find this tool useful and contact
    Click on the following link to preview the regional                                                 Lauren Thompson to reserve a workshop place.
    Deloitte Economic Scenarios and data visualisation
    dashboard, which are key artefacts that comprise the
    Scenario Modelling Tools package.                                                                   Lauren Thompson
                                                                                                        LGModellingTool@dia.govt.nz
    Or copy the following link:                                                                         022 167 4770
    https://public.tableau.com/profile/deloitte.nz#!/vizhom
    e/Covid-19scenariomodellingtools/Cover

© 2020. For information, contact Deloitte                                                                     Scenario Modelling Tools   User Guidance v1.0 | September 2020   4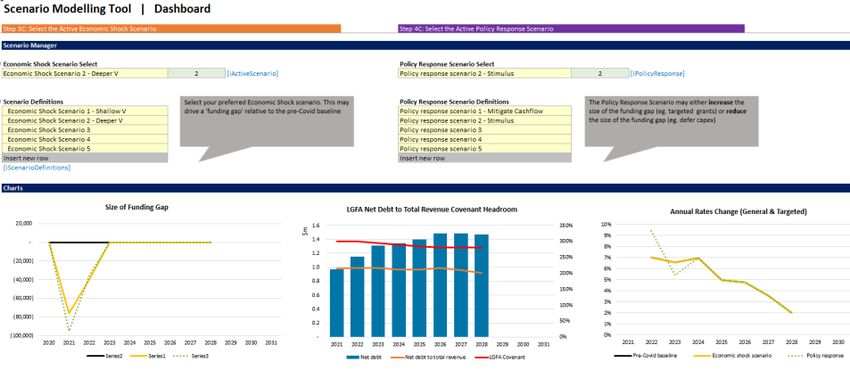
Covid-19 Scenario Modelling Tools
 Core Functionality

                       Scenario Modelling Tools Functionality

      The scenario modelling tools are designed to work ‘out of the box’ and will come pre-populated with Councils’
      most recent LTP or AP submissions, with the functionality to:

      • Access national and regional data sets provided from MBIE, MSD, Statistics NZ and the Ministry of Health of
        key economic, health and economic activity indicators that are relevant to scenario planning via an
        interactive dashboard

      • Access to up to date (Sept 2020) National and up to 17 regional post-Covid economic impact and recovery
        scenarios developed by Deloitte Access Economics, covering: regional GDP, sector impact, population and
        unemployment metrics

      • Provide a mechanism to record the evidential base and change control/approval processes for “significant
        forecasting assumptions” that inform the LTP process

      • Scenario analysis functionality to analyse a range of economic shock scenarios and possible policy response
        scenarios

      • High level analysis of the potential impact on debt headroom against LGFA covenants

      • Sharing of best practice, lessons learnt, and approaches across councils with similar characteristics.

      • Allow optional customisation of the scenario modelling tools with more granular analysis of line items or
        more in depth regional economic analysis

      Access to the Scenario Modelling Excel Tools, populated with Council specific LTP data, and supporting user
      guidance will be made available to Councils after your attendance at one of the workshops.

© 2020. For information, contact Deloitte                                                                             Scenario Modelling Tools   User Guidance v1.0 | September 2020   5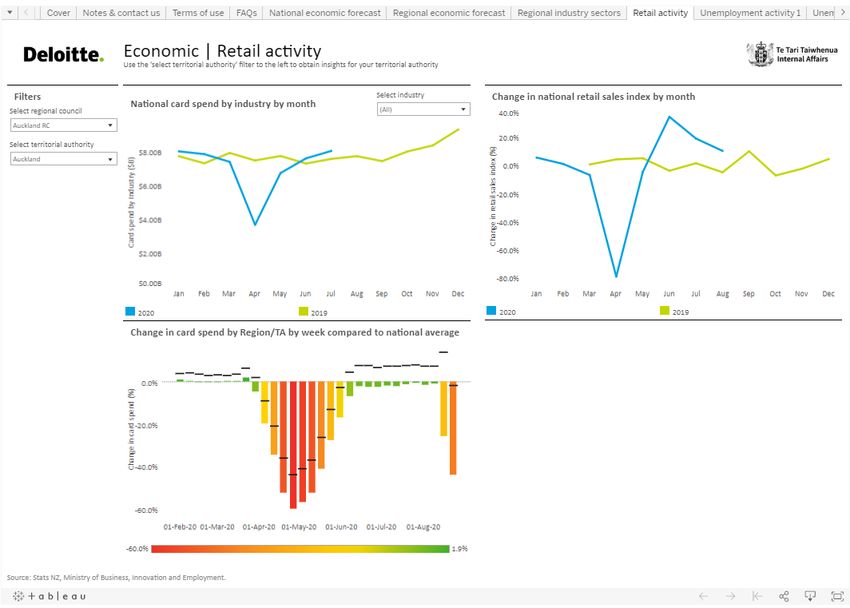
Overview of the Scenario Modelling Tools
 The Scenario Modelling tools comprise of three key components:

      (1) Deloitte Regional economic impact
                                                  (2) Interactive Data Visualization Dashboard                 (3) Scenario Modelling Tool
                     scenarios

 A set of High and Low economic impact            A web based interactive dashboard of national   A high level Excel based scenario modelling tool
 scenarios for 17 regions that provide forecast   and regional economic, health and economic      that is pre-populated with Councils’ 2018 LTP and
 regional scenarios of GDP, population change     activity indicators that can be used in         2021 AP data that supports a range of Covid
 and unemployment. Also provides an analysis      conjunction with Councils own local data sets   economic impact scenarios and policy response
 of current regional GDP by sector impact.        to inform economic shock scenarios and policy   scenarios. Designed to allow optional Council
                                                  response                                        specific customisation

© 2020. For information, contact Deloitte                                                             Scenario Modelling Tools   User Guidance v1.0 | September 2020   6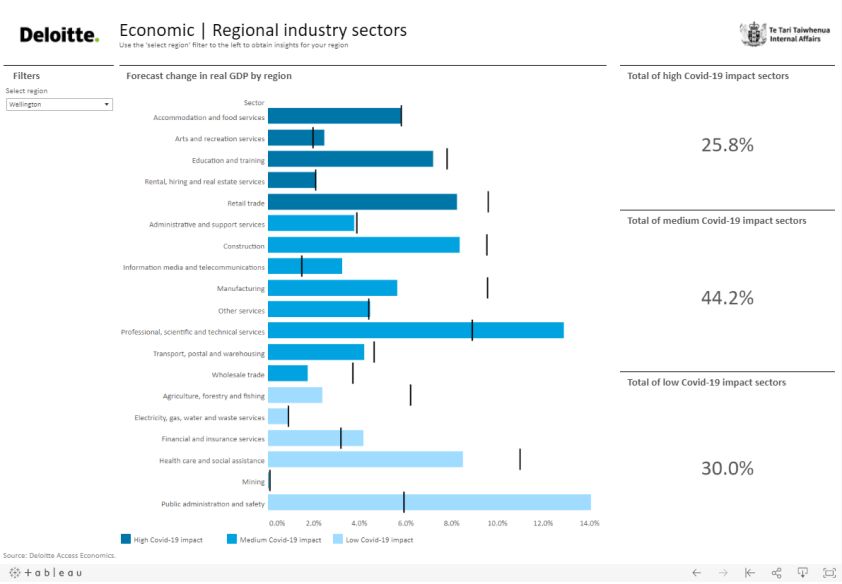
Benefits of the Tools
 The Scenario Modelling tools are designed with the following objectives

                               Scenario Analysis
                                   • Pre-populated with Councils’ existing LTP/AP data to be used ‘out of the box’ with a basic level of scenario modelling functionality,
                                     based on practices developed by larger metro Councils which may be of particular interest to smaller councils
                                   • Ability to assess the size of the funding gap and indicative LGFA debt headroom under different economic shock scenarios or policy
                                     response scenarios

                                Access to relevant data in one place

                                 • Access to a range of national and regional economic, health and economic activity indicators including high frequency indicators via an
                                   interactive dashboard
                                 • Access to a set of High and Low economic forecast scenarios showing the potential ‘book end’ range of impacts of COVID-19 on regional GDP,
                                   employment, and demographics

                              A base tool and model to extend further optional analysis
                                   • The model and tools give councils a sound starting point to assess the impact of COVID-19 on the LTP
                                   • The model can be customised to specific councils needs with more granular line items (such as variable fees/charges, income from
                                     CCOs/investments or to test a range of specific local policy responses
                                   • Artefacts may be customized by individual Councils (eg. More in depth regional economic analysis by sector; analysis of locally relevant
                                     data sets; or integration of LTP scenario analysis with Councils’ own financial information systems)
                                   • Please contact the Deloitte Project Team for more information on customising the tool further

© 2020. For information, contact Deloitte                                                                                         Scenario Modelling Tools   User Guidance v1.0 | September 2020   7
Where to get further support

                   Additional information                                                                                                                        Rotorua
                                                                                                          Auckland                                               Lee Gray
                                                                                                          Craig Robertson                                        leegray@deloitte.co.nz
       Virtual Workshops                                                                                  crrobertson@Deloitte.co.nz
                                                                        Key contacts:
       DIA and Deloitte are hosting a number of virtual workshops to
       preview the Scenario Modelling Tools and invite you to
                                                                        Core Project Team:
       nominate attendees from your Council.                            John Tan & Hilary Parker (Deloitte)
       Access to the Scenario Modelling Tools, populated with           Warren Ulusele & Lauren Thompson (DIA)
       Council specific LTP data and supporting user guidance will be   LGModellingTool@dia.govt.nz
       made available to Councils after these workshops.                                             Hamilton
                                                                        Economic forecasting:
                                                                                                     Brad Sherman
       Updated Data Visualisation Dashboard                             Liza van Der Merwe
                                                                        (04) 470 3545                brsherman@deloitte.co.nz
       Deloitte will continue to host and update the post-Covid data    elvandermerwe@deloitte.co.nz
       visualisation dashboard. Please contact us if you have
       suggestions for additional functionality or data sources for     Scenario Modelling:
       future iterations of the tool.                                   John Tan
       For further support                                              (04) 470 3676
                                                                        johntan@deloitte.co.nz
       Please contact either:                                                                                                                                    Wellington
                                                                        Data Visualisation Dashboard:                                                            John Tan
       • the core project team on the dedicated email:                  Adil Maqbool                                                                             johntan@deloitte.co.nz
         LGModellingTool@dia.govt.nz in the first instance, to RSVP     (09) 975 8553                                                       Christchurch
         for a workshop, request a copy of the Scenario Model or        admaqbool@deloitte.co.nz                                            David Seath
         any general enquiry, or                                                                                                            dseath@deloitte.co.nz

       • the Deloitte Access Economics team for further
         information on the economic forecasts, or                                                                                      Dunedin
                                                                                                                                        Mark Walker
       • your local Deloitte office contact
                                                                                                                                        mawalker@deloitte.co.nz
       who can assist with how to use the scenario modelling tools
       or to discuss options for further customisation of the tool or
       data sets.

© 2020. For information, contact Deloitte                                                                        Scenario Modelling Tools   User Guidance v1.0 | September 2020   8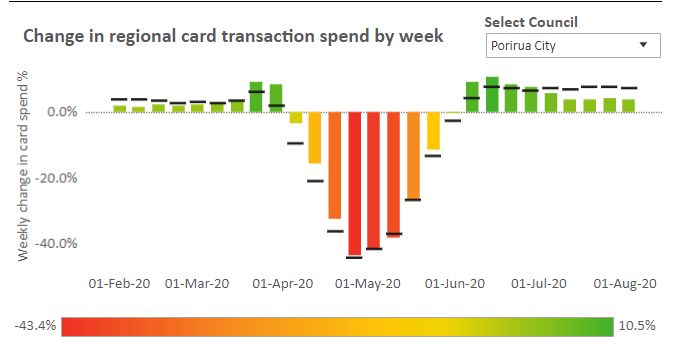
Interactive Data Visualization Dashboard

© 2020. For information, contact Deloitte.   Scenario Modelling Tools   User Guidance v1.0 | September 2020   9
Interactive Data Visualisation Dashboard
A web based dashboard of national and regional economic, health and economic activity indicators that can be used in conjunction with Councils’
own local data sets to inform economic shock scenarios and policy response
The tool displays the Regional and National Economic forecast scenarios developed by Deloitte Access Economics (current to September 2020).
These include a set of High and Low economic impact scenarios for 17 regions and provide a scenario forecast of GDP, population change and
unemployment. It also provides an analysis of current regional GDP and employment by sector.
Click here to access the dashboard
Or copy the following link: https://public.tableau.com/profile/deloitte.nz#!/vizhome/Covid-19scenariomodellingtools/Cover
The following dashboards are available:
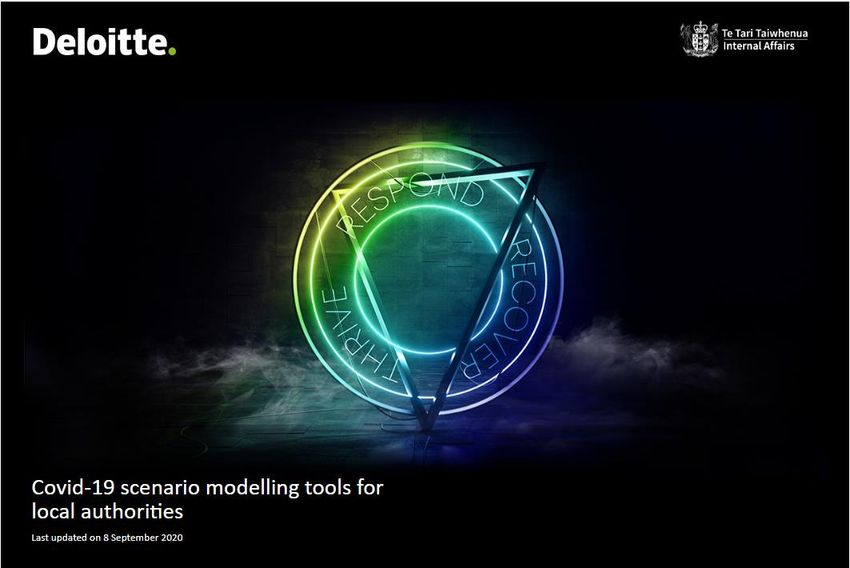
• Economic Scenarios | National
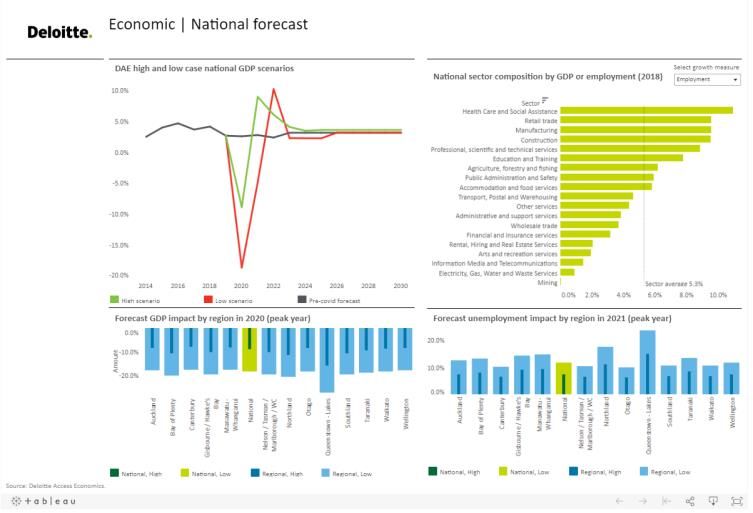
• Economic Scenarios | Regional
• Economic | Retail Activity
• Economic | Unemployment Support
• Economic | Employment
• Economic | Trade Activity
• Economic | Confidence
• Economic | Transport Activity
• Economic | Financing Activity
• Economic |Consumption Activity
• Economic | Manufacturing Activity
• Health | Covid status
Select a tab to view the data. The
following slides provide guidance on how
to interpret selected dashboards.
© 2020. For information, contact Deloitte Scenario Modelling Tools User Guidance v1.0 | September 2020 10Interactive Data Visualisation Dashboard
Regional economic forecasts
Graphs are dynamic. Hover
over to view details of
specific data points
The Regional Economic
Forecast scenarios are based
on 16 regions + Queenstown.
It may be possible to further
disaggregate specific TA’s or
groups of TA’s with additional
data or analysis
A description of the high and
Some graphs benchmark
low scenarios are in the
variables against NZ or
“Economic scenario” section
other TA’s or regions
of this Guidance
© 2020. For information, contact Deloitte Scenario Modelling Tools User Guidance v1.0 | September 2020 11Interactive Data Visualisation Dashboard
Retail activity indicators
Most of the graphs compare 2020 with
Data is provided by 2019 to illustrate COVID-19 impacts.
regional council and by TA
where available. E.g: national retail spending was down
~80% in April compared to the
In some cases, the data previous year, but spending rebounded
provider’s definition of strongly in July as we left lock-down.
‘region’ may not align with
Regional Council
boundaries
The black lines are
the national Data from the dashboards can be
benchmark downloaded to inform the Councils’
average economic shock scenarios
© 2020. For information, contact Deloitte Scenario Modelling Tools User Guidance v1.0 | September 2020 12Scenario Modelling Tool © 2020. For information, contact Deloitte. Scenario Modelling Tools User Guidance v1.0 | September 2020 13
Scenario Modelling Tool
 Assessing potential COVID-19 impacts on long term plans and planning a policy response
   The model utilises two sets of scenarios.
   1. The first is the Economic Impact Scenarios, which assesses the potential impacts of COVID-19 on Council finances and the size of any potential funding gap.
   2. The second is a Policy Response Scenarios, which assesses how different policy levers may mitigate the funding gap or increase the funding gap through
       additional stimulus measures.

                                                                                                         Policy Response Scenario

                         1                                                                        2
                                            Economic impact Scenario
                                                                                                         • What are the potential policy responses and how
                                            • What are the potential impacts of
                                                                                                           will these affect the size of the funding gap?
                                              COVID on revenue items?
                                                                                                         • What might be the effect on Council debt
                                            • Could this result in a funding gap?
                                                                                                           headroom (measured against LGFA covenants)

                       Inputs: Regional Economic Scenarios                                            Outputs: A range of potential policy responses
                       & Data Visualisation tool                                                      Develop and manage a range of policy responses that address the
                       Scenario assumptions are supported by the Regional Economic                    potential impact of COVID-19.
                       Scenarios, data on the Interactive Data Visualisation Tool and other
                       data sources that Councils may hold. Use the forecasts and data to             Example 1: A new COVID-19 response package comprising targeted
                       develop an evidence base.                                                      grant funding of $1 million is offered to local food bank providers.
                                                                                                      This additional stimulus expenditure increases the funding gap.
                       Example: The regional economic scenarios of the Covid impact on GDP
                       estimate a reduction of between 8.5% to 18.3% in FY21 with a mid               Example 2: Councils may mitigate the size of the expected funding
                       point of 13.4%. Councils can use forecast change in GDP as one factor          gap by deferring capital expenditure.
                       to scale line items, noting that the economic impact on any line item is
                       expected to be influenced by multiple data points.                             The Scenario Model allows policy responses such as raising,
                                                                                                      deferring or remitting rates, adjusting fees/charges, flexing opex
                                                                                                      or capex, implementing new expenditure or raising debt.

© 2020. For information, contact Deloitte                                                                                Scenario Modelling Tools   User Guidance v1.0 | September 2020   14
Steps to populate and use the Scenario Modelling Tool
Overview: Assess the impact of COVID-19 on the LTP and test policy responses
Step 1: Populate the Step 2: Create Pre-Covid Baseline Step 3: Set the Economic Step 4: Set the Policy
Model with Data Shock Scenario Response Scenario
Step 4: Define Policy
Response Scenarios
Step 3: Define • The Policy Response
Economic Shock Scenario may either
Scenarios increase the size of the
Step 2B: Include more
granular information • Create up to five funding gap (eg.
scenarios targeted grants) or
Step 2A: Create pre- reduce the size of the
• Optionally, choose to • To add a scenario,
COVID baseline funding gap (eg. defer
add more detailed populate the scenarios
Step 1: Populate • Select the 2018 LTP as information (“High capex)
with the expected
Dataset the data source. level” or “granular”) for change (100% = 100% • Consider whether
each LTP item. of baseline) additional modelling of
• FY2021 Annual Plan and • Or input an alternative
2018-2028 LTP is already in baseline (such as draft • You only need to use customised policy
• Select “active scenario”
the model. 2021 LTP) the more granular responses such as
is the scenario which
option if you expect the changes to pricing of
• An draft 2021 LTP can also you select to analyse.
need to apply different variable income lines,
be input if available. service levels, rates
economic shock factors
or policy responses to profile, CCO dividends
different line items. or debt structure may
be required
Iterate scenarios
© 2020. For information, contact Deloitte Scenario Modelling Tools User Guidance v1.0 | September 2020 15Step 1: Populate the database
Step 1: Populate data
Step 1: Populate Step 1 is to populate Dataset. The 2018 LTP is the starting position, but can be updated with a draft 2021 LTP if available.
Dataset Step 1A: Populate Model with 2018 LTP data in the 2018 LTP Inputs tab. This is already done by the model.
• FY2021 Annual Plan and Step 1B (Optional): Populate Model with 2021 AP Data in the 2021 AP Inputs tab. This is already done by the model.
2018-2028 LTP is already in
the model. Step 1C (Optional): Enter Normalisation Adjustments to the FIS-21AP sheet to generate forecasts for 2022 and 2023. This is
only required if you intend to use the 2021 AP data in the calculations.
• Draft 2021 LTP can also be
input if available. Step 1D (Optional): The model has space to enter high level LTP information for the financial statements and funding impact
statement. Enter your draft 2021 LTP data in the following tabs:
a. Balance Sheet (BS-21LTP)
b. Profit and Loss (LP-21LTP)
c. Financial management (FM-21LTP), and
d. Funding impact statement (all of council) (FIS-21LTP)
The level of detail will be at a higher level than what Councils usually report on. There is opportunity to include additional line
items in Step 2 if required.
Step 1E: Check other inputs on the Control sheet for interest rates and debt balances are appropriate.
© 2020. For information, contact Deloitte Scenario Modelling Tools User Guidance v1.0 | September 2020 16Step 2: Create a pre-COVID19 baseline
Step 2: Create a Pre-COVID19 baseline
Step 2A: In the Control tab:
Step 2A: Create pre-
COVID baseline • Select the preferred data source for each year. The starting point is the 2018 LTP but if you’ve entered 2021 LTP
data, you can select this. The model will populate the table in this tab.
• Select the baseline
from available data
Step 2B: Include
more granular
information
• Select to add more
detailed information Step 2B: In the Economic Shock Input tab:
(“High level” or
“granular”) for each LTP • Choose to run analysis using pre-populated 'High Level' data or optionally to use the more 'Granular' data using
item. Council specific line items.
• If the Granular option is selected, it must be populated for all time periods
• Note that under the Granular option, the Model will self-balance against the LTP submission by putting any
remaining balance into 'Other’
© 2020. For information, contact Deloitte Scenario Modelling Tools User Guidance v1.0 | September 2020 17Step 3: Set the Economic Shock Scenario
Step 3: Set the Economic Shock Scenario
Note: Refer to the National and Regional Data Visualisation Dashboards for relevant data sets to inform the
scenario profiles (see over page)
Step 3: Define
Economic Shock
Step 3A: In the Dashboard tab:
Scenarios
• Option to create up to • define the Economic Shock Scenario names
five scenarios
• To add a scenario,
populate the scenarios
with the expected
change (100% = 100%
of baseline)
• Select “active scenario”
is the scenario which
you select to analyse.
Step 3B: In the Economic Shock Input tab:
• Scroll to Column T. There is spare columns to enter five Economic Shock Scenarios.
• Set the Economic shock variables for each Economic Shock Scenario by changing scenario profiles for each Scenario (as a
% of the Baseline). 100% = no change from Baseline. The example below shows Fees and Charges as 70% or 85% of
baseline.
• Scenarios allow line items to be scaled up or down, deferred or brought forward
© 2020. For information, contact Deloitte Scenario Modelling Tools User Guidance v1.0 | September 2020 18Step 3: Set the Economic Shock Scenarios
Making use of data provided in the data visualisation tool
The Data Visualisation Tool includes information at a national, regional, and local council level on activity levels as well as forward looking forecasts of GDP,
employment, and demographics. In conjunction with data sets held by Councils, the information in the tool can be used to inform and provide the evidence base to
significant forecasting assumptions in the LTPs.
Access the tool by copying the following link: https://public.tableau.com/profile/deloitte.nz#!/vizhome/Covid-19scenariomodellingtools/Cover
Example: How will Porirua’s demand driven revenue items be affected in FY2021? Demand driven items could include fees and charges (such as swimming pools and
libraries, and spots clubs), building consents, and revenue from grants and subsidies.
Change in the level of activity due to COVID Forecasts of GDP and employment
E.g. electronic card data.
Wellington Region is expected to have fared relatively well through COVID-19
Consumer expenditure in Porirua City performed slightly better over the compared to the average New Zealand region. This is largely due to a
comparatively lower proportion of employment in sectors that were heavily
lockdown periods compared to the national average.
impacted by COVID-19.
Expenditure declined by 43%pa during L4 lockdown in Porirua city, The graph below shows regional employment by sector grouped by COVID-19
compared to the same week a year earlier. This was in line with the impact. For example, 14% of the workforce is employed in Public
national average. However, the city regained momentum quickly as the administration, which was one of the least hit sectors.
country emerged from Level 3 and 4 lockdown, possibly reflecting a
higher proportion of people choosing to work from home and buy local.
© 2020. For information, contact Deloitte Scenario Modelling Tools User Guidance v1.0 | September 2020 19Step 4: Set the Policy Shock Scenario
Step 4: Set the Policy Shock Scenario
Step 4: Define Policy After setting the economic shock, change selected pre-defined policy levers.
Response Scenarios
Step 4A: In the Dashboard, define the Policy Response Scenario Names. Levers can be
Choose to model a selected flexed to model
range of policy responses Policy responses
such as:
• changes to service levels,
• changes in rates /
deferrals / remissions,
• changes to pricing of
variable income lines,
• Cash flows from CCO Step 4B: In Policy Response Input, set the Policy Response variables for each Policy response Scenario. There is space
dividends for five scenarios. The Policy Response Scenario may either increase the size of the funding gap (eg. targeted grants) or
The Model will default any reduce the size of the funding gap (eg. defer capex)
remaining change in
cashflow as a result of the
economic shock and policy
response to the debt balance
Policy examples:
• “Can we afford to increase
rates by 3% instead of 5%
next year?”
Step 4C: In Dashboard, Select the Active Policy Response Scenario
• “Is there sufficient debt
headroom to increase Assess the 'Size of the Funding Gap' and 'Impact on LGFA Debt' under the Active Policy Response Scenario
capex?” Step 4D: Iterate Steps 3 and 4 to refine the LTP Scenarios. Record the Supporting Assumptions under each Scenario
© 2020. For information, contact Deloitte Scenario Modelling Tools User Guidance v1.0 | September 2020 20Data sources
A breakdown of the data used for the Scenario tool
Data Source DescriptionDevelop
of dataUpdated set of Regional Date
Economic Scenarios
DIA – 2018/2028 LTP High level LTP3 scenarios, for up
data by Local to 16
and regionsCouncil
Regional 2018-2028
with a 10 year outlook for
population, GDP and employment
DIA – FY2020 Annual plan High level AP$35,000
data by+Local and
GST (in Regional
parallel with Council 2020
core model development
© 2020. For information, contact Deloitte Scenario Modelling Tools User Guidance v1.0 | September 2020 21Model Assumptions
List of modelling assumptions
Users should note the following key assumptions. • Fees & Charges scaling factor: The user inputs a positive or negative %
which is added or subtracted from total fees and charges.
Baseline:
• Capex deferral: The user inputs a negative dollar amount of capex
• The model uses a baseline forecast which by default is the 2018 LTP. deferred and a positive dollar amount of capex incurred.
Alternatively, users can select to use the 2021 AP or load a draft 2021 LTP
to use as the baseline. • Opex deferral: The user inputs a negative dollar amount of opex
deferred and a positive dollar amount of opex incurred.
• The model allows users to manually break down the baseline line items
to a more granular view. Any balancing item between the manually • Opex on COVID related initiatives or policy responses: The user inputs
entered line items and the total is captured within an ‘other’ category. a positive dollar amount of additional opex.
Economic shocks • Sources of funding: The user inputs a positive dollar amount of
additional sources of funding.
• A single shock factor can be applied to each line item in each year.
Economic shock factors are inputs to the model. The model does not • Note that all policy responses are applied independently. For example,
calculate economic shock factors, however an example on how these both the rates scaling factor and rates remission percentage apply to
shock factors can be developed is included in the model. pre-policy response total rates.
Policy responses Debt and Covenants
• The model includes the following policy response tools: • The model calculates a funding balance after economic shock factors and
policy responses are applied. Any funding deficit or surplus accumulates
• Rates scaling factor: The user inputs a positive or negative % which is in a modelled debt facility as debt or cash. Interest is applied based on an
added or subtracted from total rates. input interest rate.
• Rates deferral: The user inputs a negative dollar amount of rates • Any existing debt facilities or cash in the baseline remain unchanged.
deferred and a positive dollar amount of rates collected. Note that if different sources are used to construct a baseline, the
• Rates remission: The user inputs a positive percentage which is forecast debt balances from year to year may not reconcile. In this
subtracted from total rates. situation the LFGA covenant calculations may not be accurate.
© 2020. For information, contact Deloitte Scenario Modelling Tools User Guidance v1.0 | September 2020 22Model Assumptions
LGFA covenants
The model calculates three LGFA covenants following a worked example Net interest as a percentage of total revenue.
provided by LGFA. The model is based on the Funding Impact Statement • Net interest is calculated as finance costs (2002) plus any net interest
with a lower level of granularity than what would normally be used to calculated on the model debt facility resulting from the deficit or
calculate covenants. Line items used to calculate LGFA covenants are surplus created as a result of economic shocks or policy responses.
estimated on the following basis.
• Total revenue is calculated in the same manner as net debt as a
Net debt as a percentage of total revenue. percentage of total revenue.
• Net debt is calculated as Net interest as a percentage of annual rates income
− 9006_Borrowing (total debt) • Net interest is calculated in the manner described above.
− Less 9004_Cash & financial investments/monetary assets • Annual rates income is calculated as the sum of:
− Plus / less any accumulated funding deficit or surplus created as a − 1001_General rates, UAGC, rates penalties
result of economic shocks or policy responses is also included
within net debt. − 1002_Targeted rates (excluding metered water)
• Total revenue is calculated using the FIS, as the sum of: − 1002b_Targeted metered water rates
• Annual rates income:
− 1001_General rates, UAGC, rates penalties If Councils add more granularity when constructing their baseline,
adjustments are likely to be required to the LGFA covenant calculations.
− 1002_Targeted rates (excluding metered water) Please refer to the LGFA for detailed guidance.
− 1002b_Targeted metered water rates
• Subsidies & grants income:
− 1003_Subsidies & grants for operating purposes
− 3001_Subsidies & grants for capital expenditure
• Other income:
− 1004_Fees & charges
− 1005b_Interest & dividends from investments
− 1006_Petrol tax, fines, infringement fees & other
© 2020. For information, contact Deloitte Scenario Modelling Tools User Guidance v1.0 | September 2020 23Economic Scenarios © 2020. For information, contact Deloitte. Scenario Modelling Tools User Guidance v1.0 | September 2020 24
COVID-19 | Economic scenarios
What the world could look like during and after the crisis passes

                                                                                  Key uncertainties
   Two economic scenarios
                                                                                  The next few slides outline a set of scenarios that
                                                                                  describe what the future could hold for New Zealand.
   • This section of the report looks at two economic scenarios.                  The scenarios are designed around three key
   • Making the right decision at the right time has never been more              uncertainties:
     important than now, and good decisions are based on good information.
     Scenarios are an appropriate and useful tool to plan as it allows Councils

                                                                                    1
     to test long term plans against a number of different outcomes.
   • Although the number of scenarios are endless during this time of                                 The effectiveness of the public health
     uncertainty, our resulting set of scenarios range from:                                            response and public compliance
            • The future we should prepare for (best-case)
            • The future we need to avoid (worst case).
   • Each scenario considers the likely outcome for the global economy, the
     domestic economy and the regional economy.

                                                                                    2
   • The scenarios are not predictions about what will happen, they are
     hypotheses about what could happen, and are designed to frame planning
                                                                                                        The effectiveness of Government
     discussions.
                                                                                                               economic support
   • Three key uncertainties were explored when developing scenarios,
     covering the health response and outcomes, effectiveness of fiscal policy,
     and outcomes in major trading partners.
   • The effectiveness of the health response is highly correlated with the
     speed of the economic recovery, where the effectiveness of fiscal

                                                                                    3
     stimulus also plays an important role. Meanwhile, the global environment
     is considered to be somewhat exogenous to the other uncertainties as
     this cannot be controlled by domestic policy. Despite being exogenous,                               Global economic conditions
     the global environment has a significant impact on the recovery of the
     regional economy.

                                                                                                                                               25
COVID-19 | Scenario 1
Scenario assumptions
Best Case The public health response is effective. However, there is limited technology
improvement in case detection and tracing and this results in a growth in the number
A slow recovery of cases over time. This COVID-19 scenario is therefore likely to start in July 2021
with a slow economic recovery.
Mapping the scenario against three uncertainties Health
• The success of the Alert Level 4 lockdown allows New Zealand to roll
back to Alert Level 1 for 3 months before a mild second outbreak
Effectiveness of the health response
occurs in mid-late 2020. However, it is contained relatively quickly and
the country is restored to Alert Level 1 by late 2020 and into the
Ineffective Effective foreseeable future.
• A vaccine is found by July 2021 and rolled out by late 2021.
• Borders begin to open in mid-2021 as the vaccine is rolled out.
Effectiveness of Government
economic support Global Economy
• The global outbreak is mostly contained in 2020, after which there is a
slow unwinding of travel bans over the following year.
Ineffective Effective
• China drives global recovery as it is the New Zealand’s largest export
partner (~2 times more exports than the country’s second largest
partner in Australia).
Global economic conditions • Population growth slows given weaker global movement of people.
• Central banks maintain accommodative monetary policy settings
Prolonged
global Effective globally and support liquidity in financial markets
recession recovery
Domestic economy
• The fiscal response focuses on providing income support and limiting
Why is this scenario plausible? business operating costs during the lockdown period.
• Fiscal measures provide some support to households, but
New Zealand is in the process to contain the second wave of COVID-19,
consumption is curtailed. Wage growth comes under pressure given
however globally there is some way to go until the outbreak is contained.
both increased unemployment and cost cutting measures taken during
Technological advances are limited. While the government is spending big, it is
the crisis.
still not enough to avoid low inflation and low investment leading to slow
• The New Zealand dollar comes under pressure and investors flock to
economic growth.
safe havens and the RBNZ works to keep interest rates low through a
Likelihood significant bond buying program.
This scenario is more likely to occur given Government’s response to date and • Consumer and business sentiment remain weak post 2021, limiting
global recovery and global economic conditions. investment and spending in the recovery.
• The health crisis and extended period of work from home 26
requirements results in a population flow out of major cities.COVID-19 | Scenario 2
Scenario assumptions
Worst Case In this scenario, New Zealand both struggles to contain COVID and the economic
recovery from the recession is delayed. This scenario sees waves of reinfection causing
Sustained economic disruption considerable loss of life and deep economic disruption over a prolonged period.
Health
Mapping the scenario against the three uncertainties • Further outbreak occurs in mid to late 2020 with cases lingering into
2021. Forcing New Zealand to fluctuate between Alert Level 2 and
Alert Level 3/4 until mid 2021 in order to contain the outbreaks.
Effectiveness of the health response • There is a significant increase in demand for mental health services as
prolonged closures result in increased cases. This extends into the
Ineffective Effective recovery, reducing productivity and participation in the workforce.
• Vaccine is found in late 2021 and rolled out early 2022.
• Most international borders remain closed until a vaccine is available
and distributed early 2022.
Effectiveness of Government
economic support Global Economy
• The global outbreak continues to cause difficulties for the economic
Effective
recovery. China experiences a second COVID-19 outbreak which
Ineffective
causes a prolonged economic slowdown.
• Limited export demand from the US and China dampen the speed of
the recovery. In addition, the inability to open borders hurts the large
Global economic conditions tourism sector.
Prolonged • Central banks maintain accommodative monetary policy settings
global Effective globally, with rates lower for longer in the US.
recession recovery
Domestic economy
• New Zealand fiscal response is not strong enough resulting in
Why is this scenario plausible? devastating loss to incomes and widespread job losses.
The COVID-19 pandemic becomes a prolonged crisis as a resurgence of the • Unemployment surges with some industries losing the majority of
virus creating panic and further uncertainty. We are in unprecedented times small businesses.
and small missteps now can have devastating consequences in the future. In • The public loses trust in the New Zealand economy which causes social
particular, people’s behaviour can become exceptionally individualistic when unrest and a sharp drop in spending and investment.
their own or their family’s wellbeing is threatened in the way described in this • Monetary policy remains towards the zero lower bound with strong
scenario. quantitative easing.
• The New Zealand dollar devalues further due to our failed response
Likelihood relative to our global peers, and the country comes under pressure as
This scenario is less likely. New Zealand has social cohesion, an excellent health our credit rating drops and public debt soars.
system, strong Government institutions and healthy Government debt to GDP • Limited travel, reduces population growth. This is exacerbated by27
ratio relative to other advanced economies. lower fertility rates and higher mortality rates.Regional modelling of labour markets
A high-level overview of how demographic variables and national forecasts drive labour market
forecasts
Key:
Sourced data (scaled for consistency)
Demographic model (regional National labour force
and national level) aggregates
National aggregate models supplying
baseline or scenario inputs
Deloitte Regional employment models
Regional labour force
User applied consistency analysis aggregates
• Modelling of regional data is top-down. Total employment by National employment
industry is used to drive regional movements. projections by industry
• The aggregate labour market (labour force, employment and Consistency analysis
unemployment) are set based on population by age, national
participation and unemployment rates by age, and typical
regional differences in participation and unemployment rates.
• Stats NZ data at the regional level is often inconsistent with
national aggregates for the same industry (and occasionally
data is not reported on a consistent basis for each). We scale
our inputs by region and industry to conform with total Historic employment by
Regional employment by
employment by region and total results by industry. region and industry from
industry
Stats NZ
• Consistency analysis is considered when movements in implied
employment by industry, implied unemployment rates and
underlying demographic trends come into conflict.
© 2020. For information, contact Deloitte Scenario Modelling Tools User Guidance v1.0 | September 2020 28Regional modelling of economic output (Regional output or regional GDP )
A high-level overview of how regional output projections are derived
Key:
Sourced data (scaled for consistency)
National aggregate models supplying baseline
or scenario inputs and previous employment
models
Deloitte Regional economic models
Historic regional economic
Regional employment by
• Historical Stats NZ data gives regional activity and employment by
industry
productivity differentials which capture region from Stats NZ
differences in regional industry structure
(everything from relative wealth effects
on retail to different types of mining
activity by region) Implied regional productivity National value added
Regional output by industry
differentials projections by industry
• Employment levels and relative
productivity create regional output by
industry levels which are scaled to
national projections.
Regional output (GRP)
• Regional output or GDP is a Production-
based measure of output in this structure.
© 2020. For information, contact Deloitte Scenario Modelling Tools User Guidance v1.0 | September 2020 29Explanation of outputs/nuances
Clarification of key outputs/assumptions
Unemployment
Develop Updated set of Regional Develop Updated set of Regional
Generally, it would not be needed
Economicto Scenarios
look beyond the unemployment rate but in unusual circumstances like during pandemics
Economic the definition of
Scenarios
the rate can come under scrutiny. To be considered officially unemployed, someone who is out of work must be both actively seeking and
3 scenarios, for up to 16 regions 3 scenarios, for up to 16 regions
available for work. The downside
with a of
10 this
yeardefinition
outlook foris that it excludes people out of work who get disheartened with their job prospects and
with a 10 year outlook for
therefore stop actively seeking work. Although
population, other measures such as utilisation and underemployment may show
GDP and employment the impact
population, of the
GDP and pandemic
employment
more widely, unemployment rate was used in the scenario forecasts due to data availability and the fact that it is a conventional measure of the
$35,000 + GST (in parallel with $35,000 + GST (in parallel with
labour market. core model development core model development
June to June years
The historic data and forecasts for the economic variables are on an annual basis and in the case of GDP, it is in annual percentage change. In this
case, June to June years were used i.e. GDP growth will be the difference from June 2020 to June 2021.
2019/2020 forecasts
Due to the timing and nature of Stats NZ economic data releases the 2020 June year will comprise of actual unemployment data but GDP and
population will be forecasted for that year. The year ending June 2019 represents the last full year unaffected by Covid and forms the basis of the
‘pre Covid baseline’. Regional GDP Scenarios are also provided using a 2019 base year to align with the Scenario Modelling tool.
Population
As COVID-19 is likely a temporary shock, albeit being significant in nature, forecasts have assumed that regions will not experience population
exodus. This largely applies to the Queenstown-Lakes region as a large departure of the population which would have altered unemployment
forecasts due to a falling labour force. However, the economic scenarios have not assumed this, therefore resulting in relatively large modelled
increases in unemployment. Population forecasts are also forecasted using net migration, thus factoring in New Zealanders returning from
overseas which partially offsets the fall in immigration.
© 2020. For information, contact Deloitte Scenario Modelling Tools User Guidance v1.0 | September 2020 30Regional analysis
Regions included in scenario analysis
2020 forecasted GDP impact 11.7%
(high scenario)
8.6%
Less than national average
• The map shows high scenario GDP
forecasts and how they may impact
Greater than national average across the various regions across New
9.0%
11.1% Zealand.
10.4%
• The Queenstown-Lakes region has been
New Zealand is forecasted to 10.4%
9.7% specifically split out from the Otago
experience a 9% drop in GDP under
the high scenario 8.4% region as Queenstown has a sectoral
composition that is materially different
from the rest of the region. The reliance
on tourism drives this.
8.5%
• Note that the Otago region also accounts
10.5%10.5%
for Queenstown in its forecasts.
10.5%
8.2%
16.4%
8.7%
10.8%
© 2020. For information, contact Deloitte Scenario Modelling Tools User Guidance v1.0 | September 2020 31Example region
A spotlight on Bay of Plenty
Economic scenarios have been developed to account for the potential impact of
COVID-19 on regions across New Zealand. This slide presents the scenario outcomes Bay of Plenty - real GDP, % change
for the Bay of Plenty (BOP) region. 15%
Regional GDP Develop Updated set of Regional 10%
• The high scenario forecasts a rebound in GDPEconomic
for BOP Scenarios
in 2021 and 2022. The low
5%
scenario GDP contracts significantly over two3financial
scenarios, for upbefore
years, rebounding in
to 16 regions
2021-22. Demand and supply side constraints with a 10 year outlook for income and
in the form of lost 0%
unemployment, and lockdown and border closures respectively,
population, add to the slump
GDP and employment -5%
in the economy. GDP never rebounds enough to recover the economic activity
$35,000 + GST (in parallel with
forfeited in 2020. -10%
core model development
Unemployment rate -15%
• In the high scenario unemployment is forecasted to remain elevated for some -20%
time as the impact of COVID-19 structurally damages industries. The low scenario
-25%
expects unemployment to remain at historically high levels until 2023-2024.
Population
• The high scenario projects that BOP’s population growth returns to pre-virus Low Scenario High Scenario
Source: Stats NZ, Deloitte analysis
levels in 2024-2025 while the low scenario returns to pre-virus levels in 2025-26
caused by a delayed vaccine release and borders opening.
Bay of Plenty - unemployment rate (%) Bay of Plenty - change in population, persons
13% 7,000
12%
6,000
11%
10%
5,000
9%
8% 4,000
7%
3,000
6%
5%
2,000
4%
3% 1,000
Low Scenario High Scenario Low Scenario High Scenario
Source: Stats NZ, Deloitte analysis Source: Stats NZ, Deloitte analysis
© 2020. For information, contact Deloitte Scenario Modelling Tools User Guidance v1.0 | September 2020 32Core functionality/ potential incremental functionality
Additional layers of data that are possible
Develop Updated set of Regional
Population Economic Scenarios
3 scenarios, for up to 16 regions
The demographic model has thea functionality
with and
10 year outlook forcapability to break down population forecasts by region, age group and sex.
population, GDP
Example: males, aged 55-59 in Canterbury and employment
$35,000 + GST (in parallel with
What is potentially required?
core model development
Updated/refined Stats NZ data.
Employment
The regional model have the ability to break down employment forecasts by region and ANZSIC06 industry
Example: employment in the agriculture, forestry and fishing industry in Northland
What is potentially required?
Updated data from Stats NZ in terms of employment by sector and region that adds more detail/granularity and input from councils
around their region’s economic profile.
Regional GDP
The GDP iteration of the regional model allows forecasts to be broken down by region and ANZISC06 industry
Example: GVA (gross value added i.e. contribution of a sector to GDP) for education and training in Wellington
What is potentially required?
Additional data from Stats NZ in terms of GVA by sector and region that adds more detail/granularity and input from councils around
their region’s economic profile.
© 2020. For information, contact Deloitte Scenario Modelling Tools User Guidance v1.0 | September 2020 33Data sources
A breakdown of the data used for the economic scenario forecasts
Data Source Description of data Model Date
Develop Updated set of Regional
Economic Scenarios
Stats NZ – 2018 Census Population by age, region and sex Demographic model 2001-2018
3 scenarios, for up to 16 regions
with a 10 year outlook for
population, GDP and employment
Stats NZ – Infoshare Gross value added by ANZSIC06 national, quarterly National forecasts 1987-2019
$35,000 + GST (in parallel with
core model development
Stats NZ – Infoshare GDP by expenditure approach, quarterly National forecasts 1987-2019
Stats NZ – Infoshare Labour force status national, annually National forecasts 1987-2019
Stats NZ – customised request Employment by ANZSIC06 industry national, quarterly National & regional forecasts 2003-2019
Stats NZ – customised request Employment by ANZSIC06 industry by region, annually Regional forecasts 2009-2019
Stats NZ – customised request Labour force status by region, annually Regional forecasts 2001-2019
Stats NZ – customised request Regional GDP by ANZSIC06 industry, annually Regional forecasts 2003-2018
RBNZ - MPS Baseline scenario forecast for GDP and unemployment rate Sense check for national scenario forecasts Dec 2019,
Aug 2020
© 2020. For information, contact Deloitte Scenario Modelling Tools User Guidance v1.0 | September 2020 34Appendices © 2020. For information, contact Deloitte. Scenario Modelling Tools User Guidance v1.0 | September 2020 35
Frequently Asked Questions

 What is this project about?
 DIA have been coordinating the Local Government Covid-19 Recovery workstream, working in partnership with councils and other agencies to identify the challenges that
 the local government sector is facing post the Level 4 and Level 3 lockdowns. One of the top priorities of the Recovery Workstream is to support councils in preparing their
 2021-2031 Long-term Plans.
 DIA has commissioned the development of scenario modelling tools to assist local authorities in understanding the potential financial impact of different Covid economic
 scenarios and different policy responses. The focus of the analysis is on economic impact and policy response, rather than social impact, health response or other broader
 wellness measures.
 Who is involved in developing the tools?
 DIA commissioned Deloitte to assist with the development of the scenario modelling tools. Deloitte Access Economics provided the regional economic scenarios. A range of
 Government agencies, including Statistics NZ, MBIE, Ministry of Health and RBNZ contributed data shown on the Interactive Data Visualisation Dashboard.
 How much do the tools cost?
 DIA have covered the cost of developing version 1.0 of the tools to date and are continuing to provide funding during the 2021 fiscal year as part of the Local Government
 Recovery Workstream. Version 1.0 of the tools are to be made available to Councils free of charge.
 DIA funding support will enable local authorities to access the tools, assess potential improvements and to provide local authorities with limited user support from the
 project team to understand how best to utilise the tools. While individual local authorities may adapt the tools further for their own requirements and at their own cost, DIA
 may consider funding updates to the tool if there is a consensus from local authorities on functional requirements.
 Will central agencies be able to access the data?
 The data presented on the Interactive Data Visualisation Dashboard is publicly available. Each version of the LTP Scenario Model (the Excel workbook) will be pre-populated
 with an individual local authority’s 2018 LTP data and 2021 AP data and will be provided to the relevant local authority only. There is no mechanism in the LTP Scenario
 Model for any local authorities’ data to be provided to any other party or to any central agency. Although local authorities considering whether working regionally or in
 groups with similar characteristics would be useful to benchmark, calibrate and validate LTP scenario assumptions, especially given the economic interdependencies across
 adjacent local authority boundaries. While the project team can help with facilitating this, any sharing of an individual council’s data will be at the discretion of that council.
 Who do I contact for further assistance
 Contact details of the core project team are included on the ‘Notes’ tab of the Interactive Data Visualisation Dashboard and on the ‘where to get further support’ slide of the
 User Guidance. Specific enquiries relating to the Economic Forecasting, Scenario Modelling or Data Visualisation Dashboard can be addressed to the subject matter experts
 listed. The contacts listed in each regional Deloitte office may also be able to provide assistance with the tools in conjunction with your usual DIA regional director. Please
 contact the core project team on LGModellingTool@dia.govt.nz with your query in the first instance and one of the project team will respond.
 Who do I contact with feedback on the tools, data sets, or suggestions for improvements to the functionality?
 The project team welcomes your feedback on the tools, including any suggestions for additional data sets, or suggested improvements to the functionality. Please contact
 the core project team on LGModellingTool@dia.govt.nz in the first instance and one of the project team will respond.

© 2020. For information, contact Deloitte                                                                                   Scenario Modelling Tools   User Guidance v1.0 | September 2020   36
Terms of use of the scenario modelling tools

 The scenario modelling tools have been commissioned by DIA and developed in conjunction with Deloitte for use by local authorities
 based on information held by DIA, regional economic impact scenarios developed by Deloitte and a range of public sources. However,
 the scenario modelling tools have not been developed to meet the needs of any specific local authority and local authorities using the
 scenario modelling tools do so at their own risk.
 DIA permits local authorities to make use of the scenario modelling tools on the following terms:
 •      In no way does DIA or Deloitte guarantee or otherwise warrant that any financial forecasts scenarios of any entity will be achieved.
        Forecasts are inherently uncertain. They are predictions of future events which cannot be assured. They are based upon
        assumptions, many of which are beyond the control of the local authority and its management team. Actual results will vary from
        the forecasts and these variations may be significantly more or less favourable.
 •      Users of the scenario modelling tools do so at their own risk and acknowledge that neither DIA nor Deloitte have provided any
        specific advice to the user and neither DIA nor Deloitte accept any duty of care to any user who relies on any of the scenario
        modelling tools.
 •      Neither DIA nor Deloitte makes any representation of the accuracy of data contained on the dashboard that has been provided
        from other agencies or public sources.

© 2020. For information, contact Deloitte                                                         Scenario Modelling Tools   User Guidance v1.0 | September 2020   37
Restrictions on use of the Regional Economic Scenario Forecasts Deloitte Access Economics has developed the regional economic scenario forecasts contained in the dashboard as at September 2020. While Deloitte believe the scenario forecasts are a reasonable assessment of prospective trends in the relevant economies, due to the severity and duration of the pandemic being unknown, the forecasts are subject to forces others than economic factors, which is not normal. The scenario forecasts consider, where possible, the potential impact of Coronavirus (COVID-19) on the relevant economies. At the time of the publishing the forecasts, the situation is continuing to evolve, and many uncertainties remain as to the effect the COVID-19 crisis will have on the on the domestic and regional economies. Accordingly, the forecasts do not fully identify and quantify the impact of all COVID-19 related uncertainties and implications. Changes to market conditions could substantively affect the on the economies. These forecasts are best understood as a ‘most likely’ outcome around which unexpected (or unprojected) events will produce different outcomes. The Regional Economic Scenario Forecasts have been developed using a combination of publicly available data and proprietary Deloitte economic models. It may be possible to provide more detailed economic analysis of a specific sector or region, with access to additional local data and additional analysis. Please contact Liza van der Merwe from the Deloitte Access Economics team if you would like to discuss this further. © 2020. For information, contact Deloitte Scenario Modelling Tools User Guidance v1.0 | September 2020 38
Data Sources

 Other than the Regional Economic Scenario Forecasts, which have been developed by Deloitte Access Economics, all
 other data sources included on the dashboard have been provided from the following agencies: Statistics NZ, MBIE,
 MSD, Ministry of Health, and RBNZ. In some cases, the data sourced from public sector agencies may in turn be
 sourced from other sources (such as ANZ economic confidence indices). In some cases, the data is provided by the
 agency publicly and has been re-represented on this dashboard for convenience. In other cases, the agency has
 provided data in a format that is relevant for this project, eg with additional granularity at the local authority level. Any
 further updates to the dashboards will depend on the agencies continuing to provide the existing data in the current
 format.

 One of the key data sets used in this dashboard is sourced from Stats NZ's COVID-19 data portal, which gathers key
 high-frequency and near real-time economic indicators to help track the impact of COVID-19 on the economy. A
 subset of the data sets from this data portal are presented on this dashboard, focussing on key economic indicators
 and data sets that are available at a regional or local authority level of granularity. The full data portal can be accessed
 here: https://www.stats.govt.nz/experimental/covid-19-data-portal

© 2020. For information, contact Deloitte                                              Scenario Modelling Tools   User Guidance v1.0 | September 2020   39
Deloitte refers to one or more of Deloitte Touche Tohmatsu Limited (“DTTL”), its global network of member firms, and their related entities (collectively, the “Deloitte
organisation”). DTTL (also referred to as “Deloitte Global”) and each of its member firms and related entities are legally separate and independent entities, which cannot obligate or
bind each other in respect of third parties. DTTL and each DTTL member firm and related entity is liable only for its own acts and omissions, and not those of each other. DTTL does
not provide services to clients. Please see www.deloitte.com/about to learn more.

Deloitte Asia Pacific Limited is a company limited by guarantee and a member firm of DTTL. Members of Deloitte Asia Pacific Limited and their related entities, each of which are
separate and independent legal entities, provide services from more than 100 cities across the region, including Auckland, Bangkok, Beijing, Hanoi, Hong Kong, Jakarta, Kuala
Lumpur, Manila, Melbourne, Osaka, Seoul, Shanghai, Singapore, Sydney, Taipei and Tokyo.

Deloitte is a leading global provider of audit and assurance, consulting, financial advisory, risk advisory, tax and related services. Our global network of member firms and related
entities in more than 150 countries and territories (collectively, the “Deloitte organisation”) serves four out of five Fortune Global 500® companies. Learn how Deloitte’s
approximately 312,000 people make an impact that matters at www.deloitte.com.

Deloitte New Zealand brings together more than 1400 specialist professionals providing audit, tax, technology and systems, strategy and performance improvement, risk
management, corporate finance, business recovery, forensic and accounting services. Our people are based in Auckland, Hamilton, Rotorua, Wellington, Christchurch, Queenstown
and Dunedin, serving clients that range from New Zealand’s largest companies and public sector organisations to smaller businesses with ambition to grow. For more information
about Deloitte in New Zealand, look to our website www.deloitte.co.nz.

© 2020. For information, contact Deloitte Global.
You can also read