Design and Implementation of a Hydroponic Strawberry Monitoring and Harvesting Timing Information Supporting System Based on Nano AI-Cloud and ...
←
→
Page content transcription
If your browser does not render page correctly, please read the page content below
electronics
Article
Design and Implementation of a Hydroponic Strawberry
Monitoring and Harvesting Timing Information Supporting
System Based on Nano AI-Cloud and IoT-Edge
Sun Park *            and JongWon Kim

                                          Artificial Intelligence Graduate School, Gwangju Institute of Science and Technology, 123 Cheomdangwagi-ro,
                                          Buk-gu, Gwangju 61005, Korea; jongwon@gist.ac.kr
                                          * Correspondence: sunpark@gist.ac.kr; Tel.: +82-62-715-6380

                                          Abstract: The strawberry market in South Korea is actually the largest market among horticultural
                                          crops. Strawberry cultivation in South Korea changed from field cultivation to facility cultivation
                                          in order to increase production. However, the decrease in production manpower due to aging
                                          is increasing the demand for the automation of strawberry cultivation. Predicting the harvest of
                                          strawberries is an important research topic, as strawberry production requires the most manpower
                                          for harvest. In addition, the growing environment has a great influence on strawberry production
                                          as hydroponic cultivation of strawberries is increasing. In this paper, we design and implement an
                                          integrated system that monitors strawberry hydroponic environmental data and determines when to

                                   harvest with the concept of IoT-Edge-AI-Cloud. The proposed monitoring system collects, stores and
                                          visualizes strawberry growing environment data. The proposed harvest decision system classifies the
Citation: Park, S.; Kim, J. Design and
                                          strawberry maturity level in images using a deep learning algorithm. The monitoring and analysis
Implementation of a Hydroponic
                                          results are visualized in an integrated interface, which provides a variety of basic data for strawberry
Strawberry Monitoring and
Harvesting Timing Information
                                          cultivation. Even if the strawberry cultivation area increases, the proposed system can be easily
Supporting System Based on Nano           expanded and flexibly based on a virtualized container with the concept of IoT-Edge-AI-Cloud. The
AI-Cloud and IoT-Edge. Electronics        monitoring system was verified by monitoring a hydroponic strawberry environment for 4 months.
2021, 10, 1400. https://doi.org/          In addition, the harvest decision system was verified using strawberry pictures acquired from Smart
10.3390/electronics10121400               Berry Farm.

Academic Editors: Lei Shu,                Keywords: strawberry; cultivation environment monitoring; harvest decision; IoT edge; AI cloud;
Simon Pearson, Ye Liu, Mohamed            deep learning; hydroponic
Amine Ferrag and Leandros Maglaras

Received: 7 May 2021
Accepted: 9 June 2021
                                          1. Introduction
Published: 10 June 2021
                                                Strawberry cultivation is one of the most globalized horticultural industries, as straw-
Publisher’s Note: MDPI stays neutral
                                          berries are extensively consumed worldwide. The global strawberry market size is expected
with regard to jurisdictional claims in
                                          to reach USD 22,450 million by 2026, from USD 18,370 million in 2020. In other words,
published maps and institutional affil-   it is expected to grow at an annual average of 3.4% from 2021 to 2026. According to the
iations.                                  Food and Agriculture Organization (FAO), worldwide strawberry production increased
                                          by 39.4% between 2008 and 2018. Strawberry production is increasing every year with
                                          increasing consumption [1,2].
                                                Harvest maturity is an important factor in determining the shelf life and the quality,
Copyright: © 2021 by the authors.
                                          taste, juice and texture of the final fruit. Harvesting of immature strawberries leads to
Licensee MDPI, Basel, Switzerland.
                                          poor quality, internal deterioration and easy spoilage. Conversely, delayed harvesting
This article is an open access article
                                          of strawberries significantly increases fruit damage, which can lead to rapid losses after
distributed under the terms and           harvest. To manage the quantitative or qualitative loss of strawberries before and after
conditions of the Creative Commons        harvesting, it is important to understand the delicacy of strawberries, conditions of phys-
Attribution (CC BY) license (https://     iological maturity, timely harvesting methods and other factors. The degradation of the
creativecommons.org/licenses/by/          quality of strawberries is a major problem for strawberry growers. Monitoring the growth
4.0/).                                    and environment of strawberries can reduce damage to strawberries during harvest or

Electronics 2021, 10, 1400. https://doi.org/10.3390/electronics10121400                                  https://www.mdpi.com/journal/electronics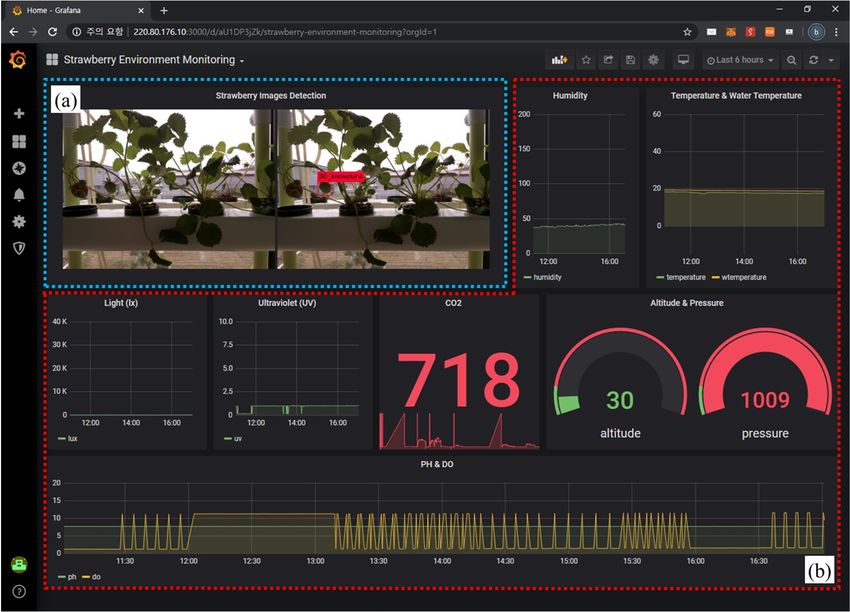
Electronics 2021, 10, 1400                                                                                          2 of 15

                             help farmers to control ripening progress. In general, the detection of all types of dis-
                             eases and evaluation of the ripening stage of strawberries are carried out through manual
                             inspection and evaluation according to the personal experience of the farmer. Manual
                             identification of mature strawberries for harvesting is time- and labor-intensive. At the
                             same time, strawberry production has to overcome unfavorable agricultural conditions,
                             such as water shortages, changes in the growing environment and climate change. Thus,
                             improving various strawberry farming practices with innovative technologies can enhance
                             the strategic advantage of agricultural production.
                                  In order to overcome such obstacles to strawberry farming, this paper designs and
                             develops a system capable of monitoring the strawberry cultivation environment in real
                             time and supporting decision makers with enhanced information about harvesting timing.
                             The proposed system is designed to collect, store and analyze strawberry environmental
                             data and photos with the concept of IoT-Edge-AI-Cloud [3,4]. The proposed monitoring
                             system collects 13 types of related cultivation environment data using the IoT-Edge module.
                             The collected environmental data are stored and visualized in a nano-sized private cloud-
                             based database server and visualization server, respectively. The proposed harvest decision
                             system classifies strawberry objects according to their maturity level using a classification
                             model based on a deep learning YOLO (You Only Look Once) algorithm in a nano-sized
                             private AI-Cloud-based analysis server. The IoT-Edge device of the proposed system
                             can be implemented cost-effectively based on Arduino and Raspberry Pi. The proposed
                             system can also easily and flexibly expand the system via container virtualization of the
                             system based on AI-Cloud, even if the applied strawberry farm area increases. In other
                             words, the number of container servers based on virtualization can easily be increased
                             whenever necessary. The system can efficiently manage strawberry cultivation and harvest
                             by integrating and visualizing strawberry cultivation environment monitoring data and
                             strawberry ripeness classification. The monitoring and analysis results are visualized in
                             an integrated interface, which provides a variety of basic data (e.g., production volume,
                             harvest time and pest diagnosis) for strawberry cultivation. The proposed monitoring
                             system can easily and stably construct big data of strawberry cultivation environments.
                             In other words, it can monitor the 13 types of collected environmental data in real time to
                             understand the growth environment. Additionally, the optimal growth environment can
                             be analyzed by utilizing big data that have been accumulated from the growth cycle. The
                             remainder of this paper is organized as follows: Section 2 describes the related studies on
                             methods of growing environment monitoring and maturity classification; Section 3 explains
                             the hydroponic strawberry monitoring and harvest decision system; Section 4 describes the
                             operational use cases of the hydroponic strawberry monitoring and the tests of the harvest
                             decision system. Finally, Section 5 discusses the conclusions and future direction.

                             2. Related Works
                                  This chapter reviews the related studies on fruit and vegetable cultivation monitoring
                             and maturity classification. Bharti et al. [5] proposed a hydroponic tomato monitoring
                             system that uses a microprocessor to transmit temperature and plant size data to the
                             cloud using the message queuing telemetry transport (MQTT). It can also check the saved
                             data via an Android application. Joshitha et al. [6] used Raspberry Pi and sensors to
                             store data on temperature, humidity, water level, soil level, etc., in the Ubidots cloud
                             database from a hydroponic cultivation system. Herman and Surantha [7] proposed an
                             intelligent monitoring and control system for hydroponic precision farming. The system
                             was used to monitor the water and nutrition needs of plants, while fuzzy logic was designed
                             to precisely control the supply of water and nutrients. Fakhrurroja et al. [8] proposed
                             an automatic pH (potential of hydrogen) and humidity control system for hydroponic
                             cultivation using a pH sensor, humidity sensor, Arduino, Raspberry Pi, and fuzzy logic.
                             As a result of the fuzzy model, the pH of the water is controlled using a nutrient pump
                             and a weak acid pump. Verma et al. [9] proposed a framework to predict the absolute
                             crop growth rate using a machine learning method for the tomato crop in a hydroponic
Electronics 2021, 10, 1400                                                                                          3 of 15

                             system. Their method helps to understand the impact of important variables in the correct
                             nutrient supply. Pawar et al. [10] designed an IoT-enabled Automated Hydroponics
                             system using NodeMCU and Blynk. Their method consists of a monitoring stage and
                             automation. In the monitoring stage, temperature, humidity and pH are monitored.
                             During automation, the levels of pH, water, temperature and humidity are adjusted.
                             Issarny et al. [11] introduced the LATTICE framework for the optimization of IoT system
                             configuration at the edge, provided the ontological description of the target IoT system.
                             The framework showed an example applied to a hydroponic room of vegetables for
                             monitoring and controlling several physical variables (e.g., temperature, humidity, CO2 ,
                             air flow, lighting and fertilizer concentration, balance and pH). Samijayani et al. [12]
                             implemented wireless sensor networks with Zigbee and Wi-Fi for hydroponics plants. The
                             networks are used by the Zigbee-based transceiver in the sensor node and the Wi-Fi-based
                             gateway in the coordinator node. Adidrana and Surantha [13] proposed a monitoring
                             system to measure pH, TDS (total dissolved solids) and nutrient temperature values in the
                             nutrient film technique using a couple of sensors. The system used lettuce as the object of
                             experiments and applied the k-nearest neighbor algorithm to predict the classification of
                             nutrient conditions.
                                   Ge et al. [14] presented a machine vision system in a strawberry-harvesting robot
                             for the localization of strawberries and environment perception in tabletop strawberry
                             production. The system utilized a deep learning network for instance segmentation to
                             detect the target strawberries. An environment perception algorithm was proposed to
                             identify a safe manipulation region and the strawberries within this region. A safe region
                             classification method was proposed to identify the pickable strawberries. Yu et al. [15]
                             proposed a harvesting robot for ridge-planted strawberries and a fruit pose estimator.
                             The proposed harvesting robot was designed on the servo control system of a strawberry-
                             harvesting robot suitable for the narrow ridge-planting mode. The fruit pose estimator,
                             based on the rotated YOLO (R-YOLO), was suitable for strawberry fruit in the narrow
                             spaces of the ridge-planting mode. Feng et al. [16] designed a harvesting robot for tabletop-
                             cultivated strawberry. The robot system consists of an information acquisition part, a
                             harvesting execution part, a controller and other auxiliaries. The information acquisition
                             part includes a distant- and close-view camera, an artificial light source and obstacle
                             detection sensors. The distant-view camera is used to dynamically identify and locate the
                             mature fruit in the robot’s view field. The close-range camera is used to obtain close-view
                             images of the fruit. The artificial light source can compensate for the variable sunlight
                             conditions under agricultural environments. Huang et al. [17] proposed a fuzzy Mask
                             R-CNN (regions with convolutional neural network) model to automatically identify the
                             ripeness levels of cherry tomatoes. The proposed method used a fuzzy c-means model to
                             maintain the spatial information of various foreground and background elements of the
                             image. It also used Mask R-CNN to precisely identify each tomato. The method used a
                             hue saturation value color model and fuzzy inference rules to predict the ripeness of the
                             tomatoes. Altaheri et al. [18] proposed a machine vision framework for date fruit harvesting,
                             which uses three classification models to classify date fruit images in real time according
                             to their type, maturity and harvesting decision. Zhang et al. [19] proposed a CNN-based
                             classification method for a tomato-harvesting robot to improve the accuracy and scalability
                             of tomato ripeness with a small amount of training data. The authors of [20] proposed
                             a scheme using machine-vision-based techniques for automated grading of mangoes
                             according to their maturity level in terms of actual days to rot and quality attributes such
                             as size and shape. Saputro et al. [21] introduced a banana maturity prediction system using
                             visible near-infrared imaging based on the chlorophyll characteristic to estimate maturity
                             and chlorophyll content non-destructively. Kuang et al. [22] proposed a kiwifruit classifier
                             using a multivariate alternating decision tree and deep learning.
                                   The proposed system collects 13 types of strawberry growth environment data,
                             whereas the environmental information monitored in the previous related works [5–13]
                             consisted of two to eight types. By collecting more environmental information compared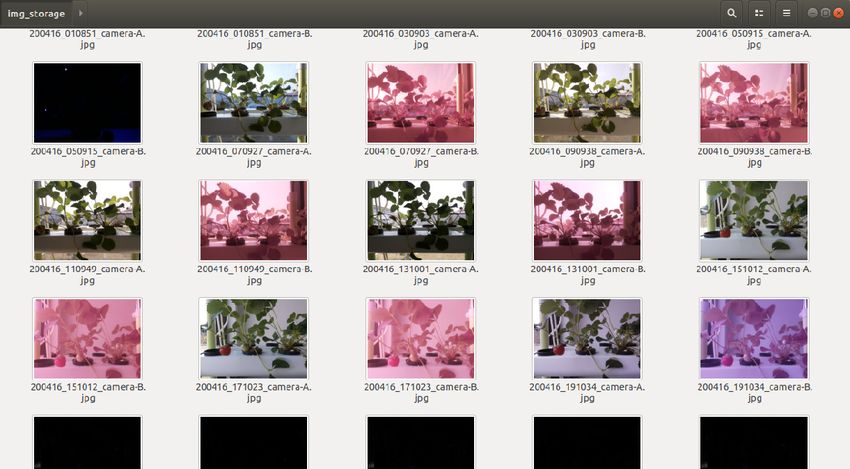
Electronics 2021, 10, 1400 4 of 15
Electronics 2021, 10, x FOR PEER REVIEW 4 of 16
to the related
consisted works,
of two it istypes.
to eight possible to accessmore
By collecting moreenvironmental
diverse methods when analyzing
information compared the
to the related
growing works, it isAs
environment. possible to access
the related works more diverse
[5–13] methods
involve when
simply analyzing
collecting the
environ-
growing
mental environment.
data As the related
or simply storing works [5–13]
the collected data ininvolve simply
the cloud, thecollecting
additionenvironmen-
of functions to
tal related
the data or simply
works storing
is limited.the collected
By contrast, datathe in the cloud, the
proposed addition
method of functions
is designed to to the
facilitate
related works
function is limited.
expansion By contrast,
and analysis, as the proposed
it consists of method
an IoT-Edgeis designed
module to and
facilitate func-
a nano-sized
tion expansion
private AI-Cloudand analysis,The
module. as itproposed
consists ofmethod
an IoT-Edge modulethe
determines andstrawberry
a nano-sized private
harvest time
AI-Cloud module. The proposed method determines the strawberry harvest
by using a deep-learning-based method similar to related studies [14,15,17,19]. However, time by using
a deep-learning-based
the methodstudies
difference from the related similar istothatrelated
it is studies
designed [14,15,17,19].
based on a However,
virtualizedthe dif-
container
ference from the related studies is
to increase the scalability of the function.that it is designed based on a virtualized container to
increase the scalability of the function.
3. Hydroponic Strawberry Monitoring and Harvest Decision System
3. Hydroponic Strawberry Monitoring and Harvest Decision System
The following sections describe the components of the device hardware and module
The following
architecture for the sections
hydroponic describe the components
strawberry monitoring of the
anddevice hardware
harvest decisionand module
system.
architecture for the hydroponic strawberry monitoring and harvest decision system.
3.1. System Overview and Device Components
3.1. System Overview and Device Components
A hydroponic strawberry monitoring and harvest decision system prototype was de-
signedAfor
hydroponic
collectingstrawberry monitoringdata,
growth environment and analyzing
harvest decision
optimalsystem prototype
growing was de-and
environments
signed for collecting
identifying growth environment
mature strawberries. data, analyzing
The proposed optimal
system consists ofgrowing environments
a hydroponic strawberry
and identifying
monitoring mature
IoT-Edge strawberries.
device and a GPUTheworkstation
proposed system consists
device, of a in
as shown hydroponic
Figure 1. straw-
berry monitoring IoT-Edge device and a GPU workstation device, as shown in Figure 1.
Figure1.1. The
Figure The hydroponic
hydroponic strawberry
strawberrymonitoring
monitoringand
andharvest
harvestdecision system.
decision system.
3.1.1.
3.1.1. Hydroponics System
Hydroponics System
In
Inthis
this paper,
paper, a home hydroponic
a home hydroponiccultivation
cultivationsystem
system was
was used
used to monitor
to monitor strawberry
strawberry
growth
growthinformation and verify
information and verifyharvest
harvestdecision
decisioninformation,
information, asas shown
shown in Figure
in Figure 1(6).
1(6). TheThe
hydroponic
hydroponic cultivation systemconsists
cultivation system consistsofofa ahydroponic
hydroponic shelf,
shelf, a water
a water tank
tank andand a water
a water
pump.
pump.TheThe hydroponic shelf consists
hydroponic shelf consistsofofaatotal
totalofofthree
three floors
floors withwith
twotwo pipes
pipes perper floor
floor andand
32
32plants.
plants. Seolhyang strawberry[23]
Seolhyang strawberry [23]was
wasgrown
grownininthe the hydroponic
hydroponic cultivation
cultivation system.
system.
3.1.2.
3.1.2. Hydroponic StrawberryMonitoring
Hydroponic Strawberry MonitoringIoT-Edge
IoT-EdgeDevice
Device
The
TheIoT-Edge
IoT-Edge device collectsgrowth
device collects growthenvironment
environment data
data forfor optimal
optimal cultivation
cultivation environ-
environ-
ment
mentanalysis when growing
analysis when growingthe thehydroponic
hydroponic strawberry
strawberry solution.
solution. In In addition,
addition, strawberry
strawberry
images
imagesare are taken
taken for identification ofmature
identification of maturestrawberries
strawberries and
and calculation
calculation of the
of the normalized
normalized
difference vegetationindex
difference vegetation index (NDVI).
(NDVI). TheThe IoT-Edge
IoT-Edge device
device is composed
is composed of Raspberry
of Raspberry Pi, Ar- Pi,
Arduino, sensors,
duino, sensors, Raspberry
Raspberry Pi cameras
Pi cameras andand a power
a power supply,
supply, as shown
as shown in Figure
in Figure 1b. Table
1b. Table 1 1
showsthe
shows thecomponent
component hardware
hardware specification
specification of the IoT-Edge device.device. In
In this
this study,
study, envi-
environ-
ronmental
mental datadata
and and strawberry
strawberry photos
photos were
were collected
collected in ainfixed
a fixed environment
environment forfor verifica- of
verification
tion of the proposed system. For this reason, one strawberry plant
the proposed system. For this reason, one strawberry plant was selected and the was selected and the
distance
between the camera and the strawberry plant was fixed. The Raspberry Pi Camera v2.1
module has a fixed focus, so we manually turned the focus ring to focus. The camera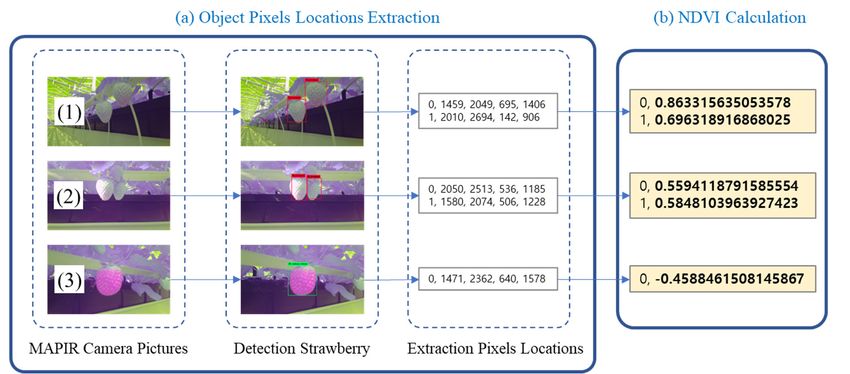
Electronics 2021, 10, 1400                                                                                               5 of 15

                             module in Figure 1(4) is connected to the Arducam multi-camera module that is connected
                             to the Raspberry Pi module in Figure 1(1).

                             Table 1. The component hardware specification of the IoT-Edge device.

                                 Component                                  Hardware Specification

                                                    •    Raspberry Pi 3B+
                                                         -    CPU: ARM Cortex-A53 1.4 GHz
                                                         -    RAM: 1 GB SRAM
                                                         -    Wi-Fi: 2.4 GHz and 5 GHz
                                                         -    Ethernet: 300Mbps
                                 Raspberry Pi
                                 (Figure 1(1))      •    microSD 256 GB
                                                    •    Arducam Multi Camera Adapter Module V2.1
                                                         -    Work with 5 MP or 8 MP cameras
                                                         -    Accommodate 4 Raspberry Pi cameras on a single RPi board
                                                         -    3 GPIOs required for multiplexing
                                                         -    Cameras work sequentially, not simultaneously

                                                    •    Arduino Mega 2560
                                                         -    Microcontroller: ATmega2560
                                                         -    Digital I/O pins: 54
                                   Arduino               -    Analog input pins: 16
                                 (Figure 1(2))           -    Flash memory: 256 KB
                                                         -    SRAM: 8 KB
                                                         -    EEPROM: 4 KB
                                                         -    Clock speed: 16 MHz

                                                    •    Light intensity sensor (lux): GY-30
                                                    •    pH sensor: SEN0161 (pH probe, circuit board, analog cable)
                                                    •    Dissolved oxygen sensor: Kit-103DX (DO circuit, probe, carrier board)
                                    Sensors         •    Ultraviolet sensor: ML8511
                                 (Figure 1(3))      •    TDS Sensor: Gravity TDS Meter v1.0 (EC (electrical conductivity),
                                                         TDS (total dissolved solids))
                                                    •    Temperature/Humidity/Pressure/Altitude: BME/BMP280
                                                    •    Water temperature sensor: DS18B20
                                                    •    CO2 sensor (value, status): MG811

                                                    •    Raspberry PI Camera Module V2.1/Raspberry PI NoIR Camera
                                                         Module V2.1 (8 megapixel)
                                   Cameras
                                 (Figure 1(4))           -    3280 × 2464 resolution
                                                         -    CSI (camera serial interface)-2 bus
                                                         -    Fixed focus module
                                 Power supply
                                  (Figure 1(5))     •    USB Smart Charger 5v 2A 5 ports

                             3.1.3. GPU Workstation
                                  The GPU workstation device in Figure 1c stores the growing-environment data and
                             strawberry images collected from the IoT-Edge device. It also selects images of mature
                             strawberries that can be harvested. The NDVI value is calculated to determine if the
                             strawberry is healthy. Table 2 shows the component hardware specification of the GPU
                             workstation device.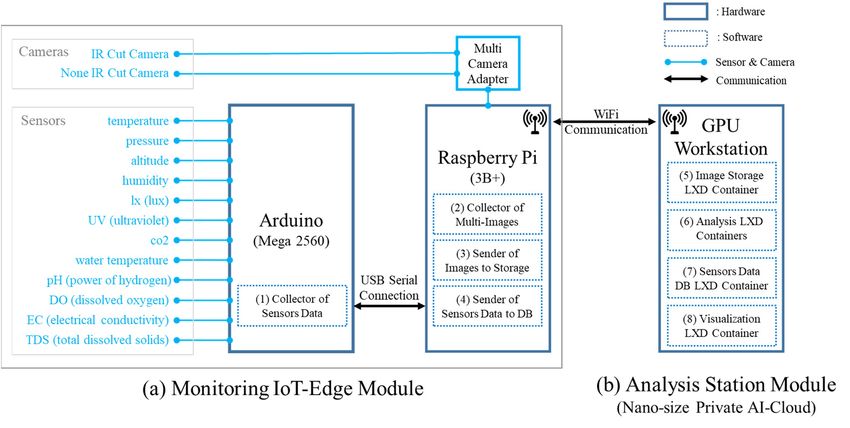
Electronics 2021, 10, 1400                                                                                                   6 of 15

  Electronics 2021, 10, x FOR PEER REVIEW                                                                                      6 of 16
                                  Table 2. The component hardware specification of the GPU workstation device (Figure 1c).

                                           Component                                 Hardware Specification
                                    Table 2. The component hardware specification of the GPU workstation device (Figure 1c).
                                                               •     AMD Ryzen Threadripper 2950X
                                         Component                                Hardware Specification
                                               CPU                   -    16-Core Processor 32 Thread
                                                         •   AMD Ryzen
                                                                     -    Threadripper   2950X
                                                                          3.5 GHz (4.4 GHz   Max Boost)
                                                               - • 16-Core
                                                                      WaterProcessor   32 Thread
                                                                             cooling system
                                              CPU
                                                               -   3.5 GHz (4.4 GHz Max Boost)
                                                                 •    Samsung DDR4
                                                           •   Water cooling system
                                                RAM                   -    16 GB × 8 = 128 GB
                                                           •   Samsung- DDR4
                                                                           Configuration clock speed: 2666 MT/s
                                              RAM              -   16 GB ∗ 8 = 128 GB
                                                SSD            - • Configuration
                                                                      m.2 NVMe 1TB clock speed: 2666 MT/s
                                               SSD         •    m.2
                                                                 • NVMe
                                                                     X3991TB
                                                                          AORUS PRO
                                                           •    X399 AORUS
                                                                       -      PRO AMD 2nd Generation Ryzen™
                                                                            Supports
                                             Main board         -           Threadripper™
                                                                    Supports AMD 2nd Generation Ryzen™ Threadripper™
                                            Main board                 -    Quad Channel ECC/Non-ECC DDR4, 8 DIMMs
                                                                -   Quad Channel ECC/Non-ECC DDR4, 8 DIMMs
                                                                       -    Fast Front and Rear USB 3.1 Type-C™ Interface
                                                                -   Fast Front and Rear USB 3.1 Type-C™ Interface
                                                                       -    4-Way Graphics Support
                                                                -   4-Way Graphics Support
                                                           •     • ROG
                                                                ASUS ASUSSTRIX
                                                                          ROG GTX    GTX∗1080ti
                                                                                   1080ti
                                                                               STRIX      4     ×4
                                               GPU              -     - Clock
                                                                    Base  Base1596
                                                                               Clock 1596 MHZ
                                                                                   MHZ
                                              GPU                     - 3584
                                                                          Core 3584
                                                                -   Core
                                                           •     • cooling
                                                                Water Water cooling
                                                                             systemsystem

                                  3.2. System Module Architecture
                                    3.2. System Module Architecture
                                        The system module architecture was designed to collect, store and analyze strawberry
                                          The system module architecture was designed to collect, store and analyze straw-
                                  cultivation environment information from a software point of view for functions’ imple-
                                    berry cultivation environment information from a software point of view for functions’
                                  mentation. The system module consists of a monitoring IoT-Edge module and an analysis
                                    implementation. The system module consists of a monitoring IoT-Edge module and an
                                  station module, as shown in Figure 2.
                                    analysis station module, as shown in Figure 2.

                                    Figure
                                  Figure 2. 2.
                                            TheThe system
                                                 system   module
                                                        module   architecture.
                                                               architecture.

                                  3.2.1. Monitoring IoT-Edge Module
                                    3.2.1. Monitoring IoT-Edge Module
                                        The IoT-Edge module has functions of collecting sensor data, transmitting sensing data
                                          The IoT-Edge module has functions of collecting sensor data, transmitting sensing
                                  to a database, taking multi-camera images and transmitting the images to a storage device. As
                                    data to a database, taking multi-camera images and transmitting the images to a storage
                                  shown in Figure 2a, the hardware of the IoT-Edge module consists of an Arduino module that
                                    device. As shown in Figure 2a, the hardware of the IoT-Edge module consists of an Ar-
                                  acts as an IoT sensor hub and a Raspberry Pi module that acts as an edge device. Raspberry
                                    duino module that acts as an IoT sensor hub and a Raspberry Pi module that acts as an
                                  Pi’s GPIO (General Purpose Input Output) does not support analog sensors because it does
                                    edge device. Raspberry Pi’s GPIO (General Purpose Input Output) does not support ana-
                                    log sensors because it does not support ADCs (analog-to-digital converters). Additionally,
                                    the number of sensors that can be attached is limited because there are special-purpose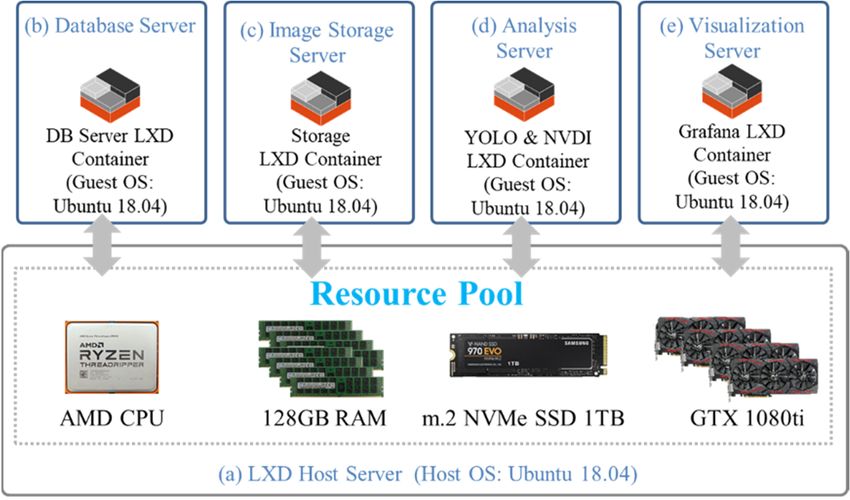
Electronics 2021, 10, 1400                                                                                           7 of 15

                             not support ADCs (analog-to-digital converters). Additionally, the number of sensors that
                             can be attached is limited because there are special-purpose GPIO pins. The Arduino module
                             has 16 analog input pins and 54 digital input/output pins, so it can easily add sensors. The
                             Arducam Multi Camera Adapter Module uses a single CSI camera port on the Raspberry
                             Pi module to connect two cameras. It also uses three GPIOs on the Raspberry Pi module
                             for multiplexing support. The Sensor Data Collector of Figure 2(1) collects 13 types of
                             environmental data from eight sensors. Table 3 shows the sensors related to the data being
                             collected. The Data Collector is programmed in C language using Sketch, an Arduino
                             integrated development environment (IDE), to send the 13 types of sensing data to the
                             IoT-Edge device every 0.5 s. The monitoring function of the IoT-Edge module is verified by
                             collecting and transmitting data that are repeated every 0.5 s.
                                   The Sensors Data Sender in Figure 2(4) stores the data collected through USB serial
                             communication in the database of the GPU workstation. The Data Sender is programmed
                             to receive sensing data from /dev/ttyUSB0 of the Raspberry Pi serial communication
                             port using Python language and store it in the sensors table of the Maria database (i.e.,
                             Figure 2(7) Sensors Data DB LXD Container) of the workstation. The Multi Camera Image
                             Collector in Figure 2(2) captures and stores strawberry images from IR cut (infrared cut-
                             off filter) and non-IR cut cameras. The Python example program code of the Arducam
                             Multi Camera Adapter (i.e., Multi_Camera_Adapter_V2.2_python [24]) was modified to
                             capture strawberry images every 2 h with IR cut and non-IR cut cameras and store them
                             in the IoT-Edge device. The Multi Camera Image Sender in Figure 2(3) saves the images
                             stored on the IoT-Edge device to the workstation’s image storage. The Image Sender
                             was programmed in Bash shell script using the Linux command line utility SCP (Secure
                             Copy) so that strawberry images stored on the Raspberry Pi module can be saved to the
                             workstation’s image storage every day.

                             3.2.2. Analysis Station Module
                                   The analysis station module was designed with the concept of AI-Cloud, so if the
                             system needs to be expanded, the server container can be flexibly and easily increased. In
                             other words, the number of container servers based on virtualization can be easily increased
                             whenever the strawberry cultivation area increases. As shown in Figure 2b, the analysis
                             station module has functions, such as an image storage server in Figure 3c, analysis server
                             in Figure 3d, database server in Figure 3b and visualization server in Figure 3e. The module
                             was designed as a nano-sized private AI-Cloud to increase availability by separating it
                             into containers for each function. This means it is separated into a virtualized container
                             so that one of the analysis functions is shut down; as such, it cannot affect the operation
                             of other functions. In addition, in order to increase the hardware resource pool efficiency
                             and flexibility in relation to the functions of modules, it is composed of an infrastructure
                             in which AI and cloud are hyper-converged. As shown in Figure 3, the servers for each
                             function are containerized using Ubuntu’s LXD [25]. LXD is a container hypervisor that
                             Canonical made open source by improving the Linux container. Ubuntu version 18.04 was
                             used as the operating system for the host server of the analysis station module, and as the
                             operating system for the guest container server for each function.
                                   The Database Server container in Figure 3b is a database server that stores sensor data
                             from the Sensor Data Sender in Figure 2(4). MariaDB version 10.1.47 was installed in the
                             container. To store sensor data, a database named “growing_environment” was created,
                             and a table named “sensors” was created. Table 3 shows the schema of the sensor table by
                             the “DESC sensor” query command. As shown in Table 4, the sensors table has 16 fields.
                             The id field is a primary key, of which the number is automatically increased from 1. The
                             time_sec field records a timestamp of the time point at which sensor data are stored in
                             order to process them as a time series. The sensor field is used to identify IoT-Edge devices.
                             In this work, since only one IoT-Edge device is used, 1 is recorded in the sensor field. The
                             thirteen data types collected from the eight sensors in Table 1 (sensors) are stored fields in
                             Table 3, from temperature to tds.
Electronics 2021, 10, 1400 8 of 15
Electronics 2021, 10, x FOR PEER REVIEW 8 of 16
Figure 3. Nano-sized private AI-Cloud for the functions of analysis station module.
Figure 3. Nano-sized private AI-Cloud for the functions of analysis station module.
Table 3. The sensors table schema in the growing_environment database.
Table 3. The sensors table schema in the growing_environment database.
Field Type Null Key Default Extra
Field Type Null Key Default Extra
id bigint (20) NO PRI NULL auto_increment
id bigint (20) NO PRI CUR- NULL auto_increment
on update CUR-
time_sec timestamp NO on update CUR-
time_sec timestamp NO RENT_TIMESTAMP
CURRENT_TIMESTAMP RENT_TIMESTAMP
RENT_TIMESTAMP
sensor
sensor intint
(11)
(11) YES YES NULL NULL
temperature
temperature float
float YES YES NULL NULL
pressure
pressure float
float YES YES NULL NULL
altitude float YES NULL
altitude
humidity float
float YES YES NULL NULL
humidity
lux float
float YES YES NULL NULL
uv
lux float
float YES YES NULL NULL
co2 float YES NULL
uv
co2status
float
char (2)
YES YES NULL NULL
co2
wtemperature float
float YES YES NULL NULL
ph
co2status charfloat
(2) YES YES NULL NULL
do
wtemperature float
float YES YES NULL NULL
ec float YES NULL
ph
tds float
float YES YES NULL NULL
do float YES NULL
ec float YES NULL
ThetdsImage Storage
float Server
YEScontainer in Figure
NULL3c is an image storage server that stores
strawberry pictures from the Multi Camera Image Sender in Figure 2(3). An image storage
pool wasThecreated
Image Storage Server
to separate thecontainer in Figure storage
server container’s 3c is an image storage
pool. The name server
of thethat stores
created
strawberry pictures from the Multi Camera Image Sender in Figure
image storage pool is img-storage, and the name of the existing storage pool is lxd-storage. 2(3). An image storage
pool
The was created
storage to separate
server container is the serverby
attached container’s storagepool,
the img-storage pool.inThe name
which of the
image created
data can
beimage
savedstorage
as a filepool is img-storage,
in ext4 file system and the[26,27].
format name of the existing storage pool is lxd-storage.
TheThe
storage server
Analysis container
Server is attached
container in Figureby the img-storage
3d has pool,
the function ofin which image
classifying data can
strawberry
be saved
images andascalculating
a file in ext4thefile system format
normalized [26,27].
difference vegetation index (NDVI) [28]. Strawberry
imageThe Analysis Server
classification is usedcontainer
to determine in Figure 3d hastime.
the harvest the function of classifying strawberry
images
The and calculatingServer
Visualization the normalized
container in difference
Figure 3e vegetation
visualizes index (NDVI)data
the sensor [28].ofStraw-
the
Database
berry imageServer container in
classification is Figure
used to3b and the results
determine of strawberry
the harvest time. object classification
of the The
Analysis Server container
Visualization in Figurein3d.
Server container Grafana
Figure version 7.1.5
3e visualizes was installed
the sensor in the
data of the Da-
container for the
tabase Server visualization
container in Figure of sensor
3b and data and images.
the results Ten fields
of strawberry objectwere visualizedof
classification
by connecting
the Grafana
Analysis Server with MariaDB’s
container in Figuregrowing_environment
3d. Grafana version 7.1.5 database on the Database
was installed in the con-
Server
tainer for the visualization of sensor data and images. Ten fields were visualized Server
container. In addition, it visualizes the strawberry image of the Image Storage by con-
container in Figurewith
necting Grafana 3c and the classified
MariaDB’s strawberry image of
growing_environment the Analysis
database on theServer container.
Database Server
container. In addition, it visualizes the strawberry image of the Image Storage Server con-
3.2.3. Data
tainer Handling
in Figure 3c andof Analysis Server
the classified strawberry image of the Analysis Server container.
NDVI can be used to analyze plant health by accurately indicating the state of chloro-
phyll
3.2.3.by observing
Data Handling changes in near-infrared
of Analysis Server light compared to red light. The strawberry
image classification function classifies the object of the strawberry image into six categoriesElectronics 2021, 10, 1400 9 of 15
Electronics 2021, 10, x FOR PEER REVIEW 9 of 16
according to the appearance maturity of the strawberry using a YOLO (You Only Look
Once) algorithm. The YOLO algorithm enables end-to-end training and real-time speeds
while maintaining high average precision. The algorithm is essentially a unified detection
modelNDVI without cana be used toprocessing
complex analyze plant health
pipeline thatbyuses
accurately
the wholeindicating
image the state
as the of chlo-
network
rophyll by observing changes in near-infrared light compared
input, which will be divided into an S × S grid. After selection from the network, the to red light. The strawberry
imagedirectly
model classification
outputs function classifies
the position of thetheobject
objectborder
of the and
strawberry image into six
the corresponding catego-
category
ries according to the appearance maturity of the strawberry
in the output layer. However, the algorithm is not effective in detecting close objects using a YOLO (You Only
Look Once) algorithm. The YOLO algorithm enables
and small populations. The versions of the YOLO algorithm consist of YOLO V1, YOLO end-to-end training and real-time
V2speeds
and YOLOwhile V3. maintaining
YOLO V1 high average precision.
transforms The algorithm
the target detection problem is essentially a unified
into a regression
problem using a single convolutional neural network that extracts bounding boxes as
detection model without a complex processing pipeline that uses the whole image andthe
network
class input, which
probabilities directlywillfrom
be divided
the image.into an YOLOS × SV2grid. After
is the selectionversion
improved from the ofnetwork,
YOLO
theThe
V1. model directlyarchitecture
modeling outputs theand position
training of the object
model of border
YOLO and V2 are theproposed
corresponding
based cate-
on
gory in the output layer. However, the algorithm is
Darknet-19 and five anchor boxes. YOLO V3 integrates Darknet-19 from YOLO V2 tonot effective in detecting close objects
and small
propose a newpopulations.
deeper andThe widerversions
feature ofextraction
the YOLOnetwork algorithm consist
called of YOLO
Darknet-53. V1, YOLO
TinyYOLO
V2 and YOLO V3. YOLO V1 transforms the target
is the light version of the YOLO. TinyYOLO is lighter and faster than YOLO whiledetection problem into a regression
also
problem usingother
outperforming a single
lightconvolutional
models’ accuracy neural network that extracts bounding boxes and
[29,30].
class probabilities
Figure 4 showsdirectly
a flowchartfromofthe theimage.
task ofYOLO training V2aisstrawberry
the improved image version of YOLO
classification
V1. Theusing
function modeling
the YOLO architecture and training
V3 algorithm and inferringmodelstrawberry
of YOLO V2 image are classification
proposed based usingon
Darknet-19
the and five anchor
trained function. As shownboxes. inYOLO
FigureV3 4a,integrates Darknet-19
6156 strawberry from YOLO
images V2 to pro-
were classified
pose
into sixa new deeperby
categories and wider feature
strawberry extraction
experts using YOLOnetworkMark called Darknet-53.
[31] for training TinyYOLO
the data.is
the light
Figure 4b version
shows the of the YOLO. of
inference TinyYOLO
classificationis lighter and faster
categories using than
theYOLOtrained while
model alsoand
out-
performing
real strawberry other lightdata.
image models’ The accuracy
categories [29,30].
consisted of immature, 30% mature, 50%
mature, 60% mature,
Figure 4 shows80% mature and
a flowchart mature.
of the task ofTable 5 shows
training the classification
a strawberry categories
image classification
offunction
strawberry usingimages
the YOLO and V3thealgorithm
number of and training
inferring data sets. The
strawberry maturation
image periodusing
classification of
strawberries lasts up As
the trained function. to shown
50 to 60 in days
Figure in4a,
winter, and the maturation
6156 strawberry images were period gradually
classified into six
shortens
categories asbythestrawberry
temperature increases
experts in spring.
using YOLO MarkThe [31]category
for training criteria
the data.in Table
Figure44bare set
shows
for the spring season. The strawberry NDVI calculation function
the inference of classification categories using the trained model and real strawberry im- was calculated by using
Equation
age data.(1)The andcategories
the position coordinates
consisted of the strawberry
of immature, 30% mature,object50%by the strawberry
mature, image
60% mature,
classification
80% maturefunction.and mature. Table 5 shows the classification categories of strawberry images
N IR − RED
and the number of training dataNDV sets. The
I = maturation period of strawberries lasts up to (1)50
N IR + RED
to 60 days in winter, and the maturation period gradually shortens as the temperature
where NDVI
increases in is the normalized
spring. The category differential
criteria invegetation set forNIR
Table 4 areindex, is a near-infrared
the spring season. Thevalue
straw-
and RED is a red value. NIR and RED represent reflectivity
berry NDVI calculation function was calculated by using Equation (1) and measured in the near-infrared
the position
and red wavelength
coordinates bands, respectively.
of the strawberry object by the strawberry image classification function.
Figure 4. Strawberry harvest decision function workflow.
Figure 4. Strawberry harvest decision function workflow.Electronics 2021, 10, 1400 10 of 15
Table 4. Strawberry image classification categories and training data sets.
Label 0 1 2 3 4 5
Immature 30% Mature 50% Mature 60% Mature 80% Mature Mature
Category Sum
Meaning Harvest Harvest Harvest Harvest Harvest Harvest
after 1 Month after 3 Weeks after 2 Weeks after 1 Week after 3 Days after 1 Day
Number of images 1005 1012 1017 1043 1038 1042 6156
4. Operational Use Case and Test
This section describes the operational use cases of the hydroponic strawberry mon-
itoring and the tests of the harvest decision system. The monitoring system monitored
environmental data for 5 months. Seolhyang strawberries [23] were grown for strawberry
monitoring in a home hydroponic cultivation system. The monitoring system was located
in our office with good natural light. April and May are actually the growing seasons of
strawberries. From June, the temperature was so high that all the strawberries dried up
and died. For this reason, only environmental information of the hydroponic cultivation
system was monitored from June to August. The experiment data of the strawberry harvest
decision system used 1575 strawberry photos taken using an MAPIR camera [32] at the
Smart Berry Farm [33] in South Korea. In order to evaluate the classification accuracy of
strawberry objects, 4329 strawberry objects included in the pictures were classified into the
categories in Table 4 by strawberry-growing experts.
4.1. Database Server for Monitoring Data
Monitoring data collected by the IoT-Edge module were stored and managed in the
MariaDB database server. The database server had a growing_environment database, which
contained a sensor table. The sensor table was composed of the DB schema of Table 3.
In the database server, 1,316,848 real data pieces, related to 13 categories of growing
environmental data, were stored from 4 April 2020, to 31 August 2020. Table 5 shows the
last 20 records stored in the sensors table using the query “select * from sensors order by id
desc limit 20”.
Table 5. Monitoring data of strawberry growing environment.
Id time_sec Sensor Temperature Pressure Altitude Humidity lux uv CO2 CO2 Status Wtemperature ph do ec tds
93263 2020-08-26 13:55 1 30.97 992.31 175.8 28.43 357.5 0.16 515 NR 32.75 7.3 2.16 0.01 943.76
93264 2020-08-26 13:57 1 31.23 991.94 178.97 30.29 189.17 0.12 500 NR 32.44 7.31 2.13 0.01 943.76
93265 2020-08-26 13:59 1 31.24 991.98 178.63 30.33 197.5 0.12 497 NR 32.44 7.31 2.1 0.01 943.76
93266 2020-08-26 14:00 1 31.24 991.99 178.51 30.31 199.17 0.12 495 NR 32.44 7.31 2.07 0.01 943.76
93267 2020-08-26 14:00 1 31.22 992 178.42 30.22 200.83 0.16 495 NR 32.44 7.31 2.04 0.01 943.76
93268 2020-08-26 14:01 1 31.22 991.97 178.73 30.28 190 0.12 509 NR 32.44 7.31 2.02 0.01 943.76
93269 2020-08-26 14:03 1 31.17 992.01 178.39 30.48 203.33 0.12 508 NR 32.44 7.31 2.07 0.01 943.76
93270 2020-08-26 14:05 1 31.19 991.96 178.76 30.38 199.17 0.12 510 NR 32.44 7.31 2.05 0.01 943.76
93271 2020-08-26 14:05 1 31.2 991.99 178.54 30.38 197.5 0.12 510 NR 32.44 7.31 2.04 0.01 943.76
93272 2020-08-26 14:06 1 31.19 991.96 178.76 30.38 195 0.12 510 NR 32.44 7.31 2.05 0.01 943.76
93273 2020-08-26 14:06 1 31.21 991.99 178.55 30.43 191.67 0.12 508 NR 32.44 7.31 2.06 0.01 943.76
93274 2020-08-26 14:08 1 31.06 991.97 178.69 30.03 187.5 0.12 510 NR 32.44 7.31 2.03 0.01 943.76
93275 2020-08-26 14:10 1 30.92 991.92 179.13 30.31 183.33 0.12 495 NR 32.44 7.31 2.05 0.01 943.76
93276 2020-08-26 14:11 1 30.88 991.94 178.95 30.1 183.33 0.16 496 NR 32.44 7.31 2.14 0.01 943.76
93277 2020-08-26 14:11 1 30.85 992 178.41 30.46 184.17 0.12 498 NR 32.44 7.31 2.08 0.01 943.76
93278 2020-08-26 14:12 1 30.81 991.99 178.53 30.58 185 0.16 500 NR 32.44 7.31 2.03 0.01 943.76
93279 2020-08-26 14:14 1 30.88 991.91 179.24 30.88 193.33 0.13 499 NR 32.44 7.31 2.12 0.01 943.76
93280 2020-08-26 14:16 1 30.93 991.93 179.04 30.32 210.83 0.12 511 NR 32.44 7.31 2.05 0.01 943.76
93281 2020-08-26 14:16 1 30.96 991.91 179.24 30.75 216.67 0.16 511 NR 32.44 7.31 2.1 0.01 943.76
93282 2020-08-26 14:17 1 30.96 991.9 179.27 30.59 223.33 0.12 511 NR 32.44 7.31 2.13 0.01 943.76
4.2. Image Storage Server for Analysis Data
Strawberry pictures for strawberry harvest determination and NDVI calculation
were taken by the IoT-Edge module and stored in the image storage server. In total,93281 2020-08-26 14:16 1 30.96 991.91 179.24 30.75 216.67 0.16 511 NR 32.44 7.31 2.1 0.01 943.76
93282 2020-08-26 14:17 1 30.96 991.9 179.27 30.59 223.33 0.12 511 NR 32.44 7.31 2.13 0.01 943.76
Electronics 2021, 10, 1400 11 of 15
4.2. Image Storage Server for Analysis Data
Strawberry pictures for strawberry harvest determination and NDVI calculation
were taken by the IoT-Edge module and stored in the image storage server. In total, 3248
3248 strawberry
strawberry photos
photos were
were takentaken
andand saved
saved from
from 10 10 April
April 2020
2020 toto2525August
August2020.
2020.Half
Halfof
ofthe
the3248
3248photos
photoswere
weretaken
taken with
with an
an IR
IR cutcut camera and the other half with a non-IRcut
camera and the other half with a non-IR cut
camera.
camera. Figure 5 shows the pictures of strawberriesstored
Figure 5 shows the pictures of strawberries storedon
onthe
theimage-storage
image-storageserver.
server.
These
Thesepictures
pictureswere
weretaken
takenatatintervals
intervalsofof2 2h.h.The
Thephotos
photosnamed
namedwith
withcamera-A
camera-Awere
weretaken
taken
with the IR cut camera, and the photos named with camera-B were taken with the non-IR
with the IR cut camera, and the photos named with camera-B were taken with the non-IR
cut camera.
cut camera.
Figure 5. Strawberry photos stored on the Image Storage Server.
Figure 5. Strawberry photos stored on the Image Storage Server.
4.3.Analysis
4.3. AnalysisServer
Serverfor
forStrawberry
StrawberryHarvest
HarvestDetermination
Determinationand andNDVI
NDVICalculation
Calculation
InInthis
thissubsection,
subsection,the thestrawberry
strawberryclassification
classificationfunction
functionand andNDVI
NDVIcalculation
calculationtests
tests
aredescribed.
are described.The Theclassification
classificationaccuracy
accuracywaswasused
usedtototest
testthe
thestrawberry
strawberryclassification
classification
function.The
function. Theaccuracy
accuracyrateratewas
wascalculated
calculatedbybycomparing
comparingthe thecategory
categoryclassified
classifiedbybythe
the
strawberryclassification
strawberry classification model
model andand
thethe category
category classified
classified by expert.
by the the expert.
The The classifica-
classification
tion model
model was created
was created using using the strawberry
the strawberry training
training data indata
Tablein 5Table 5 and
and the the YOLO
YOLO algo-
algorithm.
The training
rithm. of the classification
The training model (i.e.,
of the classification YOLO
model (i.e.,V3) was V3)
YOLO repeated 50,020 times
was repeated in 12
50,020 h
times
and
in 5 min.
12 h andFour
5 NVidia
min. Four GTX 1080ti
NVidia graphic
GTX cards
1080ti werecards
graphic used were
for training.
used Figure
for 6 shows
training. an 6
Figure
Electronics 2021, 10, x FOR PEER REVIEW 12 of 16
average
shows an lossaverage
rate of the
losstraining data
rate of the of 0.0328
training forof50,019
data 0.0328iterations
for 50,019 initerations
the YOLOinV3 themodel.
YOLO
V3 model.
Figure6.6.Average
Figure Averageloss
lossrate
rateofoftraining
trainingdata
datafor
forthe
thestrawberry
strawberryclassification
classificationmodel.
model.
The training data in Table 4 were labeled to be optimized for the YOLO algorithm.
For this reason, comparison with other methods is meaningless; therefore, in this paper,
the YOLO V2, YOLO V3, TinyYOLO V2 and TinyYOLO V3 models are compared. YOLO
V1 was excluded from the evaluation due to its low accuracy. YOLO models were created
by transfer learning with the training data in Table 5 on the basic models of YOLO V2,Electronics 2021, 10, 1400 12 of 15
The training data in Table 4 were labeled to be optimized for the YOLO algorithm. For
this reason, comparison with other methods is meaningless; therefore, in this paper, the
YOLO V2, YOLO V3, TinyYOLO V2 and TinyYOLO V3 models are compared. YOLO V1
was excluded from the evaluation due to its low accuracy. YOLO models were created by
transfer learning with the training data in Table 5 on the basic models of YOLO V2, YOLO
V3, TinyYOLO V2, and TinyYOLO V3. The 4327 evaluation objects in 1575 strawberry
photos consist of photos taken directly from strawberry farms and photos retrieved from a
Google Images search. Figure 7 shows the comparison results of the average accuracy rates
of the YOLO models for 4327 evaluation objects. In Figure 7, the average accuracy of YOLO
V3 is approximately 3.667% higher than that of YOLO V2, 9.477% higher that of TinyYOLO
V3 and 6.
Figure 16.247%
Averagehigher that
loss rate of TinyYOLO
of training data for V2. Due to theclassification
the strawberry well-labeled training data and
model.
well-generated models, the accuracy rates of YOLO V3 and YOLO V2 are considered to be
high. The
As the weight
training of the
data TinyYOLO
in Table 4 weremodel
labeled is to
smaller than thatfor
be optimized ofthe
YOLO,
YOLO thealgorithm.
training
data are not well reflected in the generated model. As a result of analyzing 75
For this reason, comparison with other methods is meaningless; therefore, in this paper,misclassified
strawberry
the YOLO objects
V2, YOLOwithV3,
YOLO V3, theV2
TinyYOLO objects overlap oneV3
and TinyYOLO another
models orare
thecompared.
pictures are out
YOLO
ofV1focus.
was excluded from the evaluation due to its low accuracy. YOLO models were created
Figure 8learning
by transfer shows thewithprocess of calculating
the training data inthe NDVI
Table value
5 on the from
basic amodels
strawberry picture.
of YOLO V2,
As shown in Figure 8a, after selecting a strawberry object from a strawberry photo using
YOLO V3, TinyYOLO V2, and TinyYOLO V3. The 4327 evaluation objects in 1575 straw-
a strawberry classification model, the coordinates of the object are extracted. As shown
berry photos consist of photos taken directly from strawberry farms and photos retrieved
in Figure 8b, the NDVI values are calculated by using the coordinates of each object
from a Google Images search. Figure 7 shows the comparison results of the average accu-
and Equation (1). Figure 8(1,2) were classified as label 1, which is 30% mature, by the
racy rates of the YOLO models for 4327 evaluation objects. In Figure 7, the average accu-
strawberry classification model. Figure 8(3) was classified as label 4, which is 80% mature,
racy of YOLO V3 is approximately 3.667% higher than that of YOLO V2, 9.477% higher
by the strawberry classification model. In general, the NDVI value approaches −1 as the
that of TinyYOLO V3 and 16.247% higher that of TinyYOLO V2. Due to the well-labeled
strawberry matures, and the NDVI value approaches 1 the more immature the strawberry is.
training data and well-generated models, the accuracy rates of YOLO V3 and YOLO V2
The NDVI values of the strawberry objects in Figure 8(1,2) are very different. It is analyzed
are considered to be high. As the weight of the TinyYOLO model is smaller than that of
that the NDVI value is different because the intensity of the light source of the strawberry
YOLO, the training data are not well reflected in the generated model. As a result of ana-
photos is different. In order to calculate an accurate NDVI value, an environment with a
lyzing 75 misclassified strawberry objects with YOLO V3, the objects overlap one another
light source of constant intensity is required, such as a smart farm factory using LEDs.
or the pictures are out of focus.
Figure 7. Result of comparison of the YOLO models for 4327 evaluation objects.
Figure 7. Result of comparison of the YOLO models for 4327 evaluation objects.
Figure 8 shows the process of calculating the NDVI value from a strawberry picture.
As shown in Figure 8a, after selecting a strawberry object from a strawberry photo usingthe strawberry classification model. In general, the NDVI value approaches −1 as the
strawberry matures, and the NDVI value approaches 1 the more immature the strawberry
is. The NDVI values of the strawberry objects in Figure 8(1,2) are very different. It is ana-
lyzed that the NDVI value is different because the intensity of the light source of the straw-
Electronics 2021, 10, 1400 berry photos is different. In order to calculate an accurate NDVI value, an environment13 of 15
with a light source of constant intensity is required, such as a smart farm factory using
LEDs.
Figure 8. The process of calculating the NDVI value of the strawberry object.
Figure 8. The process of calculating the NDVI value of the strawberry object.
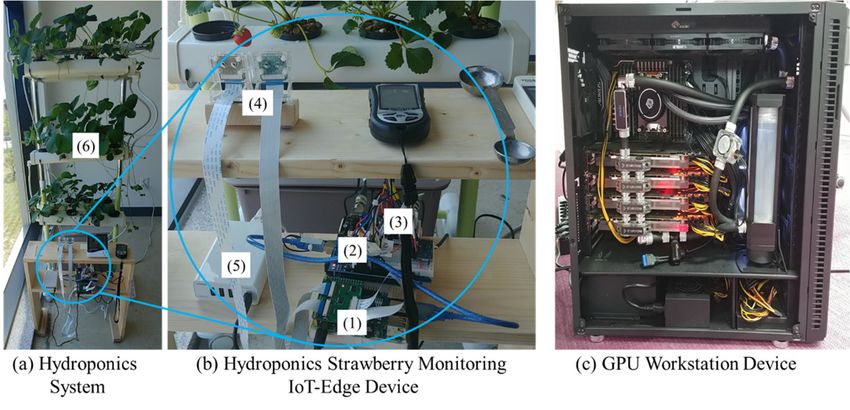
4.4.Visualization
4.4. VisualizationServer
ServerforforStrawberry
StrawberryMonitoring
Monitoringand andHarvest
HarvestDecision
Decision
Onthe
On thevisualization
visualizationserver,
server,the
themonitoring
monitoringand andanalysis
analysisresults
resultscan
canbebevisualized
visualized
withan
with anintegrated
integratedinterface
interfacetotouse
usevarious
variousbasic
basicdata
datafor
forgrowing
growingstrawberries.
strawberries.Figure
Figure99
showsthe
shows thevisualization
visualization of of
thethe monitored
monitored strawberry
strawberry environment
environment data data andstrawberry
and the the straw-
berry classification
classification results
results with with relation
relation to harvest to determination.
harvest determination.
Figure 9aFigure
shows 9atheshows
result ofthe
classifying strawberry photos by using the strawberry classification function of the analysisof
result of classifying strawberry photos by using the strawberry classification function
the analysis
server and theserver and the
IoT-Edge’s IRIoT-Edge’s
cut camera.IRThere
cut camera.
are threeThere are three
strawberry strawberry
objects objects
in the photo.
in the
One photo.
object wasOne object was
classified classified
as 30% mature,as 30% mature,
but the otherbut
twotheobjects
other two
wereobjects were not
not classified
classified
because theybecause they overlapped
overlapped each other.each
Figureother. Figurethe
9b shows 9b visualization
shows the visualization of envi-
of environmental
data, such as
ronmental humidity,
data, such astemperature, water temperature,
humidity, temperature, light, ultraviolet,
water temperature, CO2 , altitude,
light, ultraviolet, CO2,
pressure,
altitude, pH and dissolved
pressure, oxygen, stored
pH and dissolved oxygen, instored
the database server. Visualization
in the database of the
server. Visualization
NDVI
of thevalues
Electronics 2021, 10, x FOR PEER REVIEW NDVI was valuesexcluded from the
was excluded visualization
from server because
the visualization the intensity
server because of of
light
the intensity
14 16 of
constantly changed in the natural light environment.
light constantly changed in the natural light environment.
Figure 9. Visualization of the strawberry environment monitoring and the harvest decision.
Figure 9. Visualization of the strawberry environment monitoring and the harvest decision.
5. Conclusions
In this study, we designed and implemented a system that monitors the strawberry
hydroponic cultivation environment and determines the harvest time of strawberries. The
proposed system uses an IoT-Edge module to collect strawberry hydroponic environment
data and strawberry photos. The collected environmental data and strawberry photos areElectronics 2021, 10, 1400 14 of 15
5. Conclusions
In this study, we designed and implemented a system that monitors the strawberry
hydroponic cultivation environment and determines the harvest time of strawberries. The
proposed system uses an IoT-Edge module to collect strawberry hydroponic environment
data and strawberry photos. The collected environmental data and strawberry photos
are transferred to a nano-sized private AI-Cloud-based analysis station module and are
visualized and determined when harvesting. The monitoring and analysis results visual-
ized with an integrated interface provide a variety of basic data, such as varying yields,
harvest times and pest diagnosis for strawberry cultivation. The proposed system was
designed with the concept of an AI-Cloud, and the server container can be flexibly and
easily increased if the system needs to be expanded. While growing Seolhyang strawberries
in a home hydroponic cultivation system, the proposed monitoring system was tested
by monitoring 1,316,848 actual environmental data pieces related to 13 data types over
a period of 4 months. The proposed harvest decision system predicted the harvest time
using 1575 strawberry pictures acquired from the Smart Berry Farm and a Google Images
search and showed a high accuracy rate of 98.267%. As future research, we plan to study
analysis methods that analyze the monitored strawberry growing environment data. In
addition, we plan to study how the analysis results affect strawberry maturity.
Author Contributions: Conceptualization, S.P. and J.K.; methodology, S.P.; software, S.P.; validation,
S.P. and J.K.; formal analysis, S.P.; investigation, S.P.; resources, S.P. data curation, S.P.; writing-
original draft preparation, S.P.; writing-review and editing, J.K.; visualization, S.P. All authors have
read and agreed to the published version of the manuscript.
Funding: This research was funded by Artificial Intelligence Graduate School Program (GIST).
Data Availability Statement: The data used to support the findings of this study are included within
the article.
Acknowledgments: This work was supported by Institute of Information and Communications
Technology Planning and Evaluation (IITP) grant funded by the Korean government (MSIT) (No.2019-
0-01842, Artificial Intelligence Graduate School Program (GIST)).
Conflicts of Interest: The authors declare no conflict of interest.
References
1. Global Strawberry Market Size. Available online: https://www.thecowboychannel.com/story/43599204/fresh-strawberry-
market-2021-is-estimated-to-clock-a-modest-cagr-of-34nbspduring-the-forecast-period-2021-2026-with-top-countries-data (ac-
cessed on 4 May 2021).
2. Worldwide Strawberry Production. Available online: https://www.hortidaily.com/article/9252391/global-strawberry-
production-up-by-almost-40/ (accessed on 4 May 2021).
3. Han, J.S.; Hong, Y.J.; Kim, J.W. Refining Microservices Placement Employing Workload Profiling Over Multiple Kubernetes
Clusters. IEEE Access 2020, 8, 192543–192556. [CrossRef]
4. Han, J.S.; Park, S.; Kim, J.W. Dynamic OverCloud: Realizing Microservices-Based IoT-Cloud Service Composition over Multiple
Cloud. Electronics 2020, 9, 969. [CrossRef]
5. Bharti, N.K.; Dongargaonkar, M.D.; Kudkar, I.B.; Das, S.; Kenia, M. Hydroponics System for Soilless Farming Integrated with
Android Application by Internet of Things and MQTT Broker. In Proceedings of the 2019 IEEE Pune Section International
Conference (PuneCon), Pune, India, 18–20 December 2019.
6. Joshitha, C.; Kanakaraja, P.; Kumar, K.S.; Akanksha, P.; Satish, G. An eye on hydroponics: The IoT initiative. In Proceedings of the
7th International Conference on Electrical Energy Systems (ICEES), Chennai, India, 11–13 February 2021.
7. Herman; Surantha, N. Intelligent Monitoring and Controlling System for Hydroponics Precision Agriculture. In Proceedings of the
7th International Conference on Information and Communication Technology (ICoICT), Kuala Lumpur, Malaysia, 24–26 July 2019.
8. Fakhrurroja, H.; Mardhotillah, S.A.; Mahendra, O.; Munandar, A.; Rizqyawan, M.I.; Pratama, R.P. Automatic pH and Humidity
Control System for Hydroponics Using Fuzzy Logic. In Proceedings of the 2019 International Conference on Computer, Control,
Informatics and Its Applications (IC3INA), Tangerang, Indonesia, 23–24 October 2019.
9. Verma, M.S.; Gawade, S.D. A machine learning approach for prediction system and analysis of nutrients uptake for better crop
growth in the Hydroponics system. In Proceedings of the International Conference on Artificial Intelligence and Smart Systems
(ICAIS), Coimbatore, India, 25–27 March 2021.You can also read