Acute Hospital Activity and NHS Beds Information in Scotland - Annual - Year ending 31 March 2018 25 September 2018 - ISD Scotland
←
→
Page content transcription
If your browser does not render page correctly, please read the page content below
Information Services Division

            Acute Hospital Activity
            and NHS Beds
            Information in Scotland
            Annual – Year ending 31 March 2018

                                                     25 September
                                                     2018

                            A National Statistics publication for Scotland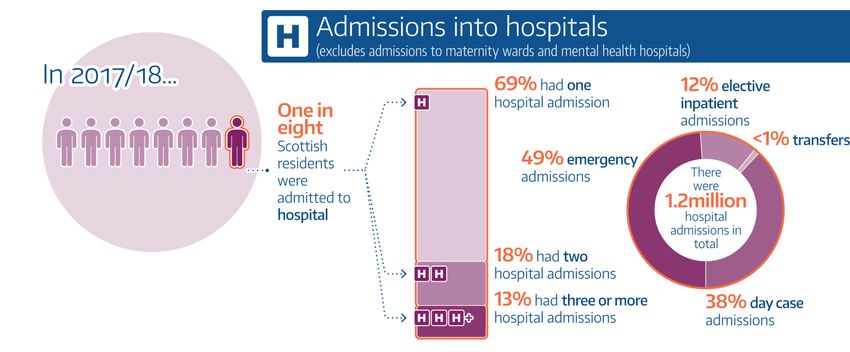
Information Services Division

This is a National Statistics Publication

National Statistics status means that the official statistics meet the highest standards of
trustworthiness, quality and public value. They are identified by the quality mark shown
above.
They comply with the Code of Practice for statistics and are awarded National Statistics
status following an assessment by the UK Statistics Authority’s regulatory arm. The Authority
considers whether the statistics meet the highest standards of Code compliance, including
the value they add to public decisions and debate.

Find out more about the Code of Practice at:
https://www.statisticsauthority.gov.uk/osr/code-of-practice/

Find out more about National Statistics at:
https://www.statisticsauthority.gov.uk/national-statistician/types-of-official-statistics/

                                                  1
Information Services Division

Contents

Introduction .............................................................................................................................. 3
Background .............................................................................................................................. 3
Future Developments ............................................................................................................... 4
Main Points .............................................................................................................................. 5
Results and Commentary......................................................................................................... 7
   Section A: The use of outpatient services ............................................................................ 7
   ‘Did Not Attends’ at outpatient clinics ................................................................................... 9
   Section B: Accident and Emergency .................................................................................. 11
   Section C: Acute hospital admissions................................................................................. 13
   Multiple admissions to hospital ........................................................................................... 15
   Episodes of Care ................................................................................................................ 15
   How long do people stay in hospital? ................................................................................. 16
   Beds ................................................................................................................................... 19
   Reasons for admission ....................................................................................................... 20
   What procedures are carried out? ...................................................................................... 22
   Where are patients treated? ............................................................................................... 23
   Section D: Psychiatric Hospital Activity .............................................................................. 25
   Section E: Now and then – a brief look over the past two decades .................................... 27
Glossary ................................................................................................................................. 29
List of Tables .......................................................................................................................... 32
Contact................................................................................................................................... 33
Further Information ................................................................................................................ 33
Rate this publication ............................................................................................................... 33
Appendices ............................................................................................................................ 34
   Appendix 1 – Background information ................................................................................ 34
   Appendix 2 – Data Quality and Completeness ................................................................... 35
   Appendix 3 – Publication Metadata .................................................................................... 37
   Appendix 4 – Early access details ...................................................................................... 42
   Appendix 5 – ISD and Official Statistics ............................................................................. 43

                                                                      2
Information Services Division

Introduction
The NHS in Scotland delivers a wide range of specialist care and treatment to the people of
Scotland. Services provided in NHS hospitals are diverse ranging across specialist diagnostic
procedures to complex and life saving surgery to meet both planned and emergency needs.
This publication provides a general overview of the use of hospital services for the financial
year ending 2017/18 using routinely collected data. This overview is primarily based on the
range of acute medical and surgical hospital services that are provided in Scotland and
covers most of the inpatient, day case and outpatient services used by patients. Additionally,
there are sections on Accident & Emergency and Psychiatric activity. The overall expenditure
associated with acute services is around £4.6bn, which represents around 41% of total NHS
spend1. Admissions into maternity wards are not part of this report.
As well as reporting on activity within 2017/18, some trend information highlighting changes
in service provision over the past twenty years is also presented. Note that individual figures
referred to throughout this report may not add up to totals, due to rounding.
As well as this narrative, detailed information is given in a set of data tables which
accompany this report and can be accessed here. These tables include statistical information
on the medical diagnoses of patients, the number and type of surgical procedures that are
carried out, and the level of emergency hospital admissions. Information is available at NHS
Board level, as well as council area and hospital level (for selected data tables).

Background
There are two broad ways in which patients access and make use of acute hospital services.
The first is part of a planned or elective pathway of care which is normally initiated following a
visit to the GP or other healthcare professional, and may result in a referral to see a
consultant as an outpatient for specialist advice or diagnosis. This outpatient appointment
may then result in an onward referral for further tests or admission into hospital for treatment.
The second way in which patients make use of hospital services is as a result of an
emergency referral either by a healthcare professional or directly by the patient themself.
This may be via an Accident & Emergency department, directly to Ambulatory Emergency
Care or to an Acute Assessment Unit, where it will be decided if the patient needs to be
admitted to an inpatient ward; different models of emergency care are evolving to meet the
challenge of increased complex cases and improved outcomes for patients.
Further information on emergency admissions and unscheduled care can be found within this
report, here and within the Emergency Department Activity pages on the ISD website.
Within this report, the overview of outpatient activity and services is presented first, followed
by information on attendances at Accident and Emergency departments. Next, information is
presented on the number and type of acute hospital admissions, followed by a summary of

1
  http://www.isdscotland.org/Health-Topics/Finance/Costs/ The overall expenditure figure of £4.6bn refers
to acute expenditure from the Cost Books (R310) for inpatient, day cases, outpatient, accident and emergency,
and day patient.

                                                      3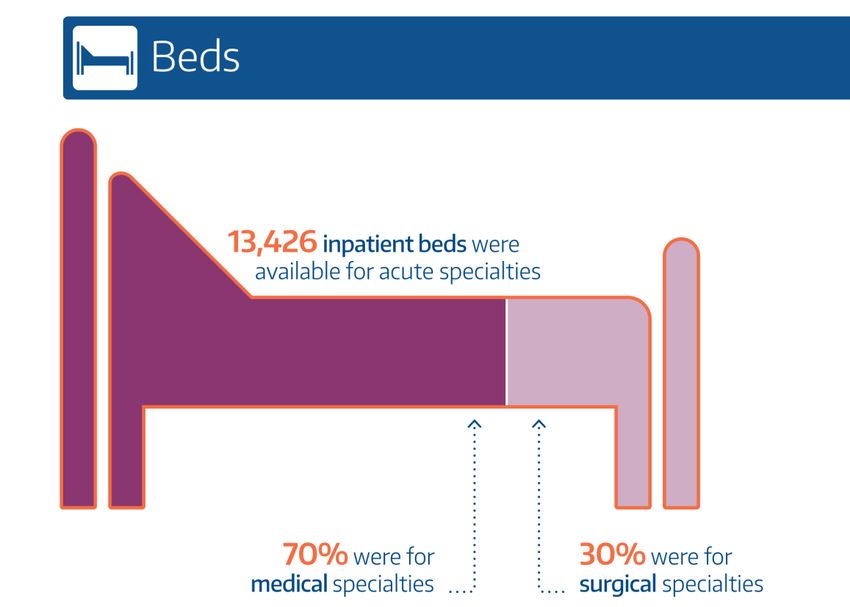
Information Services Division

psychiatric hospital admissions. The final section presents a snapshot of some of the ways in
which hospital care has changed over the past 20 years.
Note -This report uses the terminology “admissions” to describe hospital activity in the
reported periods. Strictly speaking the activity actually refers to the number of patients who
are discharged from hospital in the reported time period rather than those admitted within that
period. The difference between admissions and discharges is of small importance at the level
of detail shown and in the context of this publication.

Future Developments
In December 2016 the Scottish Government published “The Modern Outpatient: A
Collaborative Approach 2017-2020” that aims to deliver care closer to the patients home,
provide more person-centred care, utilise new and emerging technologies, and maximise the
role of clinicians across Primary, Secondary and community based services. NHS Greater
Glasgow & Clyde Orthopaedic Department are currently piloting a new outpatient service
delivery model that reflects the “Modern Outpatient”. ISD Data Advice has identified gaps in
the existing national dataset (SMR00) that does not allow the full pathway to be appropriately
recorded.
In order to meet the objectives set out in the “Modern Outpatient” agenda and to ensure our
secondary care datasets meet future information needs, ISD is establishing a modernisation
program of all SMR datasets, with an initial focus on outpatients, to take account of new, and
future, service delivery models. This would support patient and service management at Board
level as well as providing more accurate information at a national level.
The SMR00 Modernisation work may have an effect on the number of SMR’s submitted. In
addition, other disciplines of staff are increasingly carrying out care for patients which may
impact on the number of consultant clinics run.

                                               4
Information Services Division
Main Points
Table 1: Summary of key statistics 2017/18
1.07 million Scottish residents (around one in five of the population) visited an
outpatient department in 2017/18.
For 2017/18:
- 824,000 people (77%) had one new outpatient attendance within the year
- 187,00 people (17%) had two new attendances
- 64,000 people (6%) had three or more new attendances
Outpatient Services
Resulting in a total of 1.42 million new outpatient attendances.
(excludes maternity and mental
health clinics)
Overall there were 4.23 million total outpatient attendances; a 6% decrease on last
year, with a 7% reduction in the last five years (2012/13).
9.4% (146,817) of new outpatient appointments were not kept without prior
notification (‘Did Not Attends’), lower than 2016/17 and 2012/13 at 9.5% and 10.2%
respectively.
In 2017/18, people aged 25-44 were three times more likely not to keep their new
outpatient appointment compared to those aged 65 and over (15% vs. 5%).
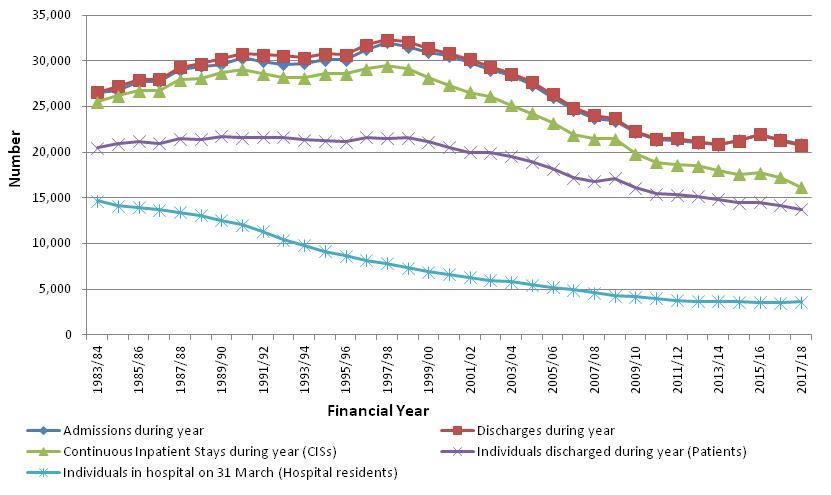
Around 693,000 Scottish residents (one in eight of the population) were admitted to
hospital in 2017/18. Of these, 69% had a single admission to hospital with three out
of ten people having more than one admission:
- 478,000 people (69% of those admitted to hospital) had one admission to
hospital
- 124,000 (18%) had two hospital admissions
- 91,000 (13%) had three or more admissions
There were a total of 1,201,785 admissions into hospital in 2017/18; a small
Admissions into hospitals reduction (2%) compared to last year and a 1% increase compared to 2012/13.
(excludes admissions to maternity For 2017/18:
wards and mental health hospitals)
- 454,477 (38%) were treated in a day case setting
- 149,766 (12%) were elective inpatient admissions
- 592,219 (49%) were emergency admissions
- 5,323 (Information Services Division
Length of stay In 2017/18, the average length of stay in hospital for elective inpatients is 3.6 days
and for an emergency inpatient is 6.8 days.
Beds The average number of available hospital beds in Scotland has been decreasing
over the years. In 2017/18, the available beds for acute specialties was 13,426; a 2%
decrease on last year and a 4% reduction when compared to 2012/13.
- 9,394 (70%) were for medical specialties
- 4,033 (30%) were for surgical specialties.
Source: Outpatient data are based on SMR00 & ISD(S)1, Inpatient data come from SMR01 data, Beds data come from
ISD(S)1.
Trend information on acute activity and beds data can be found in the publication’s tables.
6Information Services Division
Results and Commentary
Section A: The use of outpatient services
The majority of interactions with hospital-based services were carried out in an outpatient
setting with around 4.23 million outpatient attendances in 2017/18. An outpatient appointment
will often be the patient’s first contact with hospital services. In 2017/18, 1.07 million people
i.e. around one in five of the general population attended a consultant-led outpatient clinic at
least once during the year.
The likelihood of being referred to an outpatient clinic increases significantly with age. Almost
one third of the population (31%) aged 65 and over were seen at an outpatient clinic, while
around one in six (17%) of those aged 25-44 did so. The chart below shows the percentage
of the population attending consultant outpatient services.
7Information Services Division
Chart 1: Percentage of the population attending consultant outpatient clinics in
2017/18 by age group
Source: Outpatient data are based on SMR00, Population data comes from National Records of Scotland.
The vast majority of people attending usually have only one new outpatient attendance per
year, although a small proportion of people do have multiple attendances. In 2017/18,
• More than three out of four of the people (824,000) attending an outpatient clinic had
one attendance
• 17% (187,000) had two attendances
• 6% (64,000) had three or more attendances.
Overall, there was a total of 4,233,550 outpatient attendances (new and follow-up) in
Scotland. The total number of new outpatient attendances in 2017/18 was 1,418,667
(excluding A&E attendances). For each new referral to outpatient, there is then, on average,
a further two follow-up attendances at the clinic, although the actual number of return
appointments for any individual patient will vary depending on the reason for referral and
treatment required.
Detailed information on Outpatient attendances for each NHS Board and specialty can be
found here.
8Information Services Division
‘Did Not Attends’ at outpatient clinics
People do not always attend their booked outpatient clinic. Whilst some patients will inform
the hospital that they cannot attend, 9.4% of new outpatient appointments are missed without
prior notification. This equates to 146,817 patients not turning up for their first outpatient
appointment.
The likelihood of someone not turning up for their appointment was linked to their age and
gender. Males were more likely than females not to keep their appointments (10.4% vs.
8.6%). People aged 25–44 were three times more likely not to turn up for their appointment
than patients aged 65 and over (15% vs. 5%). Chart 2 shows, for different age groupings, the
percentage of new appointments that were not kept.
Chart 2: Level of non-attendance (% Did Not Attends) in 2017/18 by age group
Source: SMR00 data.
There was significant variation between NHS Boards and specialties in the number of
patients who did not attend their appointments. Annual data for year ending March 2018
showed that just over 9% of appointments were missed without prior warning.
Detailed information on the level of Did Not Attends for each NHS Board and specialty can be
found here.
9Information Services Division
It should be noted that previous figures provided may have included an element of estimation
for any incomplete or outstanding data submissions. Therefore, subsequent data
submissions could be lower or higher than the estimated values. Previously, ISD(S)1 was
used to provide all the Outpatients information; however, this information is now sourced from
SMR00 excluding return attendances which uses ISD(S)1. Please note that SMR00 figures
contained within each publication may also be subject to change in future publications as
submissions may be updated to reflect a more accurate and complete set of data
submissions.
For details on all ongoing data issues please refer to the Data Issues and Completeness
document.
10Information Services Division
Section B: Accident and Emergency
Further Accident and Emergency (A&E) information and publications can be found on the
Emergency Department Activity pages on the ISD website. For more information, contact
nss.isdunscheduledcare@nhs.net.
In 2017/18 there were over 1.6 million attendances at around 90 locations providing A&E
services across Scotland. As well as 30 Emergency Departments, there are also minor
injuries units, community hospitals and health centres that carry out A&E related activity
which are typically GP or nurse led.
Attendances to A&E were generally higher in summer months and lower in winter months.
May saw the highest average daily number of attendances (4,853) with a second peak in
September (4,698), and January saw the lowest (4,163). One factor for the increase in
attendances during summer could be better weather encouraging outdoor pursuits and
resulting in an increase in the number of injuries presenting at Emergency Departments.
Around a quarter of A&E attendances in 2017/18 resulted in an admission to the same
hospital with the average daily number of admissions remaining relatively stable throughout
the year at around 1,060.
Chart 3: Average daily attendances at and admissions from A&E, 2017/18
More than two thirds (70%) of A&E attendances resulted in discharge to a place of residence.
11Information Services Division
Chart 4: Discharge destination from A&E, 2017/18
The number of attendances to A&E has remained relatively stable over the ten-year period
2008/09 to 2017/18 with a daily average of around 4,430.
There is a clear and consistent seasonal pattern with peaks in late spring/summer and
troughs in winter. May 2017 saw the highest number of average daily attendances (4,853)
and December 2010 the lowest (3,928).
Chart 5: Average daily attendances to A&E, 2008/09 – 2017/18
12Information Services Division
Section C: Acute hospital admissions
Although much hospital-based care is carried out on an outpatient basis, a significant number
of people have to be admitted to hospital for diagnosis or treatment. This can be part of a
planned pathway of care, such as the requirement for an operation following a consultation at
an outpatient clinic or a requirement for further diagnosis.
Alternatively the admission could be as a result of an emergency, for example, due to an
accident or perhaps an acute exacerbation of a condition.
When admitted to hospital, the patient is either treated on a same day basis, often referred to
as a day case, or as an inpatient, when the patient will normally spend at least one night in
hospital. Some inpatients may be discharged from hospital on the same day as their
admission.
Around one in eight (693,000) of the Scottish population had at least one admission into
hospital in 2017/18. Just over 325,000 people were admitted at least once as a planned
admission into hospital and a similar number of the population (367,000) were admitted as an
emergency. A small number of people had both planned and emergency admissions within
the year.
13Information Services Division
Chart 6: Percentage of the population admitted to hospital in 2017/18 by age group
Source: SMR01 data.
The likelihood of being admitted to hospital is, as expected, highly correlated with age,
reflecting the health status of the population. In 2017/18, around one person in three of the
Scottish population aged over 75 was admitted at least once to hospital. By way of contrast,
around one in twelve people aged 25-44 were admitted. The chart above shows, by age
grouping, the percentage of the population who were admitted to hospital in 2017/18.
Effect of population change in the future
The population aged 65 and over was expected to increase by 19% from 2016 to 20262.
Based on the above use of hospital healthcare services, this demographic shift in the
population will have significant implications for the future demand on hospital services. This is
a highly complex area. For further information please see here.
People living outwith Scotland
There was a small proportion of hospital admissions that were for people who were resident
from outwith Scotland. In 2017/18, there were approximately 8,000 such admissions,
equating to 0.7% of all admissions.
2
Based on National Records of Scotland projections - https://www.nrscotland.gov.uk/statistics-and-
data/statistics/statistics-by-theme/population/population-projections/population-projections-
scotland/2016-based/list-of-tables
14Information Services Division
Multiple admissions to hospital
Most people admitted to hospital had only one admission per year. However one third of
people who were admitted to hospital had at least two admissions. In 2017/18,
• 69% (478,000) of those people admitted to hospital had one admission
• 18% (124,000) had two hospital admissions
• 13% (91,000) were admitted three or more times within the year.
Of the 405,000 people who had at least one emergency admission, 299,000 (74%) had one
emergency admission into hospital, around 66,000 (16%) had two emergency admissions
and around 40,000 (10%) had three or more.
Overall, there were 1,201,785 admissions to hospital in 2017/18. Of these,
• 454,477 (38%) were treated in a day case setting
• 149,766 (12%) were planned inpatient admissions
• 592,219 (49%) were admitted an emergency
• 5,323 (Information Services Division
How long do people stay in hospital?
How long a patient stays in hospital will be strongly related to the complexity of any operation
carried out as well the underlying health condition of the person. Patients admitted as
emergencies generally stay longer than elective hospital admissions.
In 2017/18, the average length for an inpatient stay was 6.2 days. For:
• Planned admissions: the average length of stay was 3.6 days
• Emergency admissions: the average length of stay was 6.8 days.
The charts below show the length of stay profile for patients admitted to hospital. The first
chart shows the distribution for all admissions; the subsequent chart highlights the different
length of stay profiles experienced by planned and emergency admissions.
16Information Services Division
Chart 7: Length of Stay profile for all inpatients (all admissions) in 2017/18
Source: SMR01 data.
• One in five inpatient admissions were admitted and discharged on the same day
• The most common stay in hospital involves one overnight stay, which was
experienced by almost a quarter of all inpatient admissions
• Overall 45% of all inpatient admissions stayed one night or less in hospital
• 4% of admissions remained in hospital for more than four weeks.
17Information Services Division
Chart 8: Length of stay profile for Inpatients (Elective vs. Emergency) in 2017/18
Source: SMR01 data.
The length of stay profile for elective admissions differed from those admitted as
emergencies. Patients admitted as an inpatient following a planned referral tend to be in
hospital for shorter periods with 51% (76,921) staying no more than one night compared to
10% (15,013) staying for a week or more. By contrast, for patients admitted as an emergency
those staying no more than one night was 43% (259,363) and those staying for a week or
more was 21% (126,769); this often reflects the underlying health condition and multiple
morbidities of these patients.
Detailed information on length of stay can be found here.
18Information Services Division
Beds
The number of hospital beds has been reducing for many years. This is a result of both
medical advances which have led to shorter stays in hospital for patients including planned
day case procedures (see Chart 11) alongside a shift to treatment and care in a more
ambulatory setting or in the community.
The number of available hospital beds for acute specialties in Scotland in 2017/18 was
13,426. This compares with 14,020 in 2012/13 and 14,860 in 2008/09.
Detailed information on Bed numbers can be found here.
19Information Services Division
Reasons for admission
There are many reasons why a person might have to be admitted to hospital. It could, for
example, be due to an underlying health condition which requires treatment, monitoring or
further diagnosis; it could be as a result of a sudden deterioration in health status; or it could
be following a trauma incident.
The five most common diagnosis groupings, accounting for 57% of all admissions are shown
in the table below.
Table 2: Five diagnosis groupings accounting for the greatest number of hospital
stays, Scotland, 2017/18
Diagnosis grouping Specific conditions No of admissions Percentage
For example:-
Neoplasms Non-Hodgkin lymphoma, benign 184,174 15.2%
tumour, breast cancer
Diseases of the digestive For example:-
158,941 13.2%
system Appendicitis, pancreatitis
Symptoms, signs and ill For example:-
defined conditions, not Pain in throat and chest, abdominal 149,008 12.3%
elsewhere classified and pelvic pain
For example:-
Diseases of the Pneumonia, asthma, chronic
108,822 9.0%
respiratory system obstructive pulmonary disease
(COPD)
Injury, poisoning and For example:-
certain other Fracture of forearm, burns and
100,131 8.3%
consequences of corrosions, poisonings and toxic
external causes effects of substances.
Source: SMR01 data.
The medical diagnosis of patients who were admitted to hospital differs markedly as to
whether the admission was on a planned elective basis or as an emergency. For elective
admissions, four out of ten admissions were either for neoplasms (cancer-related / suspicion
of cancer) or were linked to the digestive system. For emergency admissions more than one-
third were for general ‘signs or symptoms’ or diseases of the respiratory system.
20Information Services Division
Table 3: Five diagnosis groupings accounting for the greatest number of hospital
stays, Elective and Emergency Admissions, Scotland, 2017/18
Elective Admissions Emergency Admissions
No. of % of No. of % of
Diagnosis Grouping Diagnosis Grouping
admissions total admissions total
Symptoms, signs and ill
Neoplasms 160,154 26.5 defined conditions, not 116,911 18.9
elsewhere classified
Diseases of the Diseases of the respiratory
97,594 16.2 95,417 15.4
digestive system system
Diseases of the Injury, poisoning and certain
musculoskeletal system 52,223 8.6 other consequences of 88,747 14.3
and connective tissue external causes
Factors influencing
health status and Diseases of the digestive
50,714 8.4 60,909 9.8
contact with health system
services
Diseases of the eye Diseases of the circulatory
48,160 8.0 60,124 9.7
and adnexa system
Source: SMR01 data.
Evidence from healthcare cost analyses in Scotland show that a small percentage of patients
(2%) consume a considerable amount of hospital and GP prescribing expenditure resources
(50%). Patients in this 2% population are referred to as the “High Health Gain” (HHG –
previously known as high resource individuals) cohort. As part of efforts to have evidence
based healthcare delivery ISD develop risk predictive tools that can be deployed locally
within partnerships to identify patients who might potentially fall into the HHG cohort and to
initiate anticipatory care plans for such patients. For more information on this area please
visit the Health & Social Care integration area of the ISD website.
See the Diagnosis by NHS Board of Residence table for further detailed data on the above.
Information on Diagnosis is also available by council area.
It should be noted that the figures for diagnosis groupings split by admission type may not
match exactly with figures presented in the corresponding excel data table for diagnosis. This
is due to differences in methodology when splitting by admission type. The magnitude of
these differences is small (ranging from 0% to 1%).
21Information Services Division
What procedures are carried out?
In 2017/18 there were a total of 1,172,626 procedures performed within the acute hospital
care setting (excluding diagnostic imaging and testing procedures). 33% (385,376) of all
procedures were carried out in an outpatient setting and 26% of procedures (304,084) were
associated with at least one overnight stay in hospital.
84% of all procedures were carried out as either a planned admission or in an outpatient
setting.
Some of the more common procedures that were carried out include,
• Eye related operations (such as cataracts) - there were 91,000 of these and they were
primarily carried out on older people
• ‘Operations on the mouth’ which include tooth extractions or fitting of orthodontic
appliance - these procedures were mainly carried out on children and there were
around 77,000 of them
• Various types of endoscopies which were used to assist with diagnosing conditions -
in total there were 189,000 endoscopies performed
• 32,000 procedures were for the removal of skin lesions
• 16,000 total Hip and Knee replacements were carried out.
A full listing of procedures is provided in the accompanying table.
22Information Services Division
Where are patients treated?
The majority of patients are treated in a hospital located in their own local NHS Board area.
However, around 1 in 8 admissions (12%) are to hospitals within other NHS Board areas.
The reasons for patients not being treated in their own NHS Board area will include the
provision of specialist national and regional services, where an emergency may have
occurred or it may simply reflect the natural ‘catchment’ area of a particular hospital, being
the closest to the patient.
The flow of patients between NHS Boards varies depending on whether the admission is an
emergency or not.
Overall about one in four elective inpatient admissions (25%) were referred for treatment
within another NHS Board area. A much smaller percentage of emergency admissions (6%)
were to hospitals outwith the patients’ own NHS Board area. Some of these patients may
have been subsequently transferred to another hospital.
In addition, all NHS Boards refer some patients to the Golden Jubilee National Hospital
(GJNH) in Clydebank. The GJNH provides a range of national and regional services as well
as being a national resource providing additional capacity to help meet the demand for
planned procedures from across Scotland. The GJNH treated 5% of all planned hospital
admissions in 2017/18.
Table 4: Flow of patients admitted to hospital between NHS Boards, Scotland, 2017/18
Admission Type % treated in own Board area % treated in another Board area
Outpatients 91% 9%
All Admissions 88% 12%
- Day case Admissions 86% 14%
- Inpatients (Planned) 75% 25%
- Inpatients (Emergency) 94% 6%
Source: SMR01 data.
23Information Services Division
The number of patients being treated in another NHS Board varies depending on which NHS
Board the patient resides in. As would be expected, there is less ‘flow out’ of patients from
the four teaching Boards that provide most of the specialist or regional services NHS Greater
Glasgow Clyde, NHS Lothian, NHS Grampian, NHS Tayside, compared with other NHS
Boards. Around 4%-5% of patients from these four NHS Boards were treated elsewhere,
which contrasts with 9% - 27% for other NHS Boards.
Information on Cross Boundary Flow is available here.
For details on all ongoing data issues please refer to the Data Issues and Completeness
document.
24Information Services Division
Section D: Psychiatric Hospital Activity
Psychiatric activity is analysed in more detail and explored together with mental health
presentations in general hospitals within the Hospital Inpatient Care of People with Mental
Health Problems in Scotland publication which is updated on an annual basis. The last
update was released on 07 November 2017 and contained data up to year ending March
2017. For further information on psychiatric hospital activity please contact
NSS.isdMENTALHEALTH@nhs.net.
The analysis below presents information on patients with mental health problems or learning
disability who have been cared for as inpatients or day cases in psychiatric hospitals or units
in Scotland up to 31 March 2018. It also includes records from certain care homes contracted
by NHS Boards to provide this care which allows for more comprehensive analysis of
inpatient mental health pathways in Scotland.
Chart 9 illustrates long-term trends for Scotland for five parameters: admissions, discharges,
continuous inpatient stays (CIS or ‘stays’), patients, and hospital residents (for psychiatric
specialties only). The time trend spans 35 years to visualise historic patterns, from financial
year 1983/84 until 2017/18.
Chart 9: Mental health inpatients1 in psychiatric specialties in Scottish hospitals2
number of admissions, discharges, CIS, patients and hospital residents, 1983/84 to
2017/183
Source: SMR04 Psychiatric Hospital Activity
1. Excludes discharges from the Learning Disability specialty.
2. The data include people from outwith Scotland who have been treated in Scottish hospitals, including those treated
in the state hospital.
3. The underlying data for this figure can be found on the ISD website.
25Information Services Division
There were just less than 21,000 admissions and discharges in psychiatric specialties in
2017/18, compared with over 21,000 in the previous year. Admissions and discharges initially
increased between 1983/84 and 1997/98 but have generally decreased since then. There
was a small decrease in continuous inpatient stays in 2017/18 compared with 2016/17
(16,160 and 17,230, respectively). The number of patients in 2017/18 (13,770) and 2016/17
(14,180) shows an overall decline in patient numbers year on year. Hospital residents have
increased slightly from 2016/17, with 3,640 residents in 2017/18 compared to 3,520 residents
in the previous year.
26Information Services Division
Section E: Now and then – a brief look over the past two decades
The way NHS care has been delivered over the past two decades has changed significantly.
This is often driven by advances in medical techniques and medication allowing patients
either to stay significantly less in hospital once they have been admitted or indeed avoiding
the need to be admitted at all. For example, the increased use of keyhole surgery has had a
significant impact on patients’ treatment and rehabilitation. This section describes some of
the changes that have taken place in the past twenty years.
An increasing amount of healthcare is now being delivered either as an outpatient or day
case, rather than in an inpatient ward. The chart below shows the number of admissions to
hospital over the past twenty years categorised as whether they were treated as an inpatient
or day case. Since 1998/99 the number of planned admissions into inpatient wards has fallen
by around 96,000 (-39%); whilst at the same time the number of patients treated as day
cases has increased by around 62,000 (+15%). In 2017/18, around 385,000 procedures were
carried out in an outpatient clinic. Data on the number of procedures carried out in outpatient
clinics was not comprehensively recorded in the earlier years but it is known that there has
been a shift to patients being treated in an ambulatory care setting wherever possible.
The number of emergency admissions has grown gradually over the 20 year period with, in
2017/18 around 134,000 more emergency admissions compared with 1998/99 (+29%). This
increase is strongly associated with the ageing population; for example there has been a
28%3 increase in the number of people aged 65+ over the same period. This changing profile
of treatment presented below shows a reduction in planned elective inpatient admissions and
the increase in the level of treatment delivered as a day case.
Chart 10: Patient Activity, Scotland, 1998/99 - 2017/18
Source: SMR01 data.
3
Based on National Records of Scotland mid-year estimates - https://www.nrscotland.gov.uk/statistics-and-
data/statistics/statistics-by-theme/population/population-estimates/mid-year-population-estimates
27Information Services Division
Table 6: Changes over time in NHS Care Delivery
Change Illustration
Greater use of Dermatology is now predominantly an outpatient based service.
outpatient services - In 1998/99, there were around 12,000 admissions to hospital for
dermatology and this has fallen to 1,000 in 2017/18. At the same
time, the number of new patients seen in outpatients has
increased from 81,000 to 115,000
More patients In Ophthalmology, the majority of patients admitted to hospital for eye-
being treated on a related conditions are now treated on a same day basis.
day case basis - In 1998/99, 43% of admissions were to an inpatient ward,
whereas in 2017/18, it is 10% of admissions
Increased use of Cholecystectomy (removal of gallbladder):
keyhole surgery - Nine out of ten patients now have this operation carried out using
keyhole surgery. More than 7,700 of these procedures were
carried out in 2017/18
- This allows patients to be sent home much more quickly. A
patient who undergoes this keyhole surgery stays in hospital 4
days less than someone who has more invasive surgery
- Over the past 20 years, the average length of stay for patients
undergoing a cholecystectomy has reduced from 5.6 days to 2.9
days.
Shorter lengths of The average time patients stay in hospital for total hip or knee
stay replacements has more than halved over the past 20 years
- Hip replacements: The average length of stay has fallen from
14.9 days to 6.5 days
- Knee replacements: The average length of stay has fallen from
13.0 days to 4.7 days
Source: Outpatient data are based on SMR00 data, Inpatient data come from SMR01 data.
28Information Services Division
Glossary
Acute Hospital Care/Activity Includes services such as: consultation with specialist clinicians;
emergency treatment; routine, complex and life saving surgery;
specialist diagnostic procedures; close observation and short-
term care of patients. 'Acute' hospital care includes activity
occurring in major teaching hospitals, district general hospitals
and community hospitals but excludes obstetric, psychiatric and
long stay care services.
Average available staffed beds The average daily number of beds, which are staffed and are
available for the reception of inpatients (borrowed and temporary
beds are included).
Average length of stay Mean stay per episode (in days) experienced by inpatients within
a specialty/significant facility etc over any period of time.
Continuous Inpatient Stay (CIS) Probability matching methods have been used to link together
individual SMR01 hospitals episodes for each patient, thereby
creating "linked" patient histories. Within these patient histories,
SMR01 episodes are grouped according to whether they form
part of a continuous spell of treatment (whether or not this
involves transfer between hospitals or even NHS Boards).
When showing information by CIS the admission type e.g.
elective/emergency is determined by the first admitting episode.
As a result transfers will generally not appear within the CIS
analysis. When a transfer does appear it is often the result of a
patient being transferred from another provider unit e.g. outwith
Scotland. However there will also be instances where the
admission type has been incorrectly coded, unfortunately it is not
possible to fully ascertain what the correct admission type
should have been. As a result a small proportion of transfers do
appear within the various tables.
Day case This is when a patient makes a planned attendance to a
specialty for clinical care, and requires the use of a bed or trolley
in lieu of a bed.
Discharge A discharge marks the end of an episode of care. Discharges
include deaths and transfers to other specialties/significant
facilities and hospitals as well as routine discharges home.
29Information Services Division
Elective / Planned Admission This is when the patient has already been given a date to come
to hospital for a planned procedure or treatment.
Emergency Admission Occurs when, for clinical reasons, a patient is admitted at the
earliest possible time after seeing a doctor.
Episode An SMR01 episode is generated when a patient is discharged
from hospital but also when a patient is transferred between
hospitals, significant facilities, specialties or to the care of a
different consultant.
Incidence This looks for the first occurrence of a diagnosis within a given
time period. The time period used for published data is a 5 year
incidence look back. For example, a patient is admitted in 2004
and again in 2005 for the same diagnosis. For the purpose of
counting incidence, only the hospital episode in 2004 is counted.
The 2005 episode would not be counted because the previous
episode occurred within 5 years.
Inpatient This is when a patient occupies an available staffed bed in a
hospital and either; remains overnight whatever the original
intention or is expected to remain overnight but is discharged
earlier.
Non-routine admission Occurs when an inpatient is discharged following an emergency;
unplanned admission (includes emergency transfers).
Occupancy (%) The percentage of available staffed beds that were occupied by
inpatients during the period.
Occupied Bed An occupied bed is an available staffed bed, which is either
being used to accommodate an inpatient or reserved for a
patient on pass.
OPCS4 Office of Population Censuses and Surveys Classification of
Surgical Operations and Procedures (4th revision).
Outpatient Is a patient who attends (outpatient attendance) a consultant or
other medical clinic or has an arranged meeting with a
consultant or a senior member of their team outwith a clinic
session. Outpatients are categorised as new outpatients or
follow-up (return) outpatients.
30Information Services Division
Patients This relates to individual patients. However, the same patient
can be counted more than once, if they change subgroup (e.g.
specialty, type of admission, NHS Board etc.). In these cases a
patient will be counted once within each subtotal, but only once
in the overall total.
For example if a patient was admitted three times in a single
year, twice as an emergency admission and once as an elective
admission, they would be counted once in each sub-total of
emergency and elective admissions, and once in the overall total
of admission types.
The same patient will also be counted for each of the financial
year they were admitted in hospital, for example if a patient was
admitted in 2010/11 and 2012/13 they would be counted in each
of these years.
Routine Admission Occurs when a patient is admitted as planned (includes planned
transfers).
Specialty is defined as a division of medicine or dentistry covering a
specific area of clinical activity. A full listing of specialties
covered by the data sets used in this publication is available on
the NHSScotland Health & Social Care data dictionary Specialty
Grouping web page.
Transfer Occurs when a patient needs to be moved to another doctor,
clinical specialty, and facility within the hospital or another
hospital altogether to receive the specialist care they require
after they have been admitted to hospital. The majority of these
transfers are planned (elective) transfers.
An inpatient’s admission can be an emergency, an elective or as a transfer.
Further details are available in the NHS Scotland Health & Social Care data dictionary.
31Information Services Division
List of Tables
File name File and size
Annual Trends in Consultant-led Outpatient Activity Excel 1.6 Mb
Inpatient and Day Case Activity By NHS Board Of Residence Excel 1.4 Mb
Inpatient and Day Case Activity by NHS Board of Treatment Excel 1.2 Mb
Inpatient and Day Case Activity by council area Excel 2.7 Mb
Emergency Admissions and Bed Days by NHS Board and council area Excel 6.6 Mb
Multiple Emergency Admissions and Bed Days by NHS Board and council area Excel 24.4 Mb
Average Length of Stay by NHS Board and Specialty Excel 610 Kb
Annual Trends in Available Beds by NHS Board of Treatment and Hospital Excel 3.9 Mb
Diagnosis by NHS Board of Residence Excel 11.1 Mb
Diagnosis by council area Excel 22.6 Mb
Number of Hospital Stays, Bed Days and Rates for selected Long Term Conditions Excel 5.9 Mb
Number and Types of Procedures carried out by NHS Board Excel 6.7 Mb
Cross Boundary Flows for Outpatients, Day cases and Inpatients Excel 129 Kb
32Information Services Division
Contact
Kirsty Anderson, Principal Information Analyst
Quality Indicators Secondary Care Team
Phone: 0141 282 2243
Email: kirstyanderson@nhs.net
Salomi Barkat, Senior Information Analyst
Quality Indicators Secondary Care Team
Phone: 0131 275 7871
Email: salomi.barkat@nhs.net
Róisín Farrell, Senior Information Analyst
Quality Indicators Secondary Care Team
Phone: 0131 314 1029
Email: roisinfarrell1@nhs.net
David Redpath, Senior Information Analyst
Quality Indicators Secondary Care Team
Phone: 0131 275 7498
Email: david.redpath@nhs.net
Quality Indicators Secondary Care Team
Email: nss.isdQualityIndicators@nhs.net
Further Information
Further Information can be found on the ISD website. For more information on Acute Activity
see the Acute Activity section of our website.
A selection of information from this publication is included in NHS Performs. NHS Performs is
a website that brings together a range of information on how hospitals and NHS Boards
within NHSScotland are performing.
The next release of this publication will be October 2019.
Rate this publication
Please provide feedback on this publication to help us improve our services.
33Information Services Division
Appendices
Appendix 1 – Background information
Data sources
Outpatient, inpatient and day case activity data are collected across NHSScotland and are
based on nationally available information routinely drawn from hospital administrative
systems across the country. The principal data sources are
- SMR00 (patient-level outpatients records) - source for outpatients (except return
attendances
- SMR01(inpatients and day cases discharges from non-obstetric and non-psychiatric
specialties) - source for acute inpatients and day cases, and
- ISD(S)1 (aggregate hospital activity) - source for bed data returns and return
outpatients
ISD(S)1 contains summarised data by NHS Board of Treatment, hospital and specialty. This
data return is in place to allow NHS Boards to report activity more frequently than that
recorded on SMRs. ISD(S)1 is also the only source of bed occupancy and availability data.
Revisions
All tables will be revised annually. In general these revisions have minimal effect on the
statistics. If missing/incomplete data is significant and is due to be submitted and published in
subsequent releases this will be highlighted within the notes on the affected table. Please see
the ISD revisions policy for further details.
NHS Boards can update both their current and historical data monthly. This may result in
changes in the recent data shown from one publication to another.
The data for 2017/18 is provisional. Provisional data is subject to change in future
publications as submissions may be updated to reflect a more accurate and complete set of
data submissions.
For any revisions relevant to this population please see Appendix 3 for further information.
34Information Services Division
Appendix 2 – Data Quality and Completeness
Data Quality
The ISD Data Quality Assurance (DQA) team is responsible for evaluating and ensuring SMR
datasets are accurate, consistent and comparable across time and between sources.
The DQA team’s assessments web page contains details of past Data Quality Assurance
Assessments of inpatient/day case data, including findings on the accuracy of submitted
SMR01 data items used in our analysis (specialty, admission type, main condition, main
operation etc). A data quality assurance assessment of SMR01 data items for 2014/15 was
released in July 2016.
Currently it is difficult to describe and quantify accurately the level of operations and clinical
procedures carried out in an outpatient setting. This is particularly relevant for monitoring how
changes in clinical practice have enabled the transfer of certain clinical activities, previously
requiring inpatient or day case admission, to outpatient clinics. Whilst outpatient procedure
recording has improved in recent years, gaps in the completeness and coverage remain.
It should be noted that that there are apparent differences between activity figures published
within the Hospital Care, Waiting Times and Finance web pages:
• The figures for elective admissions and new outpatients in the Acute Hospital Activity
publication are considerably higher than the equivalent information published on the
Waiting times web pages for inpatients, day cases and outpatients. This is largely due to
the use of different definitions for the two sets of figures.
• The figures for inpatient and day case activity in the Acute Hospital Activity publication
differ slightly when compared to the equivalent information released in the Finance web
pages. This is largely due to the use of different definitions for the two sets of figures. The
Finance publication also excludes consultant-only transfers from the inpatient figures.
For further information on the data sources and clinical coding used in this publication please
refer to the following Data Sources and Clinical Coding document.
SMR completeness
Information on SMR data completeness can be found on the Hospital Records Data
Monitoring SMR Completeness web page, while information on the timeliness of SMR data
submissions can be found on the SMR Timeliness web page. Details on completeness can
also be found within the Excel data files.
ISD are working with NHS Boards to resolve ongoing data submission issues. The majority of
these issues have resulted from implementation of the new PMS TrakCare system and other
existing system issues. Further details of these issues can be found here or within the data
issues and completeness document which accompanies this publication.
35Information Services Division
Estimations / provisional data
It should be noted that outpatient, inpatient, day case and beds figures may include an
element of estimation for any incomplete or outstanding data submissions. Where possible,
missing or incomplete ISD(S)1 data have been estimated for affected NHS Boards.
Estimates are based on an average of the last three submissions from the relevant NHS
Boards. This method of estimation would be used unless otherwise stated.
Therefore, data for the latest time period should be treated as provisional as subsequent data
submissions could be lower or higher than the estimated values. Specific issues are as
follows:
Outpatient
It should be noted that previous figures provided may have included an element of estimation
for any incomplete or outstanding data submissions. Therefore, subsequent data
submissions could be lower or higher than the estimated values. Previously, ISD(S)1 was
used to provide the Outpatients information; however, this information is now sourced from
SMR00 (except return outpatients). This is due to data quality concerns around return
outpatients in SMR00 for these time periods. Please note that SMR00 figures contained
within each publication may also be subject to change in future publications as submissions
may be updated to reflect a more accurate and complete set of data submissions.
Beds
NHS Grampian and NHS Highland
• NHS Grampian was unable to submit beds information between March 2011 and June
2014, to ISD due to system implementation problems. NHS Highland was unable to
submit beds information between October 2013 and December 2015.
• After exploring several methods trying to tie up ISD(S)1 data with SMR01 data for bed
days, we have taken a very simple approach to estimate the numbers of available beds
and the percentage occupancy for all specialties to cover these periods.
• We used a straight line extrapolation between the last and first known data points.
• We appreciate that the actual change in bed numbers may have been more of a step
change in service delivery at different points throughout the 5 year period, but feel
straight line estimation is the most pragmatic and proportionate solution to filling the
gaps.
For details on all ongoing data issues please refer to the Data Issues and Completeness
document.
36Information Services Division
Appendix 3 – Publication Metadata
Metadata Indicator Description
Publication title Acute Hospital Activity and NHS Beds Information in Scotland, September
2018
Description Summary of inpatient, day case and outpatient activity, including details about
specialties, diagnoses, procedures; emergency admissions, long term
conditions, and bed statistics for NHSScotland
Theme Health and Social Care
Topic Hospital Care
Format Excel, PDF
Data source(s) ISD(S)1 aggregated data returns (beds and return outpatients), Scottish
Morbidity Records SMR01 (inpatient/day case), SMR00 (outpatient –
excluding returns)
Date that data are acquired July 2018 (SMR00, SMR01, ISD(S)1)
Release date 25 September 2018
Frequency Annual
Timeframe of data and Detailed Annual Acute Hospital Activity Information up to March 2018
timeliness
Continuity of data Reports include a mix of 5 and 10 year trend annual data up to 2017/18.
Due to problems with the implementation of a new patient administration
system, no data were successfully extracted for NHS Grampian between
March 2011 and June 2014. NHS Highland has had similar problems
between October 2013 and December 2015. Missing data were estimated
and are presented in Annual Trends in Available Beds Table. More details on
this estimating process can be found in the Beds Methodology section found
in the Appendix.
Acute Assessment Unit (AAU) / Ambulatory Emergency Care (AEC)
activity
Definitions
• Acute Assessment Unit (AAU)
The AAU is a dedicated facility for the acute clinical care of patients
that present to hospital as clinical emergencies or who develop an
acute clinical problem while in hospital. The units may also carry out
some planned healthcare.
Generally these units have both trolleyed areas and staffed beds
which form part of the hospitals bed complement. Where trolleys are
used in lieu of beds, patients should be counted as inpatients.
Acute Assessment Unit (AAU) is the preferred term for services also
known as:
o medical/surgical assessment unit
o combined assessment units
o clinical assessment units
37Information Services Division
o acute medical (assessment) units
o paediatric assessment units
o acute receiving ward/unit admission unit
These cases should be recorded under significant facility 40.
• Ambulatory Emergency Care (AEC)
An Ambulatory Emergency Care Unit is a multidisciplinary ‘one stop’
service.
It provides Outpatient and Daycase services only.
These cases should be recorded under significant facility 39.
National recording of AAU & AEC activity
Currently AAU activity is only being submitted by some NHS Boards within
SMR01. NHS Greater Glasgow & Clyde AAU activity stopped in 2017. NHS
Highland have been submitting AEC cases via SMR01 using criteria agreed
by ISD to ensure that they pass validation rules as an interim measure. NHS
Greater Glasgow & Clyde has opted to record these cases differently from
NHS Highland since they consider a number of these cases to be non-
elective day cases which, due to recording rules, cannot be recorded that way
on Trakcare. As such they took the decision to record them as Emergency
Department activity to allow them to be able to follow the patient through the
system.
There are ongoing discussions with NHS Boards, the Scottish Government
and ISD on the most appropriate way for capturing this activity including AEC
cases. AEC is under the scope of SMR00 Modernising Review, and it is
hoped that national definitions and guidance on how to record this activity can
be agreed by all NHS Boards.
Revisions statement All revisions to data within this publication are planned and are due to
incomplete data returns at the time of publication. All tables will be revised
annually. In general these revisions have minimal effect on the statistics. If
data providers discover that data submitted for publication is incorrect, and/or
missing/incomplete and is significant, this can be re-submitted and published
in subsequent releases. Any changes will be highlighted within the notes on
the affected table. Please see the ISD revisions policy for further details.
Revisions relevant to this Change to Council Area/NHS Board codes:
publication
There has been a minor council area boundary change for Keltybridge and
Fife Environmental Energy Park at Westfield. The official implementation date
of this change is 2nd February 2018.
As a result, the following geographies are impacted and new 9-digit codes
have been generated: Council Areas, Electoral Wards, Health Boards, Health
and Social Care Partnerships, Police Divisions, Fire and Rescue, Postcodes
and LAU1.
The changes for geography codes commonly used by ISD are as follows:
38You can also read